
Are you looking for a simple yet powerful tool to determine the break-even point for your business? Our Break-Even Analysis Template in Excel is the perfect solution for entrepreneurs, business owners, and financial analysts who need quick insights into profitability. This easy-to-use template allows you to calculate the number of units you need to sell to cover costs, ensuring that your business stays on track for success.
What is Break-Even Analysis?
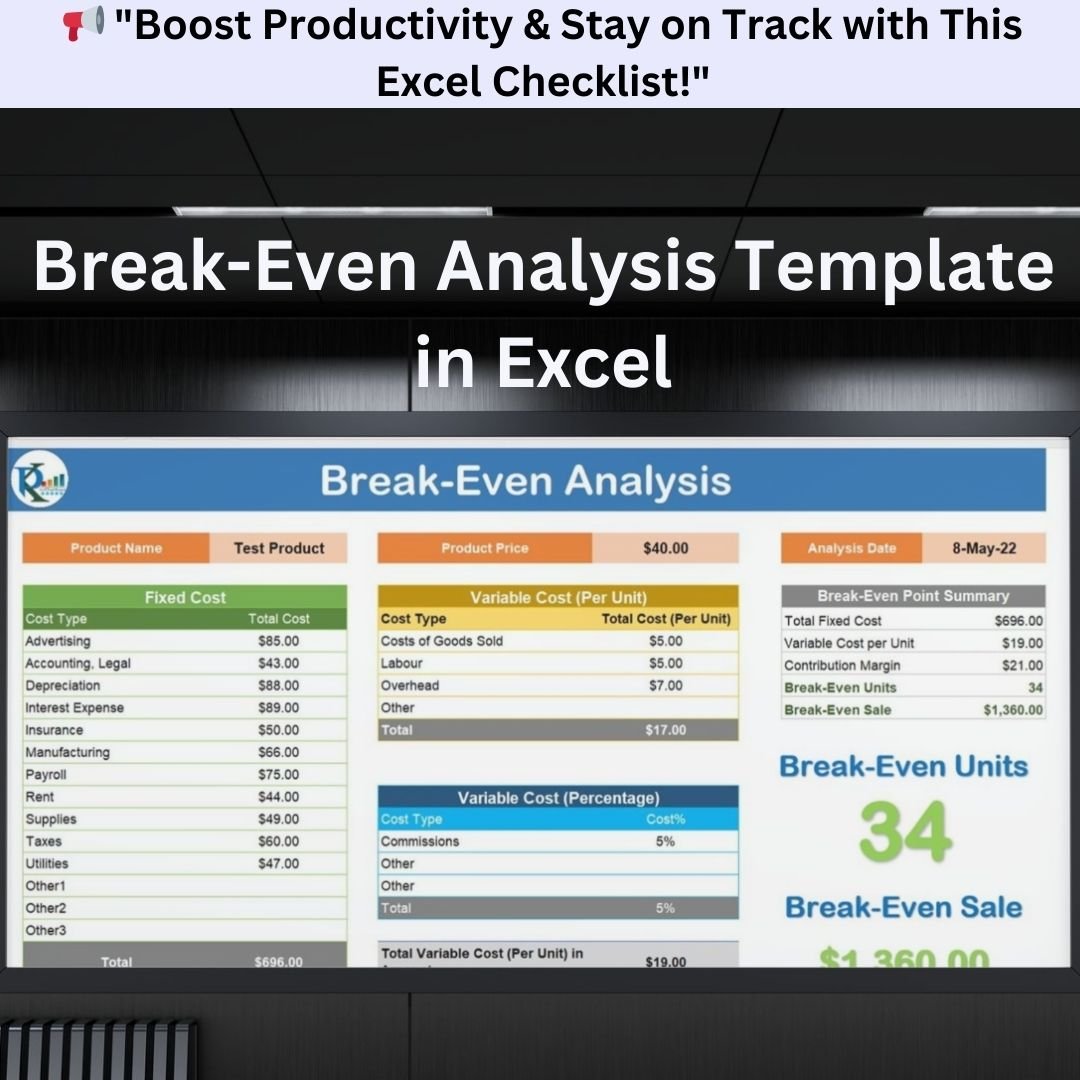
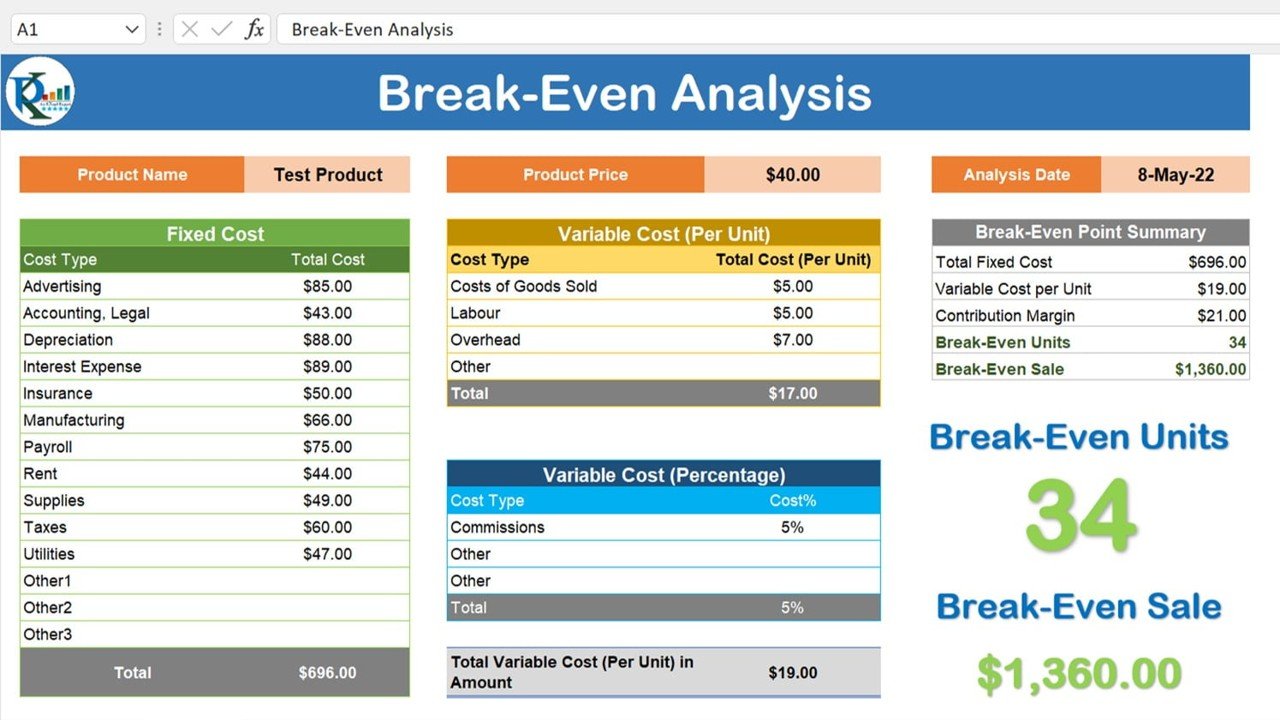
A Break-Even Analysis is a critical financial tool that helps businesses determine when they will start making a profit. It calculates the number of units or sales revenue required to cover fixed and variable costs. Knowing your break-even point helps in setting pricing strategies, controlling expenses, and planning for profitability.
Key Features of the Break-Even Analysis Template:
✔ Simple Data Input – Enter the product price, fixed costs, and variable costs to generate a complete break-even analysis.
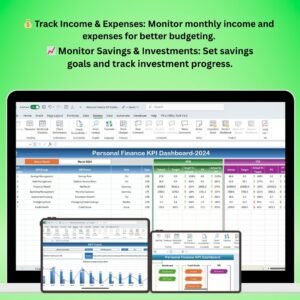
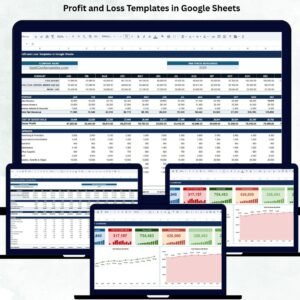
✔ Automatic Profit & Loss Calculation – The template automatically calculates total revenue, total costs, and net profit/loss based on the number of units sold.
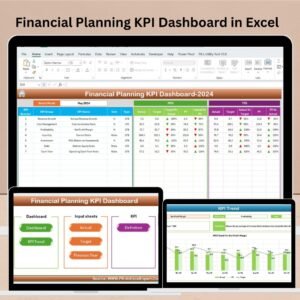
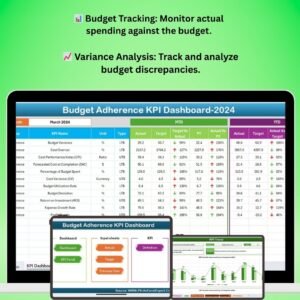
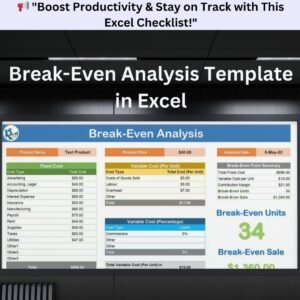
✔ Break-Even Point Visualization – Get an instant overview of how many units are needed to cover expenses and start making a profit.
✔ Customizable for Any Business Model – Whether you’re a small business, startup, or established company, this tool can adapt to various pricing models.
✔ Fixed & Variable Cost Segmentation – Easily categorize expenses like advertising, rent, labor, and overhead costs for a clearer financial picture.
✔ Dynamic Profit/Loss Table – The template dynamically updates based on sales volume, helping you make data-driven decisions.
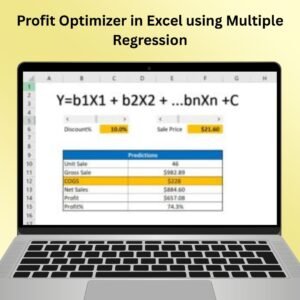
✔ Contribution Margin Analysis – Gain insights into how much each unit contributes to covering fixed costs and generating profit.
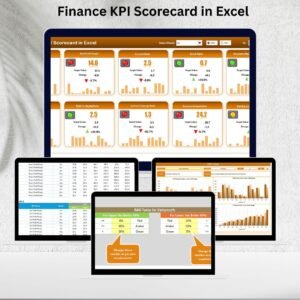
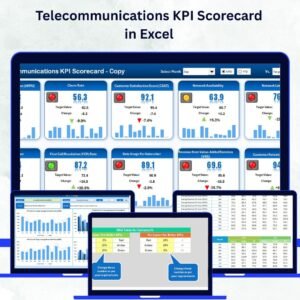
✔ Professional Layout & Design – Clean and structured format with color-coded sections for quick interpretation.
✔ Ready-to-Use Formula-Based Excel File – No need for complex formulas—just input your data and let Excel do the work.
✔ Cost Efficiency Insights – Helps businesses identify opportunities for cost reduction and margin improvement.
How It Works:
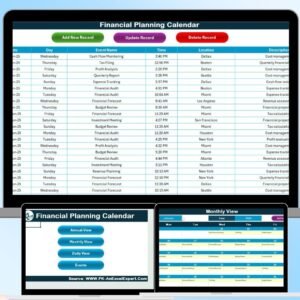
1️⃣ Enter Product & Pricing Details – Input the product name, selling price, and analysis date.
2️⃣ Define Fixed Costs – Add all non-changing expenses like rent, insurance, and salaries.
3️⃣ Set Variable Costs Per Unit – Include costs such as raw materials, commissions, and shipping fees.
4️⃣ Break-Even Summary Calculation – The template will automatically compute the break-even point, showing you the number of units to sell and revenue required.
5️⃣ Review the Profit/Loss Table – View profitability scenarios based on different sales volumes.
6️⃣ Adjust & Optimize – Modify pricing or costs to analyze how changes impact your break-even point.
Who Can Benefit from This Template?
✅ Startups & Entrepreneurs – Plan your pricing strategy before launching your business.
✅ Small Business Owners – Keep track of costs and profits to make informed financial decisions.
✅ Retail & E-Commerce Businesses – Determine the right pricing structure for your products.
✅ Consultants & Financial Analysts – Quickly generate break-even reports for clients.
✅ Freelancers & Service Providers – Calculate minimum work volume needed to sustain profitability.
Why Choose This Template?
Unlike generic financial spreadsheets, our Break-Even Analysis Template is built with user-friendly automation and pre-set formulas that eliminate manual calculations. It saves time, reduces errors, and provides clear financial insights, making it a must-have tool for any business.
Click here to read the detailed blog post
Visit our YouTube channel to learn step-by-step video tutorials
Watch the step-by-step video tutorial:
Also check our Download Attachments from Multiple Emails Automatically using VBA


Reviews
There are no reviews yet.