


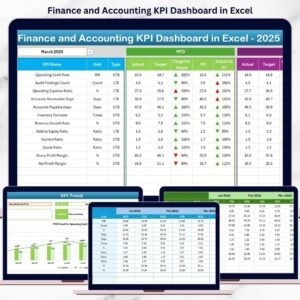
The Finance and Accounting Performance KPI Dashboard in Excel is a comprehensive and powerful tool designed for financial professionals, accountants, and business owners to track and analyze key financial and accounting metrics. This Excel-based dashboard allows you to monitor essential KPIs such as revenue, profit margins, cash flow, operating costs, and more, giving you a clear, real-time overview of your company’s financial health.
Whether you are managing a small business, an enterprise, or an accounting team, this dashboard helps you make informed decisions, improve financial reporting, and optimize your financial strategy. By integrating multiple financial data points, this dashboard enables you to understand trends, forecast outcomes, and ensure that your finances are aligned with organizational goals.
Key Features of the Finance and Accounting Performance KPI Dashboard in Excel
📊 Comprehensive Financial KPI Tracking
Track key financial indicators such as revenue, profit margins, operating costs, and cash flow. Monitor your financial health in real time and identify areas for improvement.
📈 Profitability & Cost Analysis
Analyze profitability ratios and track operational costs to improve cost management. Monitor the effectiveness of cost-cutting initiatives and assess overall profit margins.
📉 Cash Flow Management
Track incoming and outgoing cash flow, ensuring liquidity and identifying potential financial gaps. Use the data to make informed decisions on budgeting and investment.
⚙️ Budget vs. Actual Performance Tracking
Compare budgeted financial data against actual performance. Identify discrepancies and adjust strategies to stay within budget and meet financial goals.
📅 Time-Based Performance Monitoring
Monitor financial performance across various time periods—daily, monthly, quarterly, and yearly. Use this time-based tracking to identify trends, forecast financial outcomes, and plan for future growth.
📈 Customizable Metrics & KPIs
Tailor the dashboard to track the financial KPIs that matter most to your business. Add specific financial metrics, update categories, and customize data fields to reflect your unique financial reporting needs.
Why You’ll Love the Finance and Accounting Performance KPI Dashboard in Excel
✅ Real-Time Financial Insights
Monitor and manage your financial performance with ease. Stay on top of key metrics such as profit margins, revenue, and cash flow in one dashboard.
✅ Optimized for Financial Planning
Track budget vs. actuals to ensure financial targets are met. Make adjustments based on performance insights to align with business objectives and improve financial health.
✅ Improve Profitability & Cost Efficiency
Monitor cost management and identify opportunities to optimize operational expenses. Improve profit margins by focusing on cost-effective strategies.
✅ Data-Driven Decision Making
Use real-time data and visualizations to make informed financial decisions that will drive growth, enhance profitability, and reduce costs.
✅ Customizable & Scalable
The dashboard is fully customizable, allowing you to track any financial metric that’s important to your business. It scales easily from small businesses to large corporations.
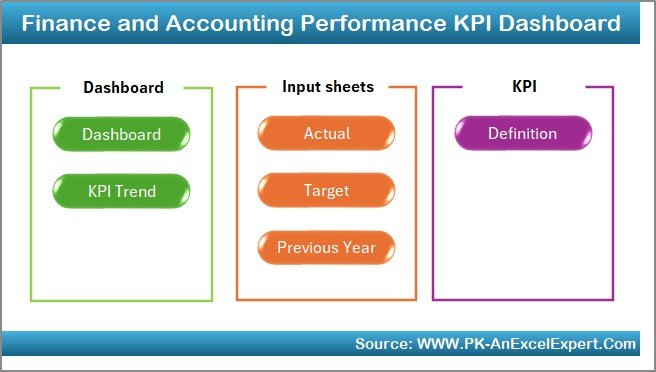
What’s Inside the Finance and Accounting Performance KPI Dashboard in Excel?
-
Revenue & Profit Margin Tracking: Monitor revenue streams and profit margins to ensure sustainable growth.
-
Cost & Expense Management: Track operational costs and measure cost efficiency.
-
Cash Flow Monitoring: Keep track of incoming and outgoing cash flow.
-
Budget vs. Actual Performance: Compare budgeted financials to actual performance for accuracy.
-
Time-Based Financial Tracking: Track financial performance over different periods.
-
Customizable KPIs: Adapt the dashboard to track the financial metrics most relevant to your organization.
How to Use the Finance and Accounting Performance KPI Dashboard in Excel
1️⃣ Download the Template: Instantly access the Finance and Accounting Performance KPI Dashboard.
2️⃣ Input Your Financial Data: Enter revenue, expenses, profits, and other relevant financial metrics into the dashboard.
3️⃣ Track & Analyze KPIs: Monitor key financial indicators such as revenue, profit margin, and cash flow in real-time.
4️⃣ Compare Budget vs. Actual Performance: Analyze discrepancies between budgeted figures and actual performance.
5️⃣ Make Data-Driven Adjustments: Use insights to optimize financial performance, reduce costs, and improve profitability.
Who Can Benefit from the Finance and Accounting Performance KPI Dashboard in Excel?
🔹 Financial Professionals & Accountants
🔹 Small & Medium Enterprises (SMBs)
🔹 Corporate Finance Teams
🔹 Business Owners & Executives
🔹 Financial Analysts & Consultants
🔹 CFOs & Finance Managers
🔹 Accounting Departments
Ensure that your financial performance is on track with the Finance and Accounting Performance KPI Dashboard in Excel. Track revenue, expenses, cash flow, and profitability in real time to make smarter financial decisions and optimize your business performance.
Click here to read the Detailed blog post
Visit our YouTube channel to learn step-by-step video tutorials
Youtube.com/@PKAnExcelExpert


Reviews
There are no reviews yet.