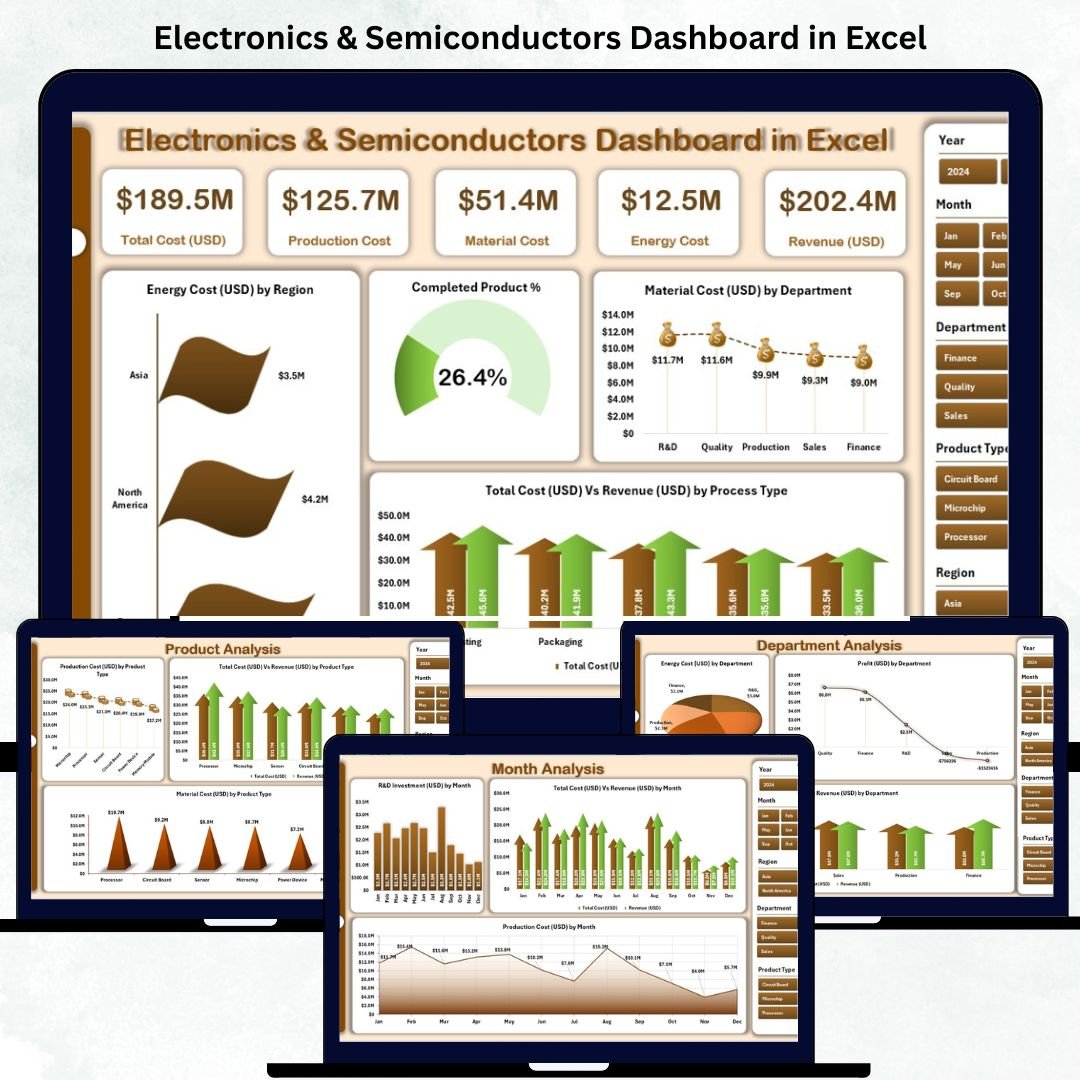
The Electronics & Semiconductors Dashboard in Excel is a ready-to-use business intelligence tool that empowers manufacturers, analysts, and managers to visualize performance, monitor costs, and drive efficiency — all within Microsoft Excel.
In an industry where precision, speed, and innovation define success, managing data effectively is non-negotiable. This interactive Excel dashboard transforms complex production and financial data into actionable insights, helping you optimize every step — from fabrication to final product delivery.
Whether you’re tracking production efficiency, analyzing material costs, or reviewing monthly performance, this dashboard delivers clear, automated, and real-time insights to support smarter decisions.
✨ Key Features of the Electronics & Semiconductors Dashboard in Excel
✅ 📊 Overview Page – Instant Business Snapshot

Get a high-level summary of company performance with five key KPI cards:
-
Completed Product %
-
Energy Cost (USD)
-
Material Cost (USD)
-
Total Cost (USD) vs Revenue (USD)
-
Profit (USD) by Process Type
📈 Quickly assess production efficiency, profitability, and cost structure in one place.
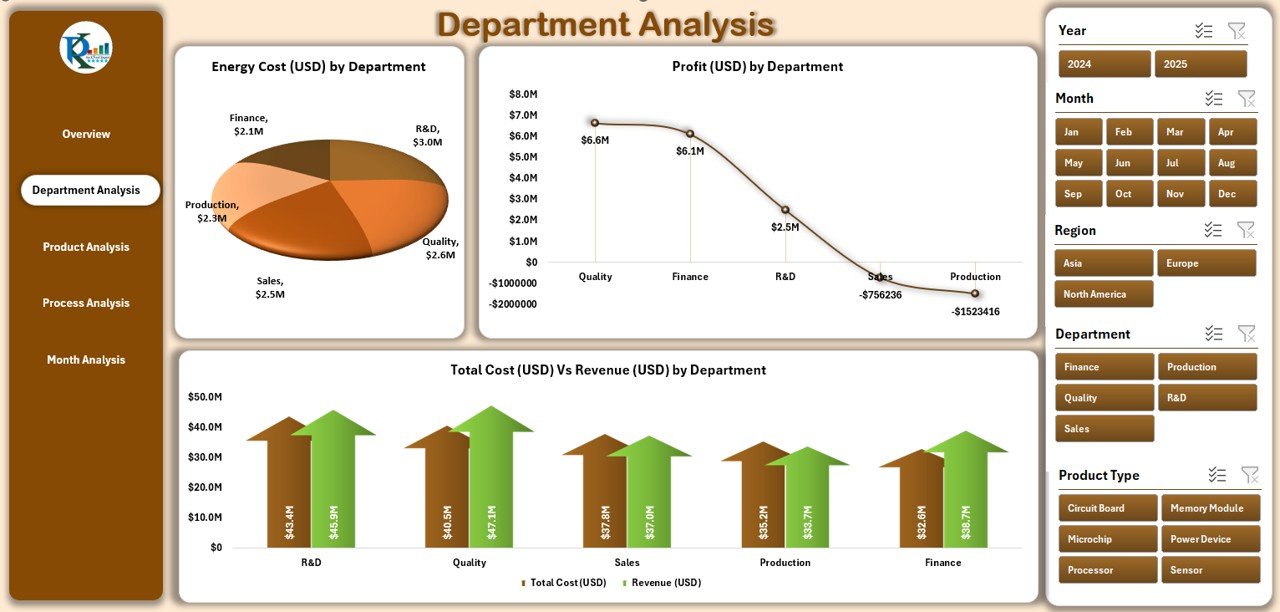
✅ 🏭 Department Analysis Page – Evaluate Team Performance
Understand how each department contributes to success.
-
Energy Cost (USD) by Department
-
Profit (USD) by Department
-
Total Cost vs Revenue (USD) by Department
⚙️ Spot high-performing teams and identify areas needing optimization.
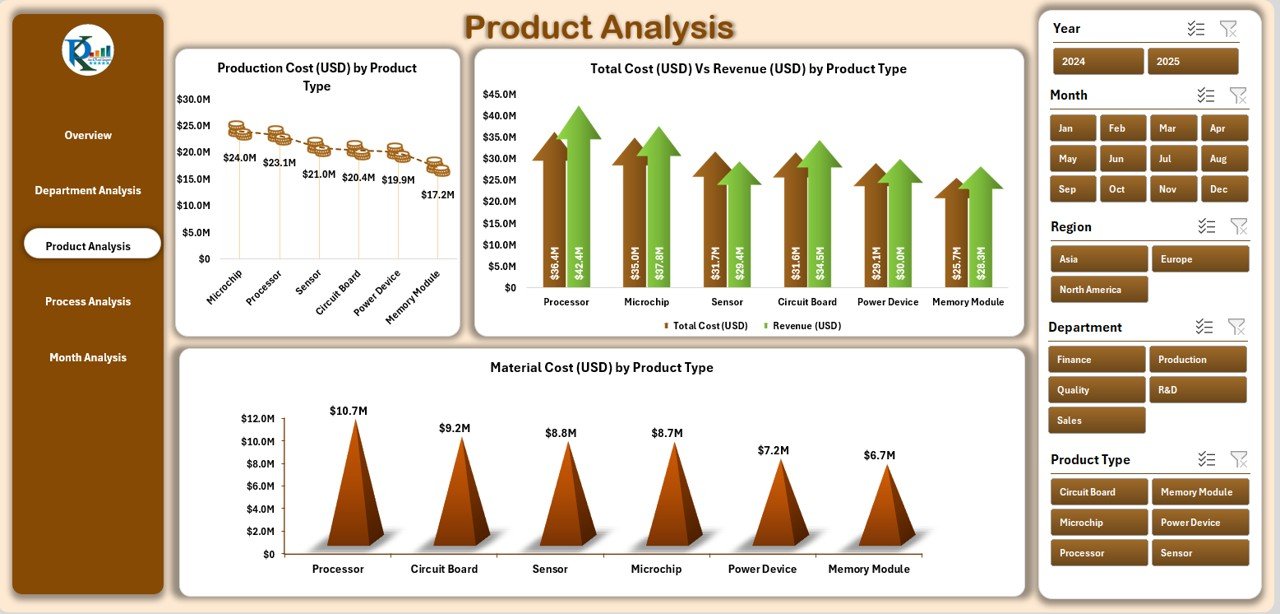
✅ 📦 Product Analysis Page – Measure Product Profitability
Evaluate cost and performance for every product line.
-
Total Cost vs Revenue by Product Type
-
Production Cost by Product Type
-
Material Cost by Product Type
💡 Perfect for decision-makers tracking product-wise profitability and waste reduction.
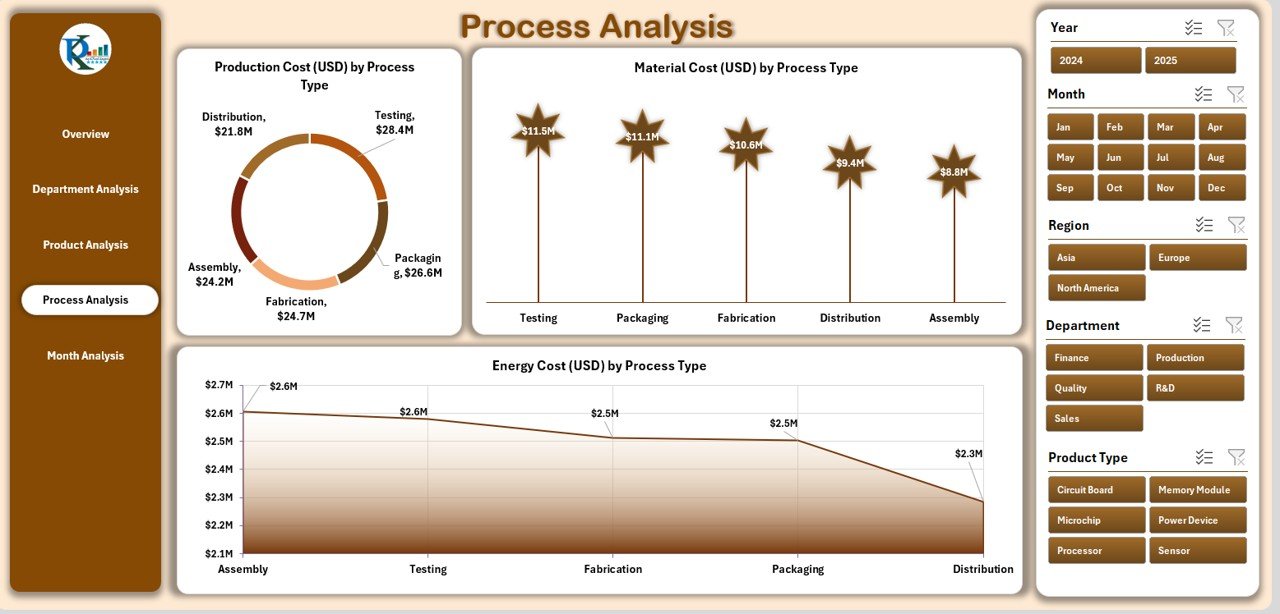
✅ ⚙️ Process Analysis Page – Optimize Production Workflow
Drill down into process-level data to improve manufacturing cycles.
-
Production Cost by Process Type
-
Material Cost by Process Type
-
Energy Cost by Process Type
🔍 Identify resource-heavy processes and balance output vs. cost efficiently.
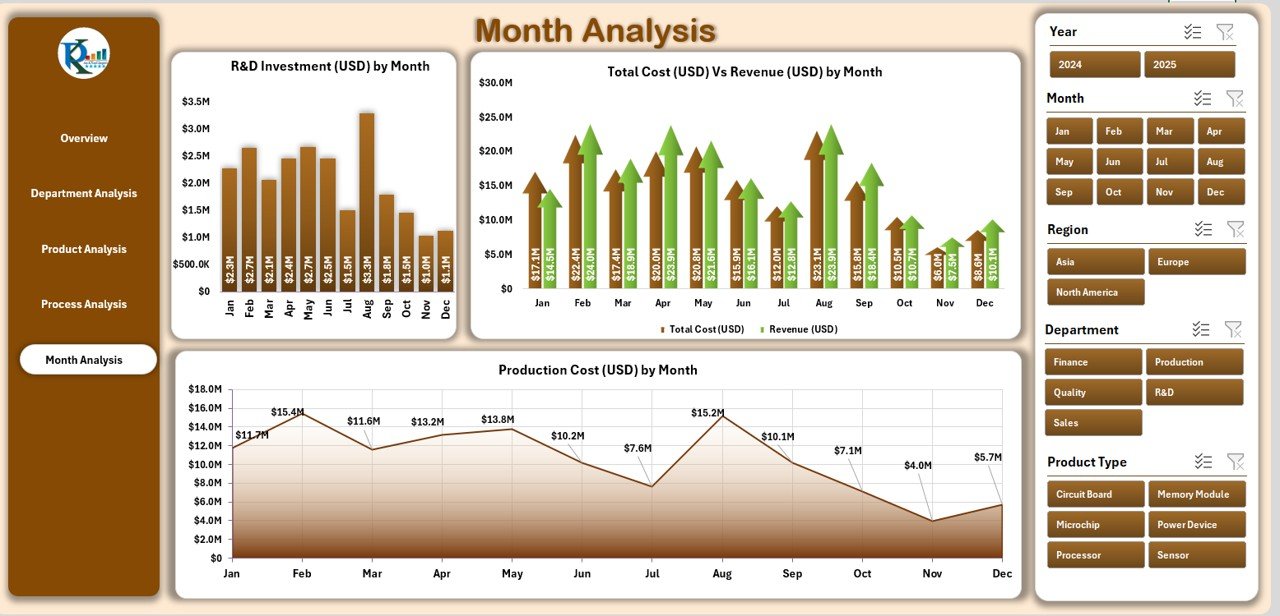
✅ 📅 Month Analysis Page – Analyze Seasonal Trends
Gain a time-based perspective on cost, revenue, and production.
-
Production Cost (USD) by Month
-
R&D Investment (USD) by Month
-
Production Output (USD) by Month
📆 Discover patterns, plan budgets, and forecast future performance confidently.
📦 What’s Inside the Dashboard
📁 Sheets Included:
-
Overview Page – Top-level KPIs and visuals
-
Department Analysis – Cost and revenue by department
-
Product Analysis – Product-level performance
-
Process Analysis – Manufacturing cost efficiency
-
Month Analysis – Monthly operational insights
-
Data Sheet – Central input area for all metrics
-
Support Sheet – Formula and pivot logic backend
💻 All visuals update automatically once you modify the Data Sheet — no coding required.
⚙️ How to Use the Electronics & Semiconductors Dashboard in Excel
1️⃣ Input Data: Enter monthly or weekly metrics such as cost, production, and revenue in the Data Sheet.
2️⃣ Automated Refresh: Pivot tables and charts update automatically.
3️⃣ Filter Views: Use slicers to explore data by region, department, or month.
4️⃣ Analyze KPIs: View trends, performance comparisons, and profitability ratios.
5️⃣ Export Reports: Generate management reports or presentations instantly.
🚀 Within minutes, you’ll turn static data into dynamic performance intelligence.
👥 Who Can Benefit from This Dashboard
🏭 Manufacturing Managers – Track production costs and efficiency.
💰 Finance Controllers – Compare revenue vs. cost across departments.
🧠 Data Analysts – Visualize key metrics without needing BI tools.
⚡ Process Engineers – Identify performance gaps in production lines.
💼 Executives – Gain a clear overview of company performance instantly.
💡 Advantages of the Electronics & Semiconductors Dashboard in Excel
✅ Centralized Data Management – Integrate all performance KPIs in one file.
✅ Real-Time Decision Support – Monitor cost, profit, and output simultaneously.
✅ Reduced Reporting Time – Save up to 70% of manual reporting effort.
✅ Error-Free Analysis – Automated formulas ensure data consistency.
✅ Scalable & Customizable – Add KPIs, formulas, or visuals easily.
✅ Affordable BI Alternative – Get powerful analytics without Power BI or ERP systems.
💻 This Excel-based tool delivers the power of data analytics at a fraction of the cost.
🎯 Best Practices for Effective Use
🔹 Keep your input data clean and validated.
🔹 Use consistent units and date formats.
🔹 Refresh charts monthly for the latest results.
🔹 Apply conditional formatting to highlight trends.
🔹 Back up your dashboard regularly.
With these steps, your team will maintain an accurate, insightful, and reliable performance tracking system.
🔗 Click here to read the Detailed Blog Post
🎥 Visit our YouTube channel to learn step-by-step video tutorials


Reviews
There are no reviews yet.