



In today’s unpredictable world, every second counts during a crisis. Whether it’s a natural disaster, a health emergency, or an industrial incident — your organization’s ability to respond efficiently determines the outcome. That’s why we created the Emergency Management KPI Dashboard in Excel — a smart, data-driven tool that helps you track preparedness, monitor performance, and make real-time decisions when emergencies strike.
This ready-to-use Excel dashboard simplifies complex data, allowing you to visualize, compare, and improve emergency performance metrics — all in one interactive platform. No coding or advanced Excel skills needed — just plug in your data and start managing emergencies effectively!
⚙️ Key Features of the Emergency Management KPI Dashboard in Excel
✅ Dynamic KPI Dashboard:
Monitor all your key metrics — Response Time, Resource Utilization, Communication Efficiency, and Incident Resolution Rate — in one interactive view.
✅ Month Selector:
Simply pick any month from the dropdown (Cell D3) to refresh all visuals instantly. Compare MTD, YTD, Target, and Previous Year data with automatic conditional formatting.
✅ Visual Indicators:
Up and down arrows clearly show performance trends, helping you identify issues before they escalate.
✅ Automated Calculations:
No manual formulas needed. Everything updates automatically when you enter data.
✅ User-Friendly Navigation:
A summary page with buttons lets you jump directly to dashboards, trends, or KPI definitions — making it simple for everyone.
✅ Fully Customizable:
You can easily modify KPIs, formulas, or visuals to suit your organization’s needs — whether you’re a hospital, government agency, or corporate emergency team.
✅ Low-Cost and Scalable:
Built entirely in Excel, this dashboard doesn’t require additional licenses or IT setup.
📊 What’s Inside the Emergency Management KPI Dashboard
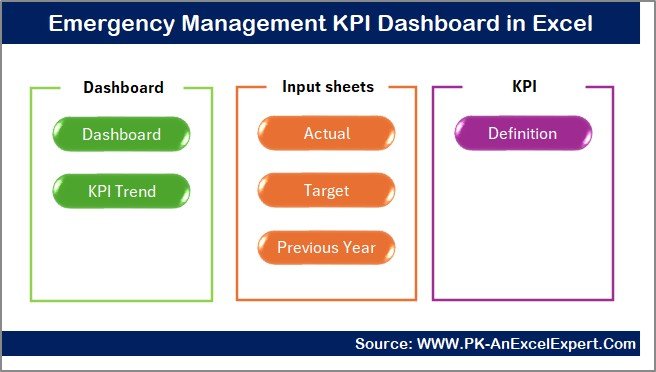
This template comes with 7 well-organized sheets, each serving a specific purpose:
1️⃣ Summary Page:
Your navigation hub with buttons to all pages — for effortless movement across the dashboard.
2️⃣ Dashboard Sheet:
The main analysis page displaying MTD and YTD data with interactive visuals and conditional formatting.
3️⃣ Trend Sheet:
Select any KPI and view its historical performance with MTD vs YTD trend charts.
4️⃣ Actual Numbers Input Sheet:
Enter real-time MTD and YTD performance data month by month.
5️⃣ Target Sheet:
Set clear monthly and annual targets to align team performance with goals.
6️⃣ Previous Year Sheet:
Input last year’s results to benchmark improvements and track performance evolution.
7️⃣ KPI Definition Sheet:
Your reference for KPI names, formulas, units, and definitions — ensuring clarity and consistency across your team.
🧩 How to Use the Emergency Management KPI Dashboard
🟢 Step 1: Open the Excel file and go to the Actual Numbers Input and Target Sheets.
🟢 Step 2: Enter your KPI data (MTD & YTD) and define monthly targets.
🟢 Step 3: Switch to the Dashboard tab and select your month (cell D3).
🟢 Step 4: Instantly see visuals update to show Actual vs Target vs Previous Year with performance arrows.
🟢 Step 5: Visit the Trend Sheet to analyze KPI patterns and make proactive decisions.
It’s that simple! Within minutes, you’ll have a full picture of your emergency readiness and performance efficiency.
👥 Who Can Benefit from This Dashboard
🏥 Hospitals & Healthcare Centers:
Track emergency response times, staff readiness, and resource usage.
🏢 Government Departments:
Evaluate coordination and disaster response efforts efficiently.
🏭 Industrial & Corporate Safety Teams:
Monitor incidents, safety drills, and compliance with real-time metrics.
🌍 NGOs & Disaster Relief Organizations:
Manage rescue operations, track resource distribution, and report outcomes effectively.
💡 Educational & Infrastructure Institutions:
Improve crisis response protocols, communication flow, and safety standards.






























Reviews
There are no reviews yet.