



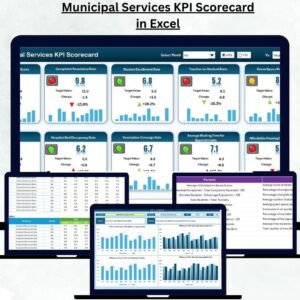
Running a city efficiently means keeping multiple departments in sync — from sanitation and water supply to safety, waste management, and finance. Tracking the performance of all these services can be overwhelming. That’s why we created the Municipal Services KPI Scorecard in Excel — a powerful, ready-to-use performance tracking solution that simplifies reporting and promotes transparency in local governance.
This Excel-based scorecard helps municipal authorities, planners, and administrators measure and visualize departmental performance across months and years. It consolidates all the key performance indicators (KPIs) into one easy-to-use interface, providing real-time insights into city operations, resource efficiency, and service delivery.
⚙️ Key Features of the Municipal Services KPI Scorecard in Excel
📊 Four Interactive Worksheets – Scorecard, KPI Trend, Input Data, and KPI Definition.
📅 Month & Year Selector – Instantly switch between MTD (Month-to-Date) and YTD (Year-to-Date) analysis.
🎯 Actual vs Target Comparison – Track whether performance goals are being met.
📈 Visual Indicators – Green and red arrows for quick status updates.
💡 Trend Charts – Identify seasonal or long-term changes in performance.
🧮 Auto Calculations – All metrics update automatically with new data entries.
📘 KPI Library – Standard definitions ensure consistency across departments.
💻 User-Friendly Interface – Designed for easy navigation and zero coding.
🏗️ Fully Customizable – Add, remove, or modify KPIs based on municipal needs.
📤 Data-Ready for Reporting – Perfect for presentations, internal reports, or citizen transparency dashboards.
🧭 What’s Inside the Municipal Services KPI Scorecard
📋 1️⃣ Scorecard Sheet – The Performance Dashboard

This is the main analysis hub of the workbook.
✅ Select your month and toggle between MTD or YTD mode.
✅ Compare Actual vs Target performance across multiple KPIs.
✅ Instantly identify which areas are performing well using green (▲) and red (▼) arrows.
Sample KPIs:
Waste Collection Efficiency (%)
Water Quality Compliance (%)
Streetlight Uptime (%)
Emergency Response Time (Minutes)
Road Maintenance Completion (%)
Revenue Collection Rate (%)
Citizen Satisfaction Score
📈 2️⃣ KPI Trend Sheet – Analyze Performance Over Time
Visualize how your services are improving or declining.
🎯 Select a KPI from the dropdown (cell C3).
📊 View KPI details such as Group, Unit, Formula, and Type (UTB/LTB).
📉 See both MTD and YTD charts for Actual, Target, and Previous Year data.
This feature helps municipal leaders spot consistent bottlenecks and seasonal performance variations.
💾 3️⃣ Input Data Sheet – Centralized Data Management
The data entry center of the scorecard.
✅ Enter KPI names, month, actual values, and targets.
✅ Update monthly for automatic recalculation.
✅ All updates reflect instantly across all sheets.
This makes performance tracking effortless and error-free.
📘 4️⃣ KPI Definition Sheet – Clarity and Consistency
A reference library for all KPIs.
Includes:
KPI Name
KPI Group
Unit
Formula
Definition
This ensures every department understands how KPIs are defined and calculated — improving consistency and accuracy in reporting.
🌟 Advantages of Using the Municipal Services KPI Scorecard
✅ Centralized Performance Tracking – Consolidate all service metrics in one place.
✅ Time Efficiency – Eliminate manual report preparation.
✅ Transparency & Accountability – Share reliable performance data with stakeholders.
✅ Data-Driven Governance – Make informed decisions backed by real-time insights.
✅ Easy Customization – Add KPIs or new service categories as your city evolves.
✅ Public Confidence – Showcase results to citizens through structured reports.
✅ Error Reduction – Automated formulas reduce calculation mistakes.
🧱 Example KPIs for Municipal Services
🚛 Waste Management: Waste Collection Efficiency (%), Recycling Rate (%).
💧 Water Supply: Water Quality Compliance (%), Supply Interruptions (Hours/Month).
🚦 Infrastructure: Road Repair Completion Rate (%), Streetlight Uptime (%).
🚒 Public Safety: Emergency Response Time (Minutes), Health Inspection Compliance (%).
🏛️ Finance & Revenue: Revenue Collection Rate (%), Budget Utilization Efficiency (%).
🧠 Best Practices for Accurate Analysis
📌 Maintain consistent KPI names and formats across all sheets.
📌 Review both MTD and YTD results for balanced insights.
📌 Use simple, uniform color coding for clarity.
📌 Verify data before monthly updates.
📌 Protect formula cells to prevent accidental edits.
📌 Archive historical files annually for long-term analysis.
👥 Who Can Benefit
🏛️ City Managers & Administrators – Monitor performance across departments.
📈 Municipal Planners – Evaluate trends and plan future initiatives.
💡 Department Heads – Track and improve service-level performance.
🌱 Sustainability Officers – Measure environmental impact and resource efficiency.
👥 Public Policy Analysts – Use factual data for transparent reporting.
🔗 Click here to read the Detailed Blog Post
📺 Visit our YouTube Channel for step-by-step video tutorials.
Watch the step-by-step video tutorial:
Compatibility and Requirements
- Works in Microsoft Excel desktop (Excel 2016 or later, or Microsoft 365).
- You pick the KPI on the KPI Trend sheet from a dropdown in cell C3. Microsoft explains dropdowns in Create a drop-down list.
Frequently Asked Questions
Which sheets are included?
Four sheets: Scorecard, KPI Trend, Input Data and KPI Definition.
How do I update the scorecard?
Enter the KPI name, month, actual value and target on the Input Data sheet. The other sheets recalculate from that data.
Can I switch between month-to-date and year-to-date results?
Yes. Select the month on the Scorecard sheet and toggle between MTD and YTD mode. Actual and target values are compared, with green and red arrows showing the status.
Can I add or change KPIs?
Yes. The template is fully customizable, so you can add, remove or modify KPIs to match your city’s services. The KPI Definition sheet holds the group, unit, formula and definition for each one.
Is there a dashboard, Power BI or Google Sheets version?
Yes. See the Municipal Services KPI Dashboard in Excel, the Municipal Services KPI Dashboard in Power BI and the Municipal Services KPI Dashboard in Google Sheets.
Related KPI Templates
- Municipal Services KPI Dashboard in Excel: the dashboard edition for the same services
- Municipal Services KPI Dashboard in Power BI: the Power BI version
- Municipal Services KPI Dashboard in Google Sheets: the Google Sheets version
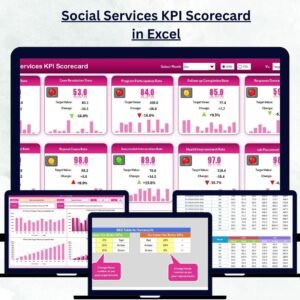
- Social Services KPI Scorecard in Excel: a scorecard for public social programs
- Shared Services KPI Scorecard in Excel: a scorecard for shared service teams
Browse all Excel KPI dashboards and scorecards.

















Reviews
There are no reviews yet.