

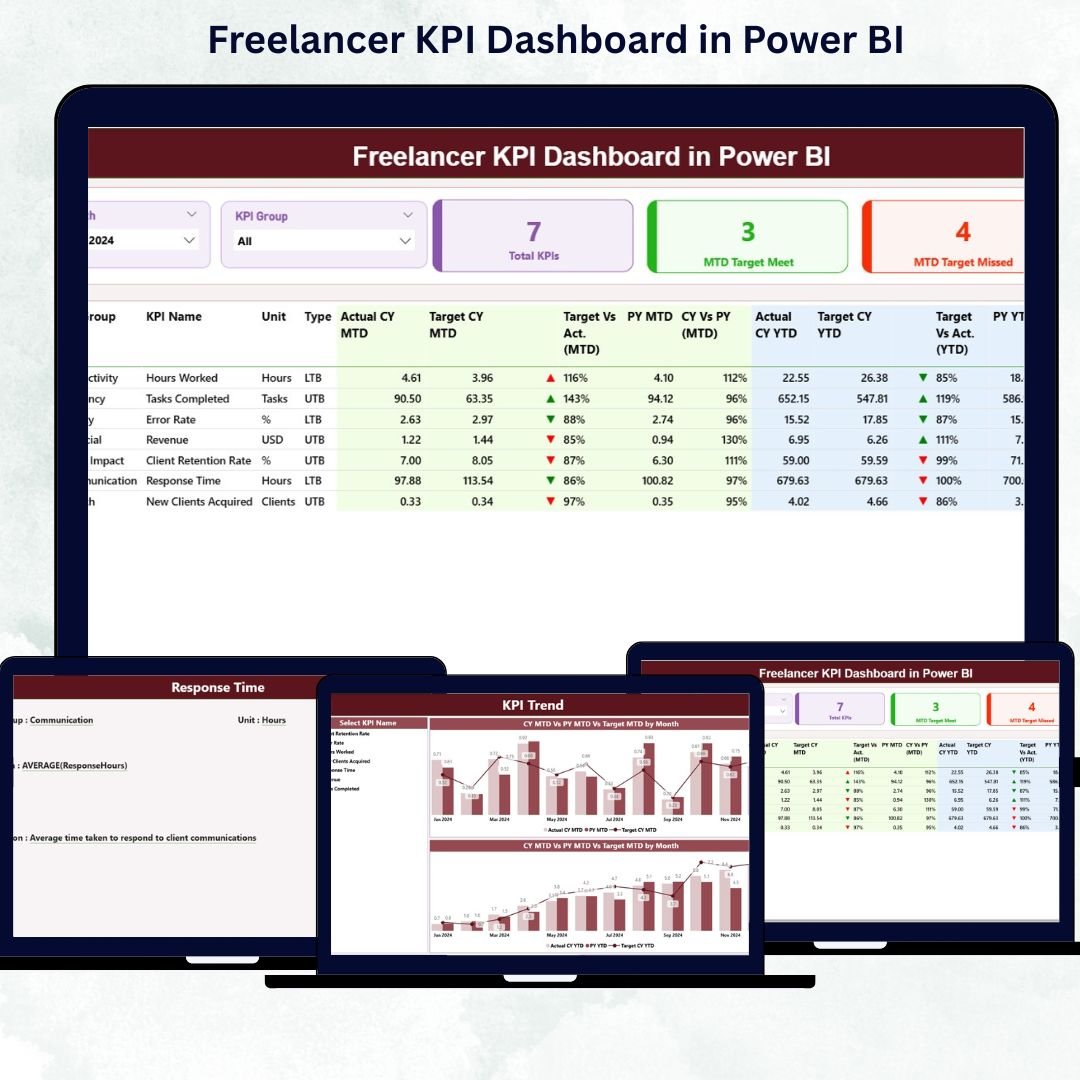

Managing multiple projects, clients, and deadlines as a freelancer can be overwhelming — especially when you rely only on spreadsheets. That’s why the Freelancer KPI Dashboard in Power BI is designed to simplify performance tracking and provide data-driven clarity for freelancers of all industries.
This ready-to-use dashboard helps you visualize your key metrics, monitor progress, and make smarter decisions — all within the powerful analytics environment of Microsoft Power BI. Whether you’re tracking income, billable hours, client satisfaction, or project efficiency, this tool gives you a complete business snapshot at a glance.
⚙️ Key Features of the Freelancer KPI Dashboard in Power BI
✅ 📊 Three Insightful Pages – Summary Page, KPI Trend Page, and KPI Definition Page — each offering a unique view of your freelance business performance.
🧭 1. Summary Page – Your Central Command Hub
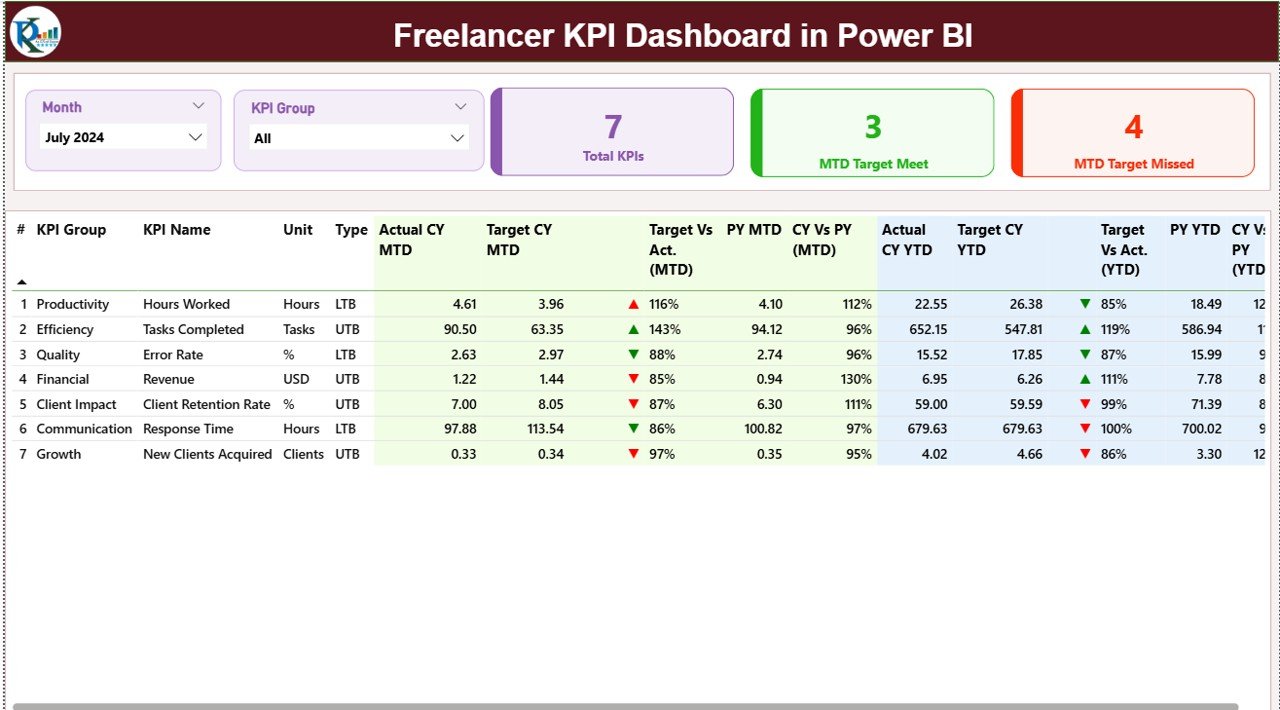
This page gives you an instant overview of all your KPIs.
📅 Month & KPI Group Slicers: Filter data by month or performance category.
📈 KPI Cards: Total KPIs, MTD Target Met, and MTD Target Missed indicators.
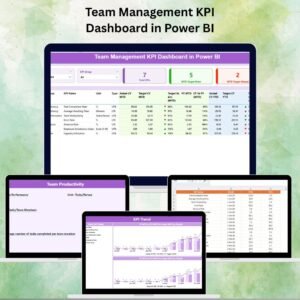
📊 Detailed Table: Displays actual vs. target performance, YTD analysis, and comparisons with previous year data.
🔼 Conditional Icons: Green arrows (▲) show KPIs on track, red arrows (▼) highlight areas needing attention.
👉 Instantly know which KPIs are improving, which need focus, and how your freelance performance evolves over time.
📈 2. KPI Trend Page – Visualize Performance Over Time
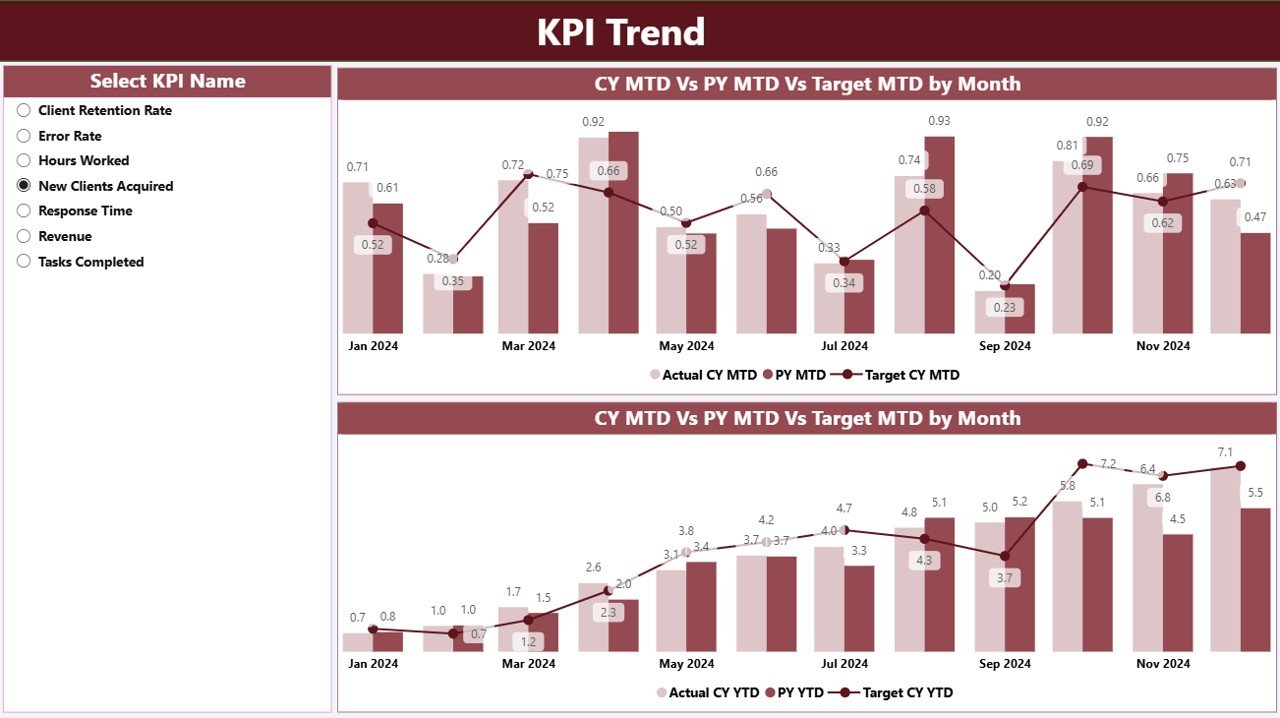
Gain a deeper understanding of trends and patterns with engaging visuals.
💡 Combo Charts: Compare Current Year Actuals, Targets, and Previous Year data for MTD and YTD.
🧩 KPI Selector: Choose any KPI to explore its month-by-month evolution.
🔍 Performance Insights: Identify peaks, dips, and areas to optimize — such as income consistency, client retention, or workload distribution.
Example: If your “Billable Hours Utilization” drops mid-year, you’ll spot it instantly and adjust accordingly.
📚 3. KPI Definition Page – Understand Your Metrics Clearly
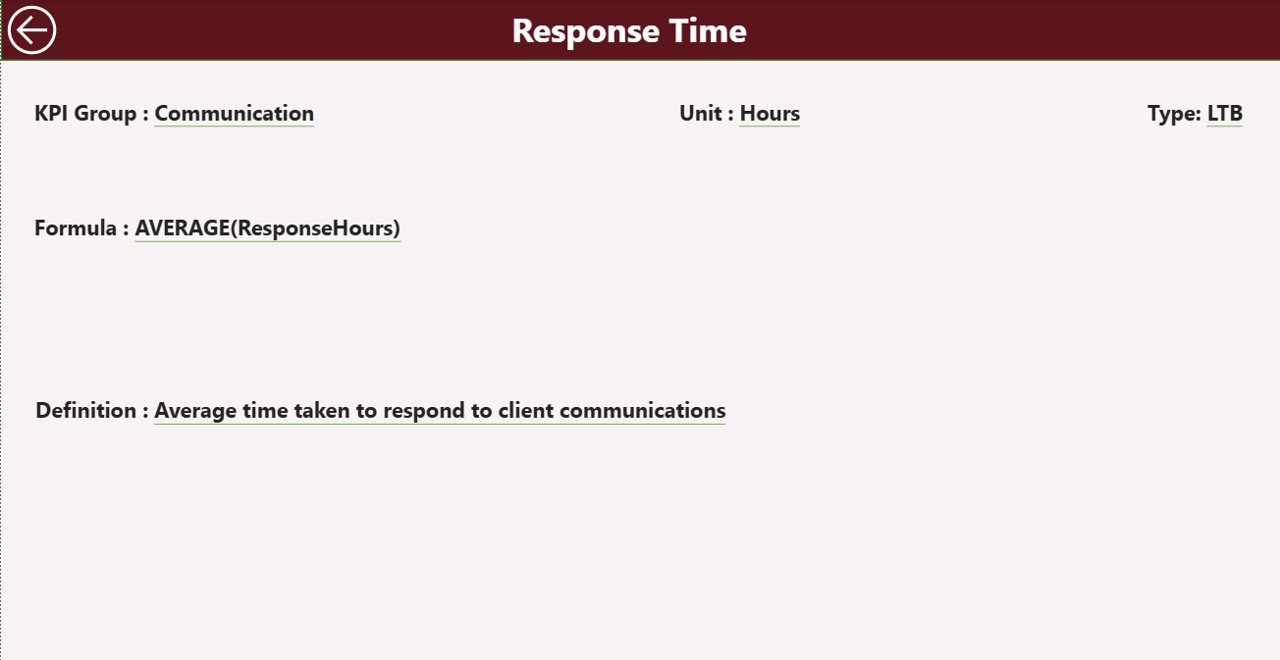
Transparency is key! This hidden drill-through page defines each KPI’s formula, meaning, and type.
📑 Fields Covered: KPI Number, KPI Name, Group, Unit, Formula, Definition, and Type (LTB/UTB).
🔁 Navigation: Easily return to the Summary Page via the back button.
This ensures every KPI is consistent, well-defined, and easy to interpret across projects.
🧩 What’s Inside the Freelancer KPI Dashboard in Power BI
📘 Excel Data Source:
The dashboard pulls information from three Excel sheets:
Input_Actual – Captures your real performance data.
Input_Target – Stores target metrics for each KPI.
KPI Definition – Provides reference data for formulas and definitions.
🧮 Dynamic Calculations: Automatically computes MTD/YTD performance, target variance, and year-over-year improvement.
🎨 Interactive Visuals: Modern design with slicers, charts, and conditional icons for easy storytelling.
💾 Editable Structure: You can add, remove, or edit KPIs to suit your freelance domain.
🚀 How to Use the Freelancer KPI Dashboard in Power BI
1️⃣ Update Excel Sheets: Add actual and target data each month.
2️⃣ Refresh Power BI: Click “Refresh” to load updated visuals instantly.
3️⃣ Filter Views: Use slicers to analyze by month, KPI group, or metric.
4️⃣ Interpret Icons: Green = met/exceeded targets; Red = below target.
5️⃣ Drill Through: Review KPI definitions for deeper clarity.
6️⃣ Share Reports: Export charts or PDFs for client presentations.
👨💼 Who Can Benefit from This Dashboard
🎯 Freelancers & Consultants – Monitor income, performance, and productivity.
💻 Designers & Developers – Track project turnaround time and client satisfaction.
📝 Writers & Marketers – Measure output, deadlines, and campaign efficiency.
📊 Financial & Business Analysts – Manage profitability and trend reporting.
This tool empowers every freelancer to operate like a professional agency — with clear metrics and measurable success.
🌟 Why Freelancers Love This Dashboard
✅ Real-Time Performance Tracking – No more guessing your business health.
✅ Financial Transparency – View monthly and yearly income targets easily.
✅ Data-Driven Decisions – Identify what’s working and where to improve.
✅ Professional Reporting – Impress clients with visual performance summaries.
✅ Customizable Design – Edit KPIs and visuals for your unique workflow.
🔗 Click here to read the Detailed blog post
📺 Visit our YouTube channel for step-by-step tutorials
👉 YouTube.com/@PKAnExcelExpert
Watch the step-by-step video tutorial:
Compatibility and Requirements
- Works in Power BI Desktop, which is free to download. Microsoft explains how to get it in Get Power BI Desktop.
- The data comes from three Excel sheets (Input_Actual, Input_Target and KPI Definition), so you also need Excel to edit them.
More Questions About This Template
Which pages does the dashboard have?
Three pages: Summary, KPI Trend and KPI Definition. The KPI Definition page is a hidden drill-through page.
Where do I enter my numbers?
Add your actual figures to the Input_Actual sheet and your goals to the Input_Target sheet in Excel. Then click Refresh in Power BI to load them.
Can I add or change KPIs?
Yes. You can add, remove or edit KPIs to fit your freelance work. The KPI Definition sheet holds each KPI’s name, group, unit, formula, definition and type (LTB or UTB).
How do I see the trend for one KPI?
Open the KPI Trend page and pick a KPI with the selector. The combo charts show current year actuals, targets and previous year for both MTD and YTD.
Is there an Excel or Google Sheets version?
Yes. See the Freelancer KPI Dashboard in Excel and the Freelancer KPI Dashboard in Google Sheets.
Related Freelancer Templates
- Freelancer KPI Dashboard in Excel: the same KPIs in Excel
- Freelancer KPI Dashboard in Google Sheets: the Google Sheets edition
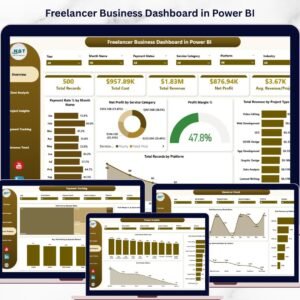
- Freelancer Business Dashboard in Power BI: a business view for freelancers in Power BI
- Freelancer Project Calendar in Excel: plan your projects by date
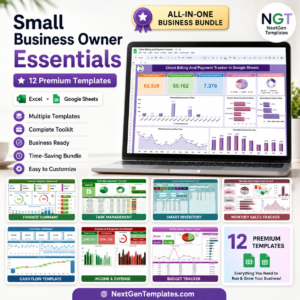
- Small Business Owner Essentials: 12 templates in one download
Browse all Power BI KPI dashboards.















Reviews
There are no reviews yet.