

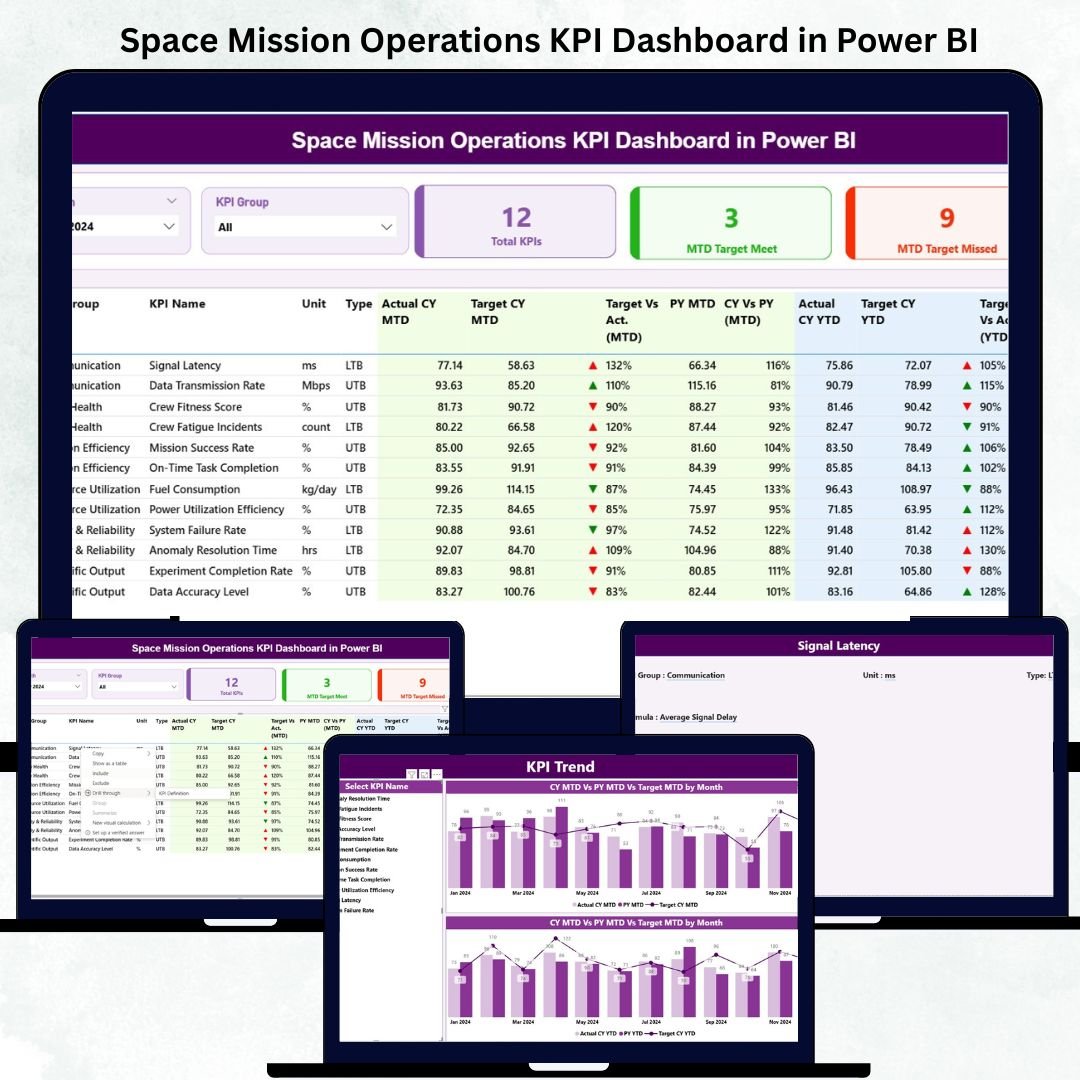
The Space Mission Operations KPI Dashboard in Power BI is a groundbreaking analytical tool built for space agencies, aerospace research centers, and private satellite operators. It brings all essential mission performance metrics into one interactive and visually engaging platform — giving you total control over every stage of your mission lifecycle.Space Mission Operations KPI Dashboard in Power BI
📊 Mission Summary in One View: Instantly assess total KPIs tracked, targets met, and performance gaps.
🎯 Automated Insights: Real-time calculations for MTD and YTD data comparisons.
🛰️ Visual Storytelling: Dynamic charts and KPI cards that make complex mission data intuitive.
🔄 Excel Integration: Seamless link between Power BI and Excel for live data refresh.
📅 Trend Analysis: Visualize performance over multiple months with Actual vs Target charts.
🧭 Drill-Through Navigation: Jump directly from a summary KPI to its detailed definition.
⚙️ Customizable KPIs: Easily modify or add new indicators in the Excel data source.
🔐 Data Security & Collaboration: Share dashboards with defined user roles in Power BI Service.
💡 Instant Alerts: Conditional icons highlight deviations to help you act quickly.
With this dashboard, mission controllers, analysts, and project managers can transform raw telemetry data into actionable insights — improving decision-making, reducing risks, and enhancing mission success rates.
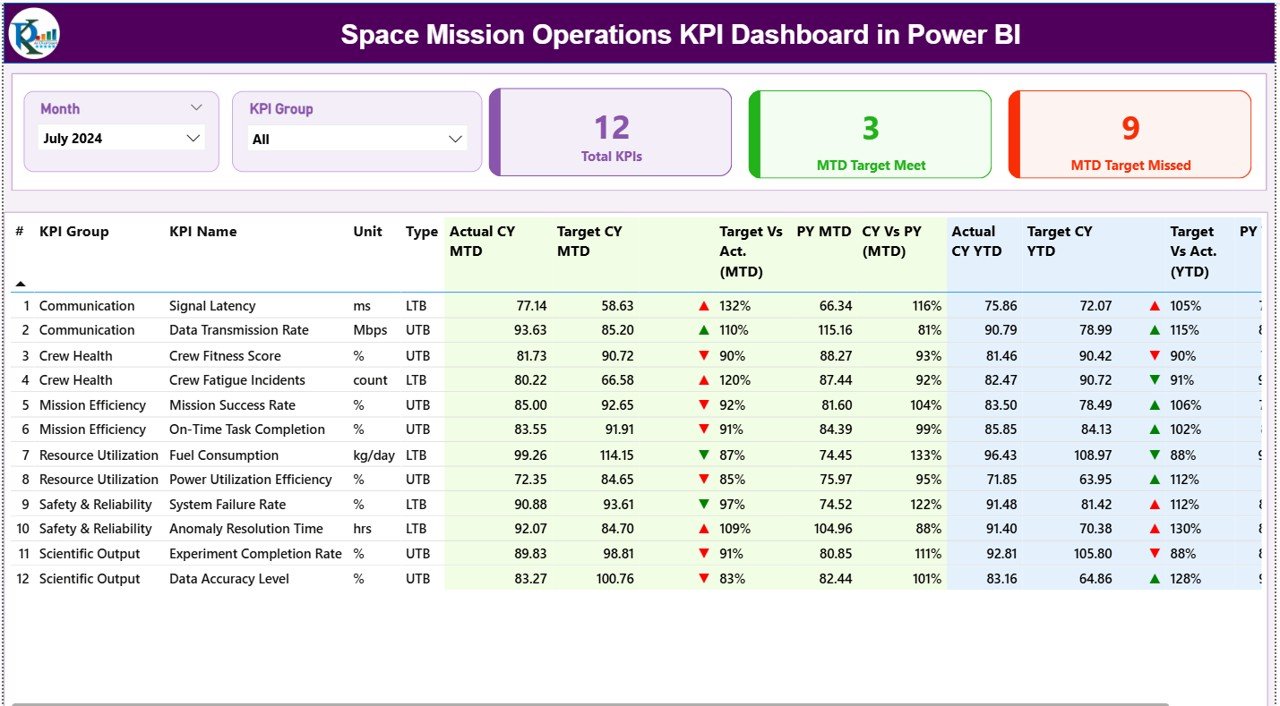
📦 What’s Inside the Space Mission Operations KPI Dashboard in Power BI
The dashboard is structured into three powerful pages that simplify analysis:
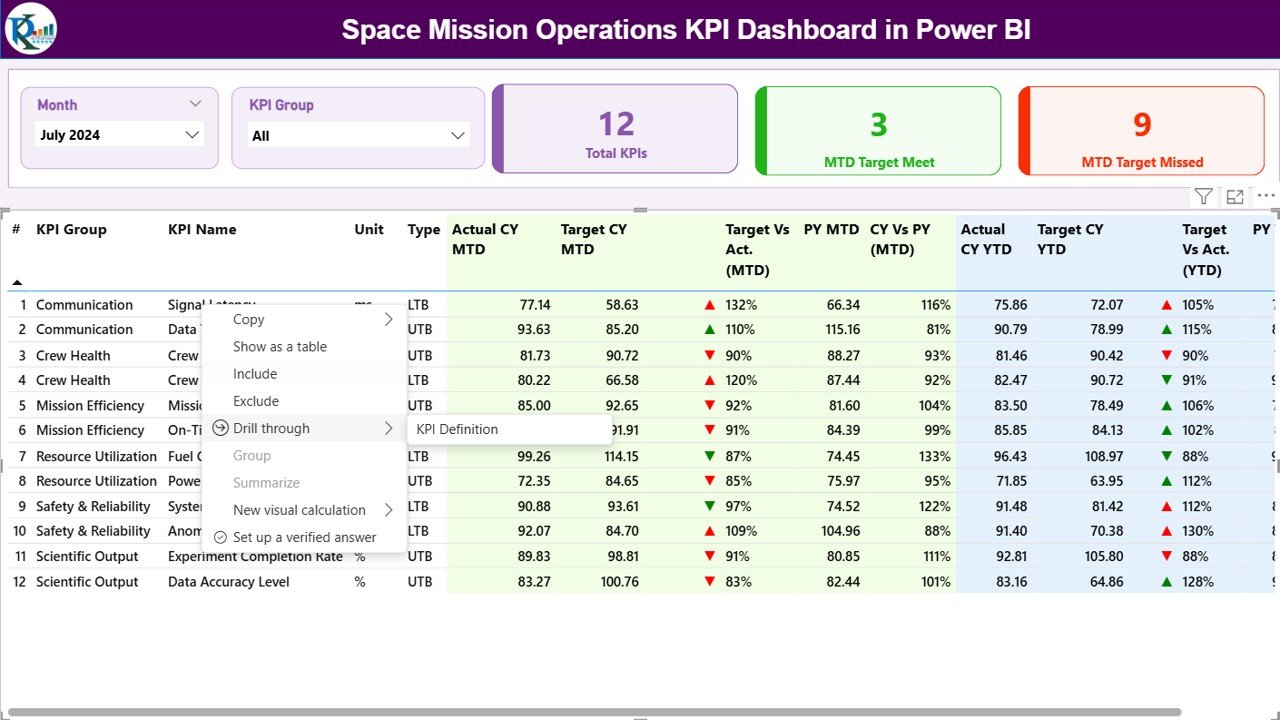
1️⃣ Summary Page – The central command center of mission performance.
Displays mission health indicators and progress cards.
Includes slicers for Month and KPI Group.
Highlights MTD Target Met and Target Missed counts with intuitive visuals.
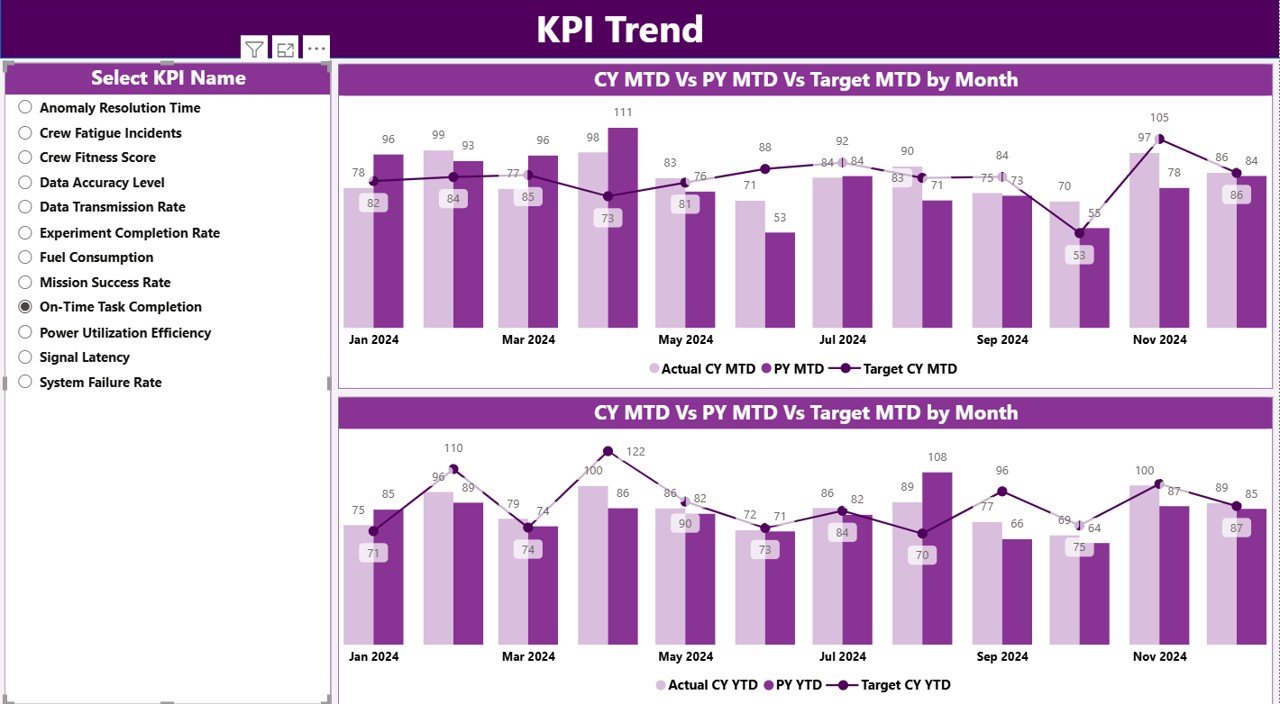
2️⃣ KPI Trend Page – Visualize changes over time.
Two interactive combo charts show Actual vs Target for MTD and YTD.
A KPI Name slicer lets you focus on specific performance parameters like signal quality, propulsion efficiency, or satellite uptime.
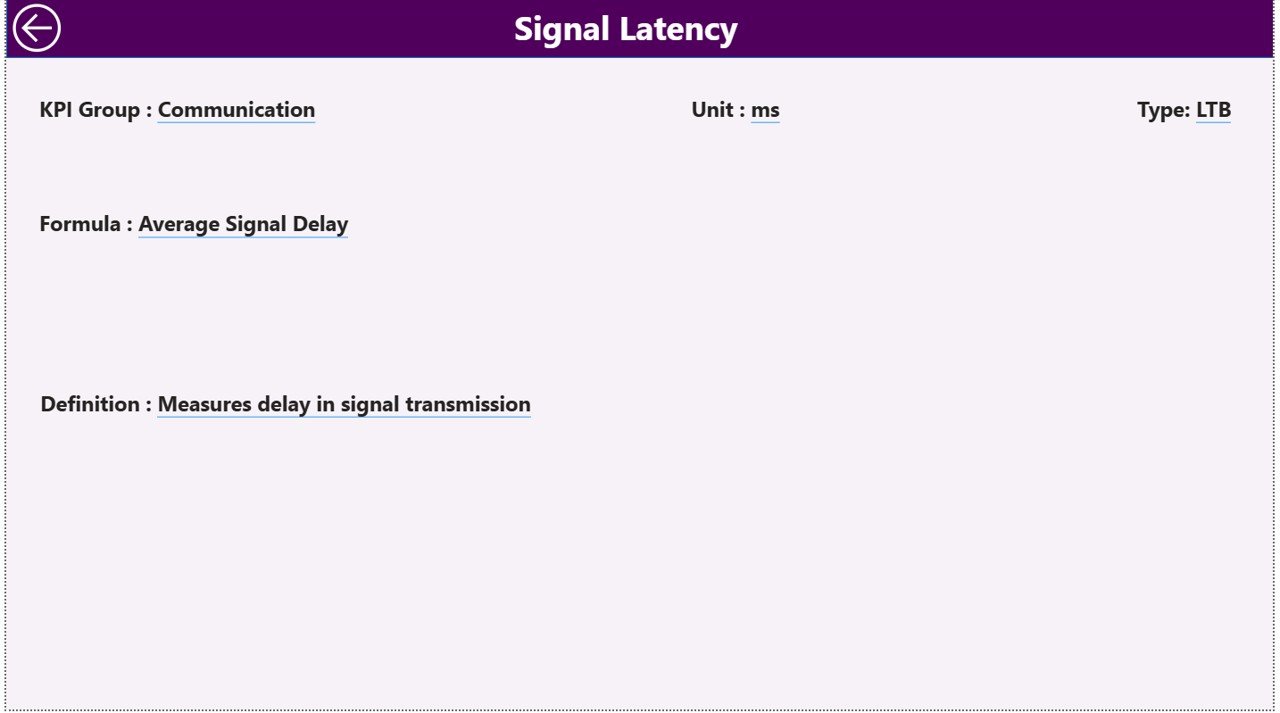
3️⃣ KPI Definition Page – A transparent reference for every indicator.
Displays KPI Number, Formula, Definition, and Type (UTB or LTB).
Allows easy drill-through from the Summary Page and a Back button for smooth navigation.
All three pages are powered by an Excel data model that includes:
Input_ActualSheet (real mission data)Input_TargetSheet (planned targets)KPI_DefinitionSheet (definitions and formulas)
⚙️ How to Use the Space Mission Operations KPI Dashboard
1️⃣ Connect Your Data:
Replace the sample Excel file with your mission dataset while keeping the same structure.
2️⃣ Refresh Power BI:
Click “Refresh” to instantly update all charts, cards, and metrics.
3️⃣ Use Filters Smartly:
Filter by month, KPI group, or individual KPIs to focus on critical mission aspects.
4️⃣ Monitor Real-Time Results:
Review MTD vs Target and YTD vs PY (Previous Year) comparisons.
5️⃣ Drill-Down to Insights:
Click on any KPI to open its definition and formula for deeper understanding.
6️⃣ Collaborate & Share:
Publish the report to Power BI Service, assign user access, and share insights securely with your team.
This dashboard is designed for non-technical and technical users alike, making advanced mission analytics effortless.
👥 Who Can Benefit from This Dashboard
🛰️ Space Agencies: To track mission success rates, satellite performance, and fuel efficiency.
🏢 Private Aerospace Companies: To evaluate launch operations, cost metrics, and client performance KPIs.
🔬 Research Institutions: To monitor ongoing experiments, telemetry, and data transmissions.
🛠️ Engineers & Analysts: To detect anomalies and improve operational precision.
📡 Mission Control Teams: To visualize communication, trajectory accuracy, and resource usage in real time.
📈 Executives & Project Managers: To review performance trends, budgets, and mission milestones at a glance.
With every detail centralized, teams can save time, reduce complexity, and enhance mission performance.
📖 Click Here to Read the Detailed Blog Post
Watch the step-by-step video tutorial:
(Visit our website to explore the complete breakdown, screenshots, and use cases.)
🔗 Visit Our YouTube Channel
👉 PKAnExcelExpert – Watch step-by-step tutorials and demos of this dashboard.





















Reviews
There are no reviews yet.