



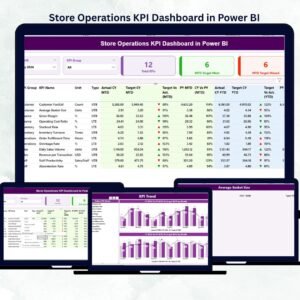
The Store Operations KPI Dashboard in Power BI is a next-generation analytics solution that helps retail professionals monitor performance, drive profitability, and enhance customer experience — all in one place. Whether you manage one store or a nationwide chain, this dashboard transforms raw data into actionable insights.Store Operations KPI Dashboard in Power BI
✨ Key highlights include:
📊 Interactive visuals: Gain real-time insights into sales, operations, and workforce metrics.
🕒 MTD & YTD tracking: Compare current performance with targets and past results.
🔍 Drill-through analysis: Instantly access KPI formulas, definitions, and performance trends.
🧠 Excel-powered data: Connects easily with an Excel source file for quick data refresh.
⚙️ Customizable layout: Tailor KPIs, visuals, and slicers to your store’s reporting needs.
🔁 Dynamic filtering: Slice and dice by Month or KPI Group using intuitive filters.
📈 Visual storytelling: Understand performance at a glance with charts, cards, and icons.
🔒 Data transparency: Ensure accuracy and consistency through direct Excel integration.

📦 What’s Inside the Store Operations KPI Dashboard in Power BI
This ready-to-use dashboard template includes three professional Power BI pages designed for simplicity, clarity, and impact.
1️⃣ Summary Page:
The main page offering a high-level snapshot of performance.
Month and KPI Group slicers for easy filtering.Store Operations KPI Dashboard in Power BI
KPI cards showing Total KPIs, MTD Target Met, and MTD Target Missed.
A detailed performance table for deeper operational insights.
2️⃣ KPI Trend Page:
Understand trends and patterns across months and years.
Two combo charts compare Actual, Target, and Previous Year results.
One KPI Name slicer to analyze performance by category or department.
Ideal for identifying strengths, weaknesses, and improvement opportunities.
3️⃣ KPI Definition Page:
Drill down to understand each metric in detail.
View KPI Formula, Definition, and Type (UTB/LTB).
Includes a back button for smooth navigation to the Summary Page.
📘 Excel Data Source Integration:
The dashboard connects seamlessly to Excel with three key sheets:
Input_Actual– Captures KPI name, month, and performance data.Input_Target– Stores monthly targets for each KPI.KPI_Definition– Contains KPI Group, Unit, Formula, and Type.
Simply update your Excel file and refresh Power BI to see real-time analytics instantly.
🧩 How to Use the Store Operations KPI Dashboard in Power BI
💡 Follow these simple steps to get started:
1️⃣ Update Excel Sheets: Enter monthly Actuals and Targets for all KPIs.
2️⃣ Open Power BI File: Connect the Excel file to your dashboard.
3️⃣ Refresh Data: Click Refresh to update visuals automatically.
4️⃣ Use Slicers: Filter by Month or KPI Group to focus on specific insights.
5️⃣ Drill Through: Select any KPI to explore its formula and definition.
6️⃣ Share Insights: Export reports or share the Power BI dashboard with your team.
🌟 Pro Tips:
Refresh data monthly for accurate results.
Maintain clean and consistent Excel entries.
Use a balanced mix of “Upper the Better” and “Lower the Better” KPIs.
Review visuals regularly to ensure they align with business goals.
👥 Who Can Benefit from This Store Operations KPI Dashboard
This dashboard is ideal for professionals who manage, analyze, or optimize retail performance:
🏪 Store Managers: Track operational performance daily.
🏢 Regional Managers: Compare multiple store KPIs side-by-side.
📊 Operations Executives: Analyze patterns and drive process improvement.
💰 Finance Teams: Align operational efficiency with cost optimization.
👩💼 HR & Training Teams: Monitor employee productivity and staffing levels.
Whether you run a single store or hundreds, this tool ensures you have complete visibility into what’s working and what needs attention — instantly and visually.
Click here to read the Detailed Blog Post
Watch the step-by-step video tutorial:
Visit our YouTube channel to learn step-by-step video tutorials
Compatibility and Requirements
- Works in Power BI Desktop, which is free to download. Microsoft explains the install in Get Power BI Desktop.
- The data comes from an Excel source file with three sheets: Input_Actual, Input_Target and KPI_Definition.
Frequently Asked Questions
How many pages does the dashboard have?
Three pages: Summary, KPI Trend and KPI Definition.
Where does the data come from?
From an Excel file. Enter monthly actuals in Input_Actual and targets in Input_Target, then refresh Power BI. KPI_Definition holds the KPI group, unit, formula and type.
Can I compare results with last year?
Yes. The two combo charts on the KPI Trend page compare Actual, Target and Previous Year results, and you pick the KPI with the KPI Name slicer.
Can I see how each KPI is calculated?
Yes. The KPI Definition page shows the formula, the definition and the type (UTB or LTB) for each KPI. A back button returns you to the Summary page.
Is there an Excel version?
Yes. See the Store Operations KPI Dashboard in Excel.
Related Store and Operations Templates
- Store Operations KPI Dashboard in Excel: the same store KPIs in Excel
- Operations KPI Dashboard in Power BI: a general operations view in Power BI
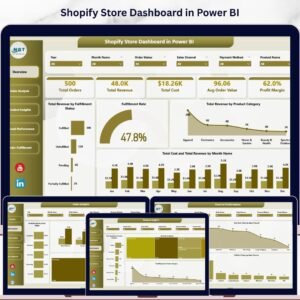
- Shopify Store Dashboard in Power BI: a Power BI dashboard for online stores
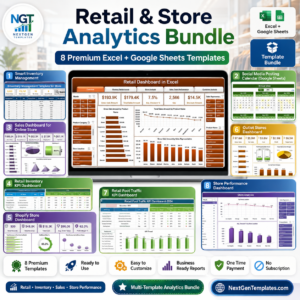
- Retail & Store Analytics Bundle: 8 retail templates in one download
Browse all Power BI KPI dashboards.











Reviews
There are no reviews yet.