
Running a senior living facility involves balancing compassionate care with operational excellence. The Senior Living KPI Dashboard in Google Sheets is a ready-to-use, data-driven tool that empowers administrators and managers to monitor performance metrics across resident care, staffing, occupancy, and finances—all from a single, easy-to-navigate dashboard.
Built entirely in Google Sheets, this dashboard offers automated calculations, dynamic visuals, and month-to-date (MTD) and year-to-date (YTD) insights, helping decision-makers take timely and informed actions. It’s the perfect blend of simplicity, functionality, and precision for senior living operations.
🔑 Key Features of the Senior Living KPI Dashboard in Google Sheets
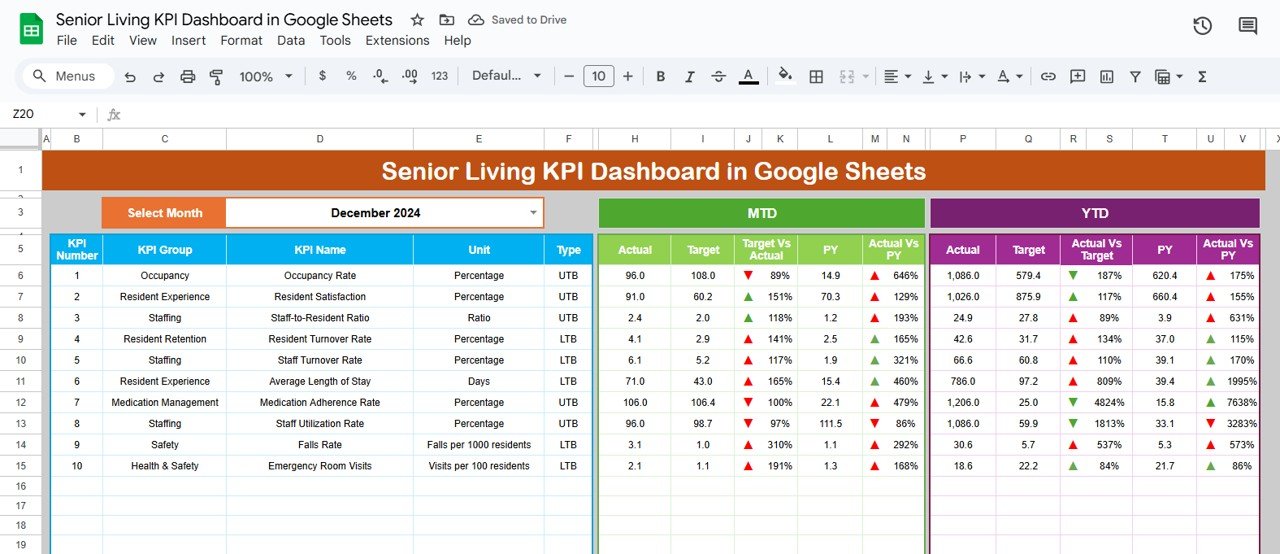
📊 Dashboard Sheet Tab
The main dashboard brings all your performance data together in one clean, visual layout.
-
Month Selector (Cell D3): Choose any month to refresh all visuals and metrics dynamically.
-
MTD & YTD Analysis: Automatically compare actuals vs. targets and previous year data.
-
Conditional Formatting: Visual arrows (green ▲ for improvement, red ▼ for decline) highlight progress or setbacks instantly.
-
Comparisons: Target vs. Actual and Current Year vs. Previous Year metrics for quick performance evaluation.
This sheet provides a complete snapshot of your facility’s health—both operational and financial.
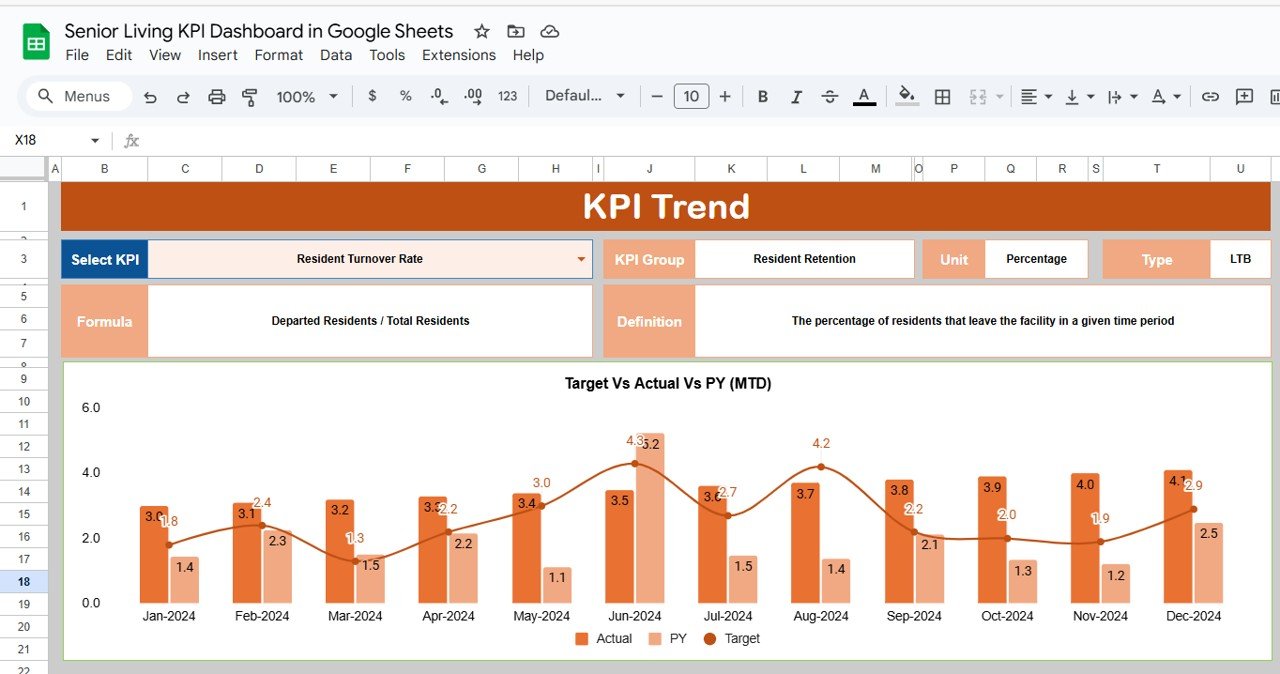
📈 KPI Trend Sheet Tab
Track trends over time and analyze how your facility performs month by month.
-
Dropdown Selection (Cell C3): Choose any KPI to view its trend.
-
Displays KPI Group, Unit, and Type (UTB/LTB).
-
Charts: Dynamic visualizations showing monthly progress.
This feature helps you identify long-term patterns in occupancy, satisfaction, and performance.
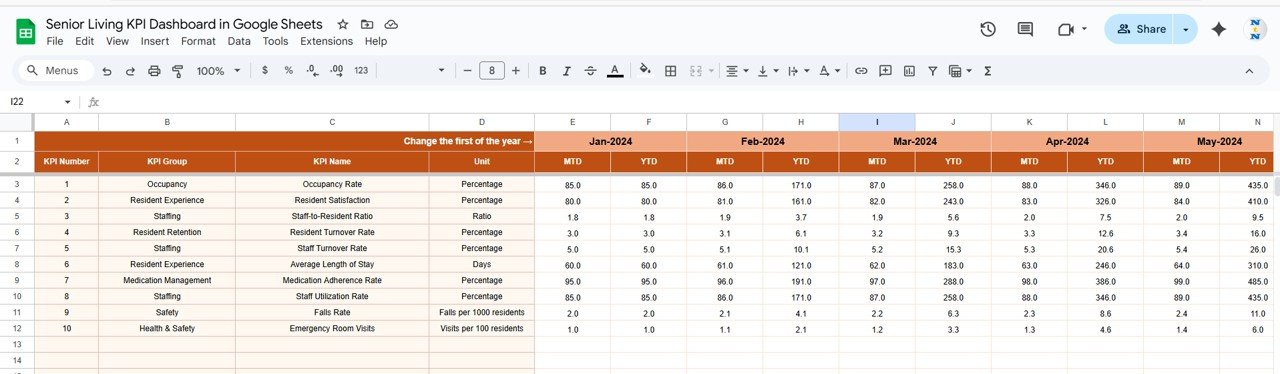
📋 Actual Numbers Sheet Tab
-
Enter MTD and YTD values for all KPIs.
-
Update the first month of the year in cell E1 to automatically adjust calculations.
-
Seamlessly integrates with dashboard visuals for real-time updates.
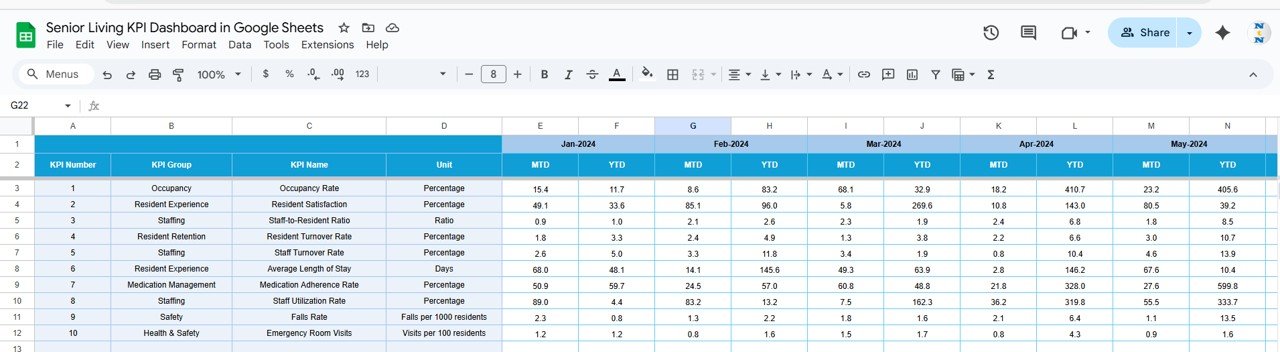
🎯 Target Sheet Tab
-
Input MTD and YTD targets for all KPIs.
-
Compare planned vs. actual data to measure achievement levels.
-
Useful for setting goals aligned with operational priorities.
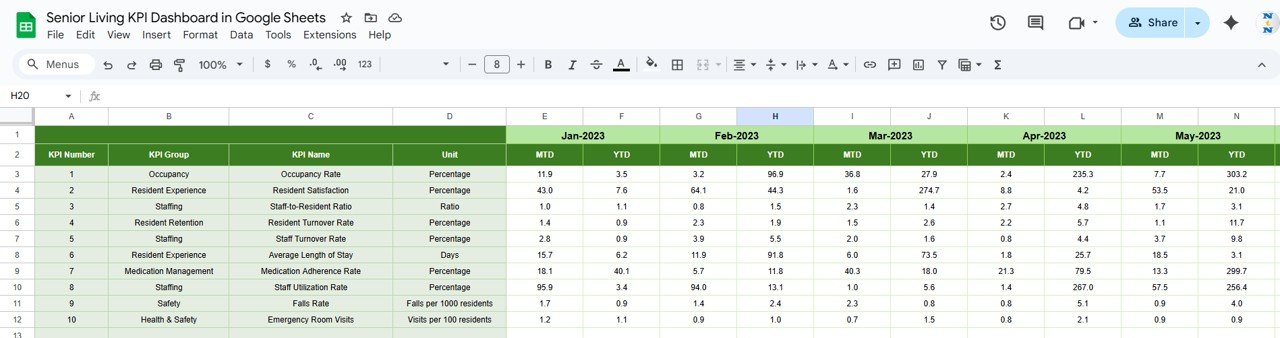
📆 Previous Year Numbers Sheet Tab
-
Maintain last year’s data to monitor year-over-year growth.
-
Provides a foundation for strategic analysis and trend comparison.
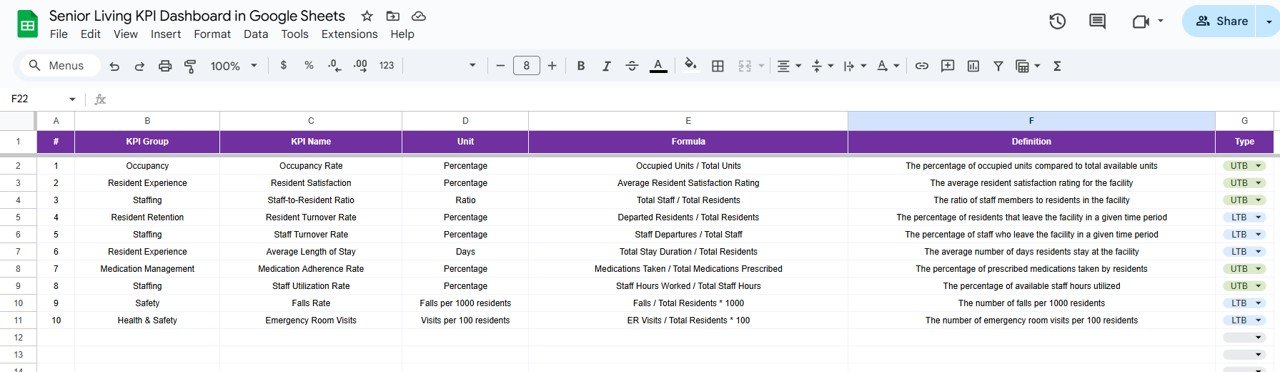
📘 KPI Definition Sheet Tab
-
Define KPIs with key details like Name, Group, Unit, Formula, Definition, and Type (UTB/LTB).
-
Ensures every department interprets performance metrics consistently.
📦 What’s Inside the Template
✅ Dashboard Tab: Visual overview with MTD/YTD summaries and performance indicators
✅ KPI Trend Tab: Line charts and progress views across months
✅ Actual Numbers Sheet: Centralized data entry for KPIs
✅ Target Sheet: Goal-setting and benchmarking
✅ Previous Year Sheet: Historical comparison tracking
✅ KPI Definition Sheet: Detailed KPI references for transparency
This dashboard is your go-to performance management tool for senior living operations — blending healthcare quality monitoring with financial oversight.
👩💼 Who Can Use This Dashboard
🏥 Facility Administrators: Track overall performance and compliance standards.
👩⚕️ Nursing Directors: Monitor care quality metrics and incident rates.
📊 Finance Teams: Manage budgets, costs, and profitability KPIs.
👨💼 Operations Managers: Oversee occupancy, staffing, and service efficiency.
👵 Multi-Facility Operators: Compare performance across multiple locations.
🧠 How to Use the Senior Living KPI Dashboard
-
Input Data: Enter actual monthly KPI values in the Actual Numbers Sheet.
-
Set Targets: Record expected MTD and YTD figures in the Target Sheet.
-
Compare Performance: Review the Dashboard tab for color-coded visual insights.
-
Analyze Trends: Use the KPI Trend sheet to evaluate performance month-over-month.
-
Review Results: Share findings with leadership and staff for better decision-making.
The dashboard updates automatically — no manual calculations or additional setup required.
🌟 Advantages of Using the Dashboard
-
🏢 Centralized Data View: Manage all care, staffing, and financial KPIs in one sheet.
-
⏱ Real-Time Insights: Instantly see performance against targets.
-
📊 Visual Clarity: Intuitive charts and conditional formatting make data easy to interpret.
-
💬 Collaborative Access: Google Sheets allows multiple users to update simultaneously.
-
⚙️ Customizable Metrics: Add new KPIs that fit your unique operational structure.
-
💡 Strategic Decision Support: Identify strengths and areas needing improvement quickly.
This tool helps senior living facilities achieve excellence in care delivery, occupancy management, and cost control—all through one simple interface.
🧩 Best Practices
✅ Update data monthly for accurate MTD/YTD tracking.
✅ Define clear, realistic KPI targets for each department.
✅ Use the KPI Trend Sheet for quarterly or annual reviews.
✅ Involve department heads in maintaining their KPIs.
✅ Leverage color-coded visuals to prioritize improvement areas.
🏆 How It Helps Senior Living Management
-
Improves Care Quality: Monitor resident satisfaction and service metrics.
-
Optimizes Resource Allocation: Balance occupancy and staffing levels.
-
Enhances Financial Oversight: Compare budgets and expenditures efficiently.
-
Boosts Accountability: Assign clear KPI ownership across departments.
-
Promotes Continuous Improvement: Identify trends early and take corrective actions.


Reviews
There are no reviews yet.