

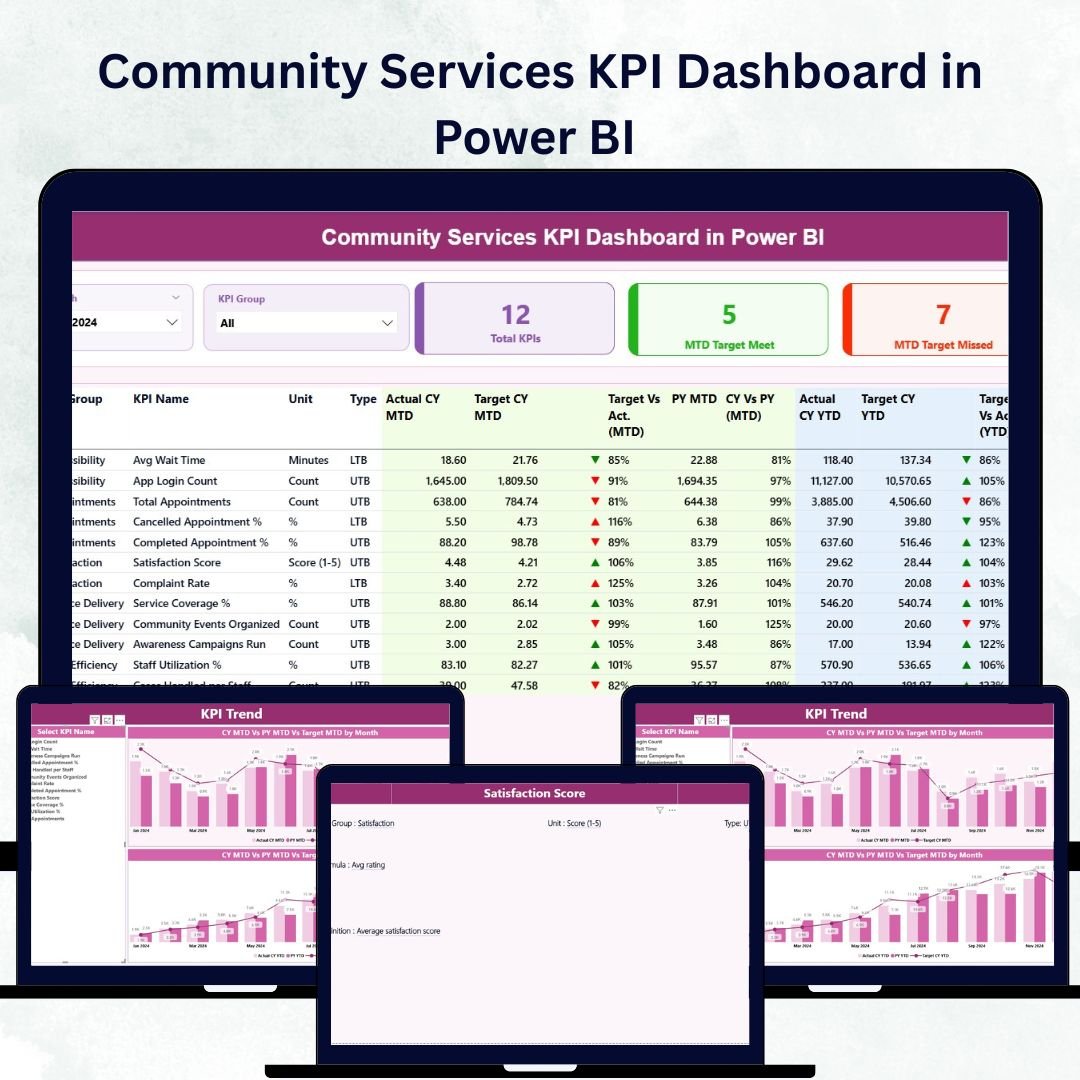

Delivering real impact starts with data-driven insights. The Community Services KPI Dashboard in Power BI empowers social organizations, NGOs, and public agencies to track outcomes, funding, and service performance through a single interactive dashboard 📊🤝.
This ready-to-use Power BI template consolidates your Excel data into clear visual reports—helping you monitor KPIs, analyze trends, and communicate success to funders and stakeholders. Whether you manage community outreach, education programs, or welfare services, this dashboard brings visibility, accountability, and efficiency to your mission.
⚙️ Key Features of the Community Services KPI Dashboard in Power BI
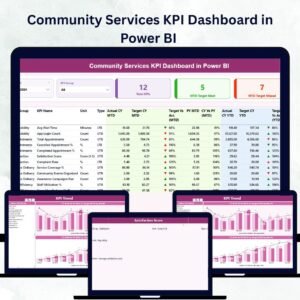
📊 3 Interactive Pages – Summary, KPI Trend, and KPI Definition.
🎯 MTD & YTD Tracking – Evaluate Month-to-Date and Year-to-Date progress at a glance.
🧭 Dynamic Slicers – Filter instantly by month or KPI group.
💡 Automated Data Refresh – Updates automatically from your Excel source file.
🟢 Visual Indicators (▲ ▼) – Highlight KPIs meeting or missing targets.
📈 Dual Charts – Compare Actual vs Target vs Previous Year in real time.
📘 Drill-Through Definition Page – Right-click any KPI for formula, unit, and type.
🧾 Excel-Linked Structure – Connects seamlessly to Input Actual, Target, and Definition sheets.
🔒 Customizable & Scalable – Add new KPIs or service categories easily.
🌍 Shareable Insights – Publish to Power BI Service or export for presentations.
📦 What’s Inside the Dashboard
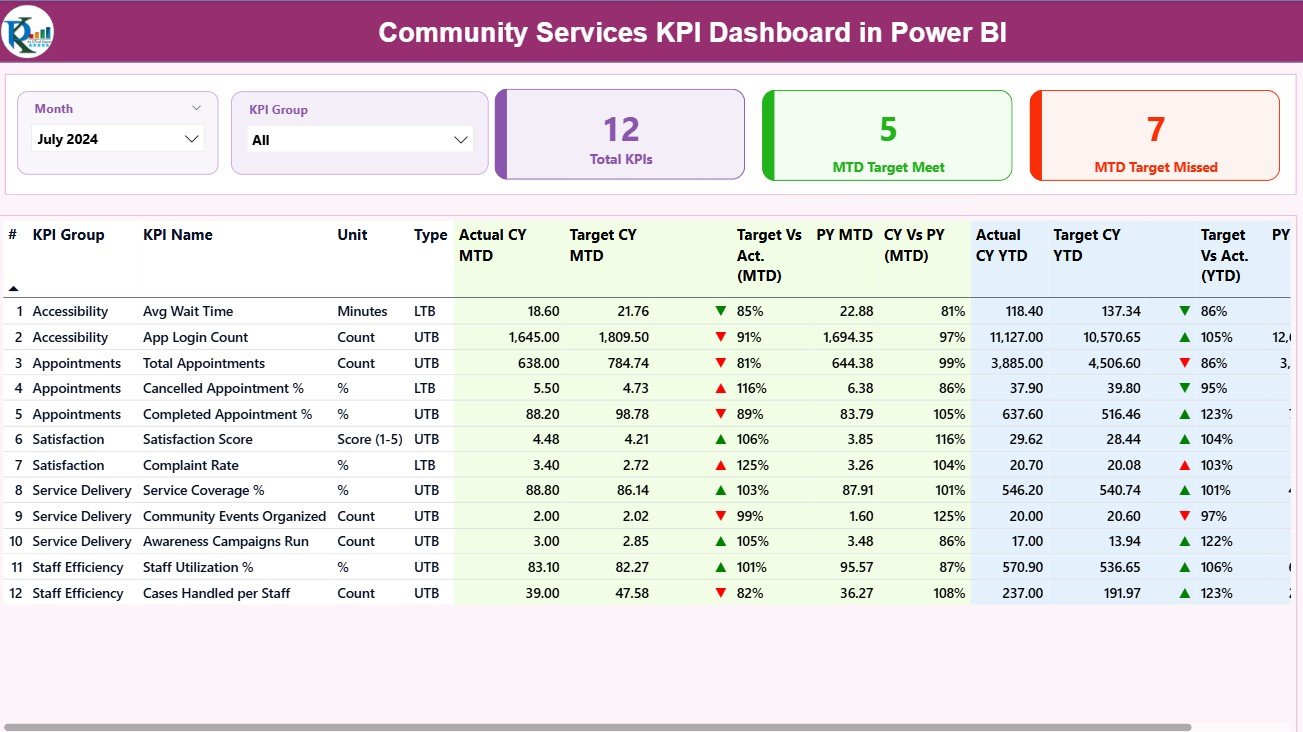
1️⃣ Summary Page – Executive Overview
Your one-page performance snapshot.
Month & KPI Group slicers for dynamic filtering.
Three cards show: Total KPIs Count, MTD Target Met, and MTD Target Missed.
Detailed KPI table listing Actual, Target, and Previous Year values for both MTD and YTD.
✅ Quickly see which programs are on track — and which need attention.
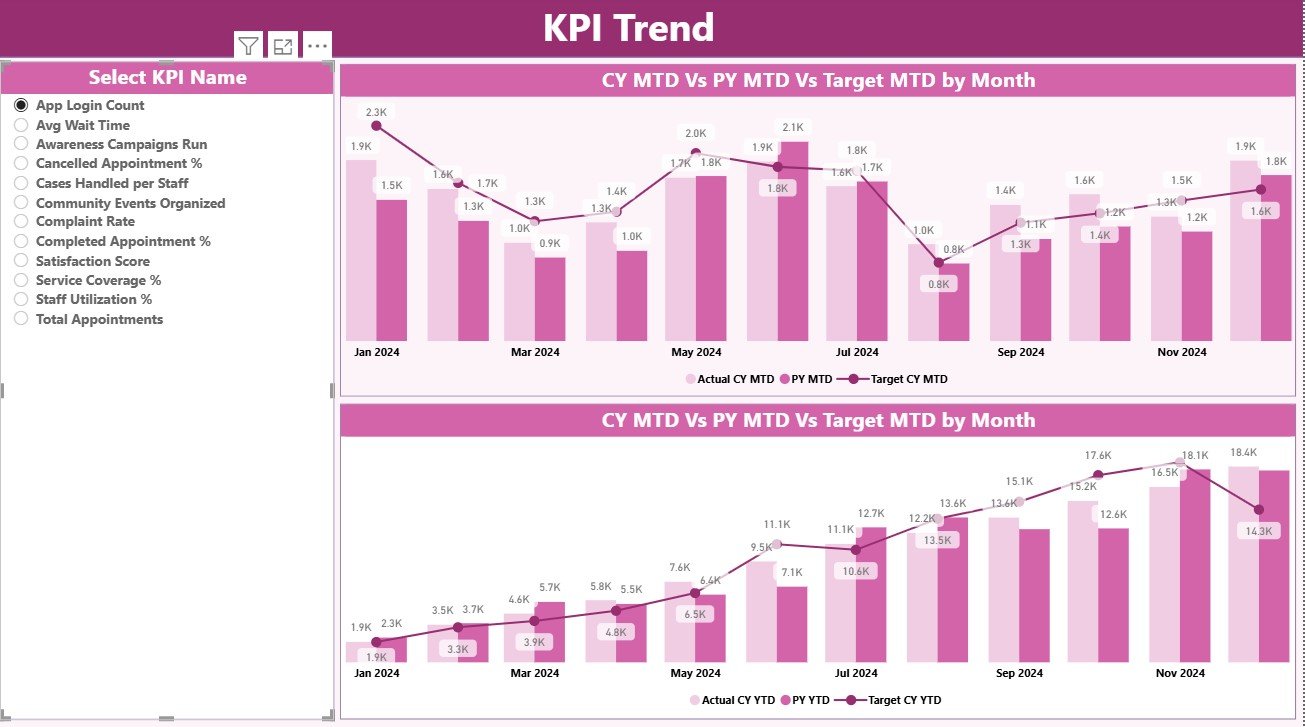
2️⃣ KPI Trend Page – Visual Progress Analysis
Understand performance over time with interactive combo charts.
Left-panel slicer lets you pick any KPI.
Dual charts show MTD and YTD trends (ACTUAL vs TARGET vs PREVIOUS YEAR).
Identify growth, seasonality, or decline at a glance.
Perfect for monthly reviews and strategic planning sessions.
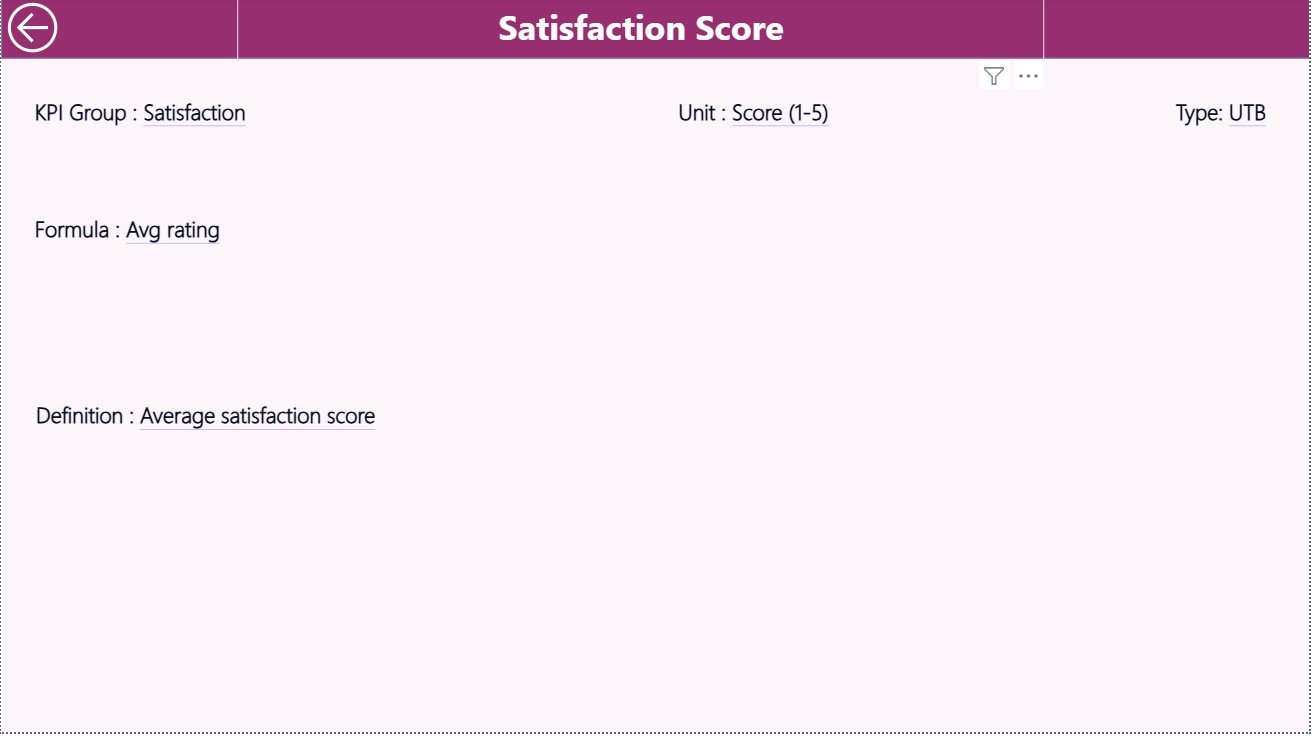
3️⃣ KPI Definition Page – Transparency & Context
Your built-in reference guide for every metric.
Displays KPI Group, Unit, Formula, Definition, and Type (UTB/LTB).
Accessible via right-click → Drill Through to Definition.
Includes a “Back” button for easy navigation to Summary.
Ensures everyone interprets KPIs the same way — promoting clarity and consistency.
🧩 Excel Data Source Structure
📘 Input_Actual Sheet – KPI Name, Month, MTD Actual, YTD Actual.
📗 Input_Target Sheet – KPI Name, Month, MTD Target, YTD Target.
📙 KPI Definition Sheet – KPI Number, Group, Name, Unit, Formula, Definition, Type (UTB/LTB).
Refresh in Power BI after updating Excel — the dashboard auto-updates instantly ✅.
💡 Why Choose This Dashboard
🌐 Centralized Monitoring – Track all KPIs from service delivery to fund utilization.
📊 Visual Storytelling – Cards, charts & icons make data easy to understand.
🧠 Smarter Decisions – Spot underperformance and take action faster.
⚙️ Automation & Accuracy – Eliminate manual reporting errors.
💬 Stakeholder Transparency – Show results clearly to donors & boards.
📈 Scalable Design – Add KPIs or service lines without re-building reports.
🌟 Advantages of the Community Services KPI Dashboard in Power BI
✅ Real-time performance monitoring.
✅ Color-coded visuals for instant insight.
✅ Automated Actual vs Target comparisons.
✅ Drill-through definition transparency.
✅ Excel-driven data — no coding required.
✅ Customizable themes & categories.
✅ Professional reports for donor and audit reviews.
🧭 How to Use It Effectively
1️⃣ Update Actual and Target data in Excel each month.
2️⃣ Refresh Power BI to load new numbers.
3️⃣ Use slicers to filter by Month or KPI Group.
4️⃣ Review Summary cards for quick status.
5️⃣ Drill through any KPI for definitions and context.
6️⃣ Export as PDF or publish to Power BI Service for team access.
In minutes, you’ll have an interactive view of community impact.
👥 Who Can Benefit from This Dashboard
Community Service Managers 🏢
Non-Profit Organizations 🤝
Government Departments 🏛️
Local Councils & Agencies 🌍
Funding & Grant Administrators 💰
Empower your team with clear insights that turn data into meaningful action.
🧠 Conclusion
The Community Services KPI Dashboard in Power BI transforms how social organizations measure performance and report impact.
It combines automation, visual clarity, and real-time analytics to enhance transparency, accountability, and decision-making.
From local NGOs to international non-profits, this tool ensures your programs stay aligned with mission goals and stakeholder expectations.
Start using it today and turn your community data into tangible impact 🌟.
🔗 Click here to read the Detailed Blog Post
🎥 Visit our YouTube Channel for step-by-step tutorials
Watch the step-by-step video tutorial:
Compatibility and Requirements
- Works in Power BI Desktop, which is free to download. Microsoft explains the install in Get Power BI Desktop.
- The dashboard reads its data from an Excel file with the Input_Actual, Input_Target and KPI Definition sheets. Refresh in Power BI after you update the Excel file.
Frequently Asked Questions
Which pages are included?
Three pages: Summary, KPI Trend and KPI Definition.
Where does the data come from?
From an Excel file. Input_Actual holds KPI Name, Month, MTD Actual and YTD Actual. Input_Target holds KPI Name, Month, MTD Target and YTD Target. The KPI Definition sheet holds the group, unit, formula, definition and type of each KPI.
How do I update the numbers?
Enter the new Actual and Target figures in Excel, then refresh the report in Power BI.
Can I see what a KPI means?
Yes. Right-click a KPI and choose Drill Through to Definition. The page shows the KPI group, unit, formula, definition and type (UTB or LTB), with a Back button to return to the Summary page.
Can I add my own KPIs?
Yes. You can add new KPIs or service categories to the Excel source file.
Is there an Excel version?
Yes. See the Community Services KPI Dashboard in Excel.
Related Community and Service Templates
- Community Services KPI Dashboard in Excel: the same dashboard topic in Excel
- Social Services KPI Dashboard in Excel: KPIs for social service programs
- Community Engagement KPI Dashboard in Excel: KPIs for engagement activities
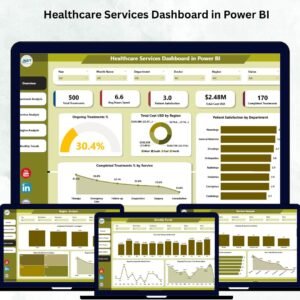
- Healthcare Services Dashboard in Power BI: another Power BI service dashboard
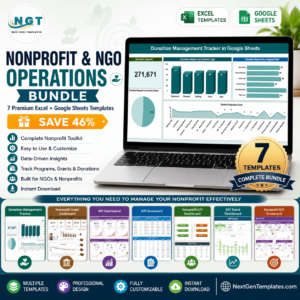
- Nonprofit & NGO Operations Bundle: 7 templates for nonprofit teams in one download
Browse all Power BI KPI dashboards.





Reviews
There are no reviews yet.