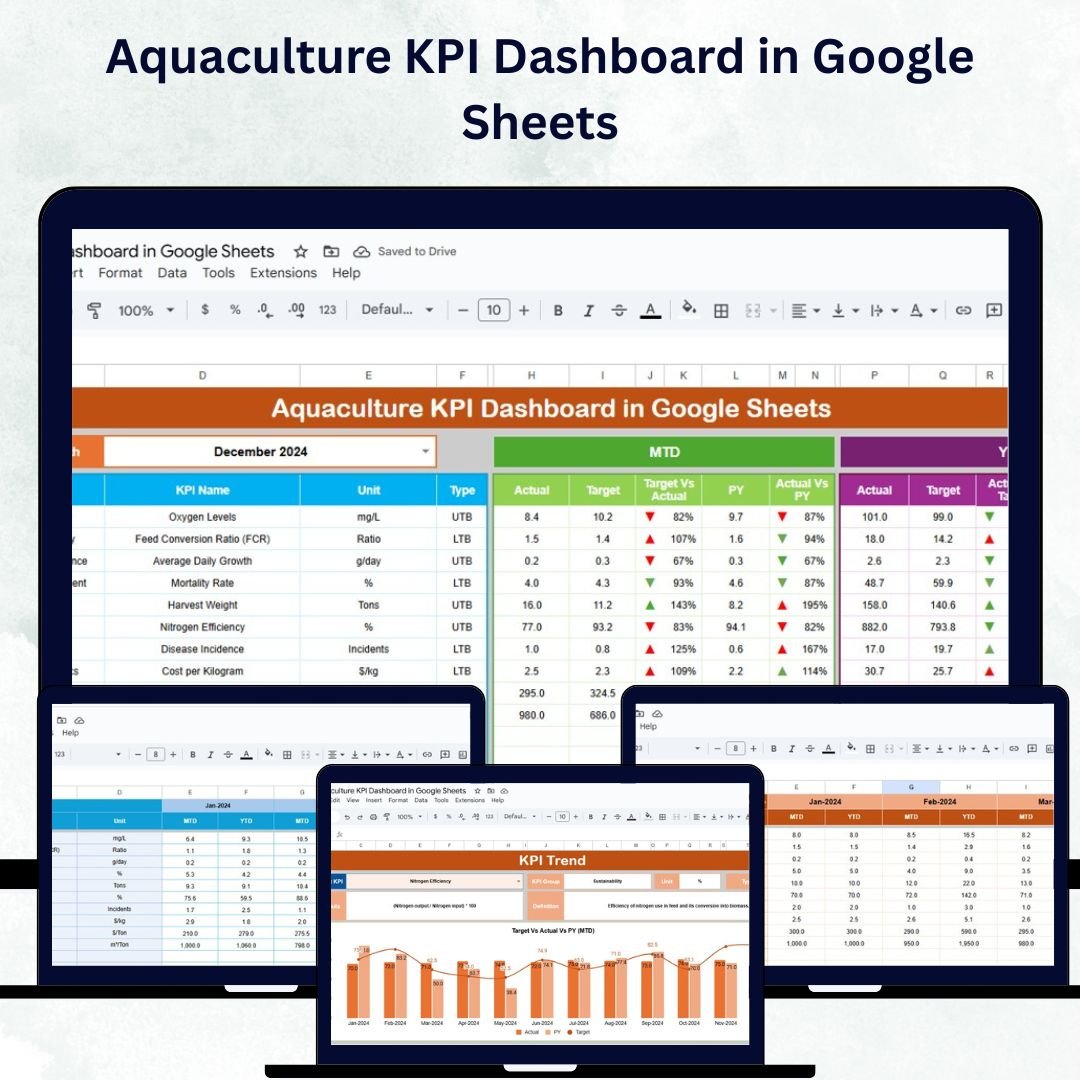
Running a successful aquaculture operation requires continuous monitoring of performance metrics across production, feed, water quality, and sustainability. The Aquaculture KPI Dashboard in Google Sheets is a ready-to-use performance management solution designed for aquaculture farms, fisheries, and hatcheries to track, analyze, and optimize key metrics in real-time. 🌊📈
Built on the flexibility of Google Sheets, this interactive dashboard consolidates month-to-date (MTD) and year-to-date (YTD) metrics along with historical data to provide actionable insights that help improve productivity, efficiency, and profitability.
🔑 Key Features of the Aquaculture KPI Dashboard in Google Sheets
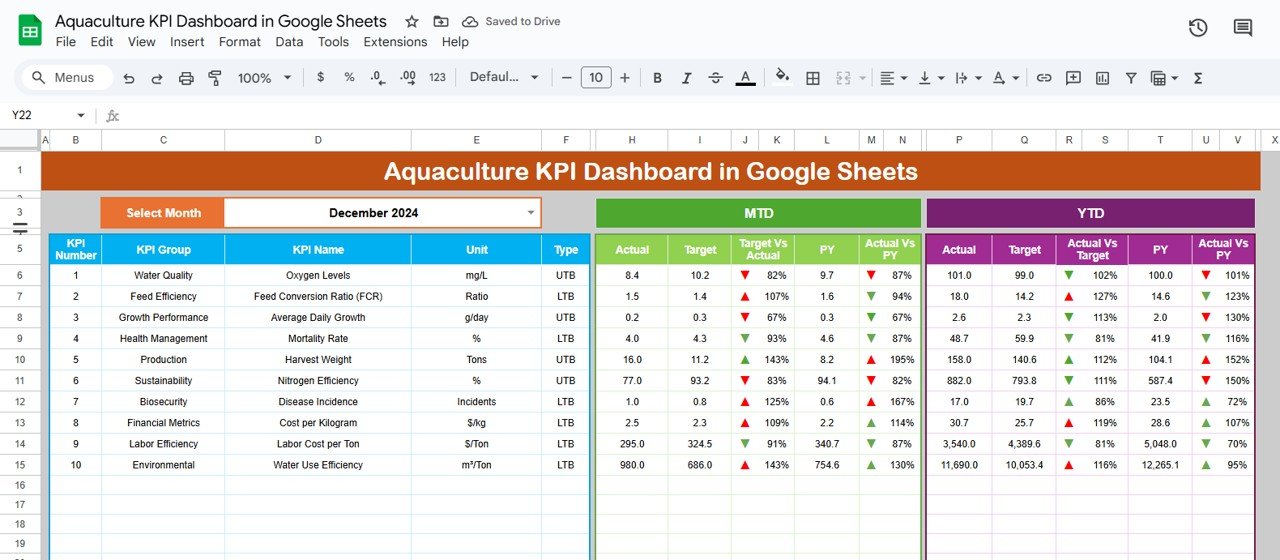
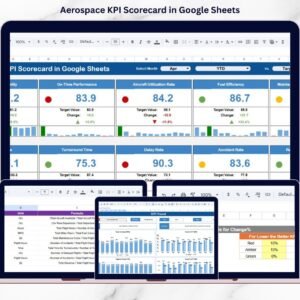
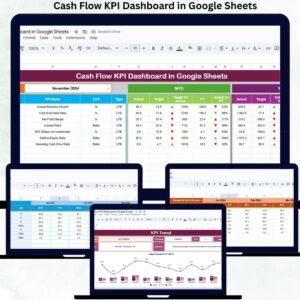
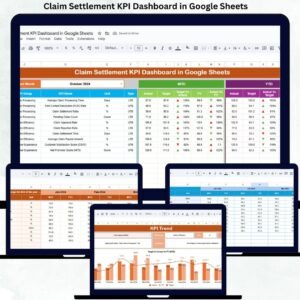
📊 Dashboard Sheet Tab
Gain a complete snapshot of your aquaculture performance in one visual view.
-
Month Selector Dropdown (Range D3): Choose the month to auto-refresh all KPIs
-
MTD Metrics: View Actual, Target, and Previous Year values with color-coded arrows
-
YTD Metrics: Monitor cumulative performance across months
-
Comparison Charts: See Target vs Actual and Previous Year vs Actual at a glance
-
Conditional Formatting: Instantly visualize performance improvements or declines
The Dashboard gives managers a real-time overview of farm efficiency and output quality.
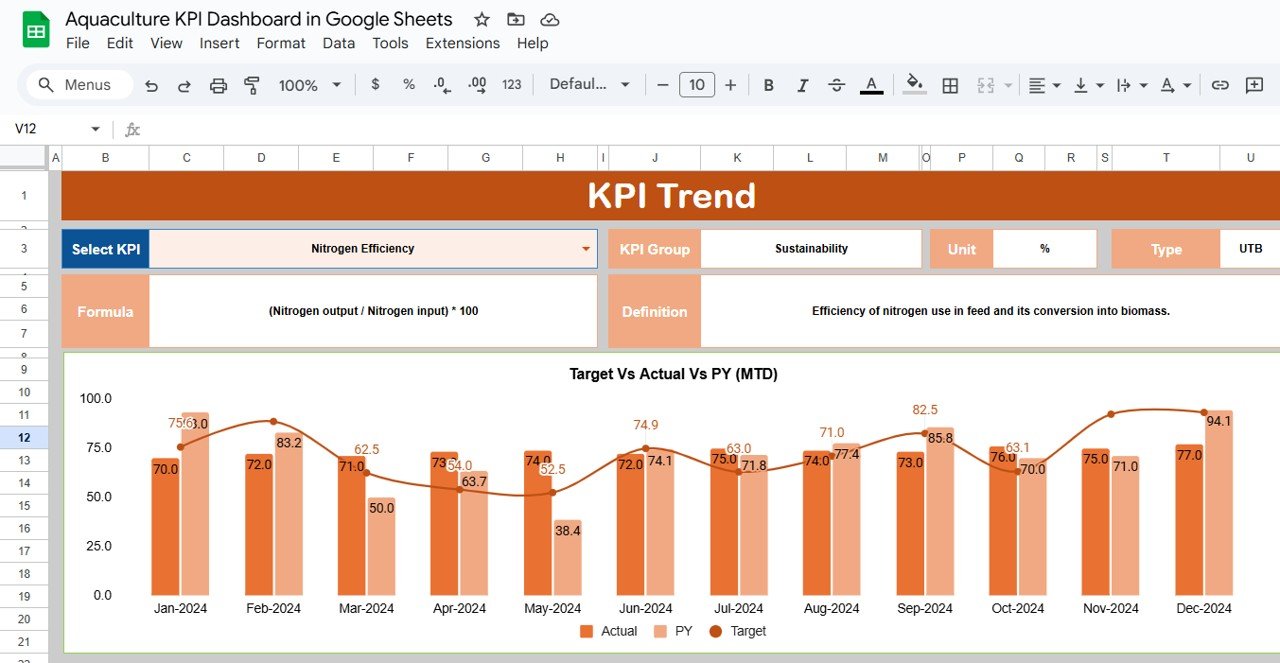
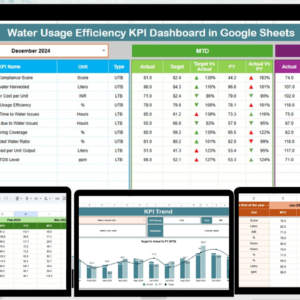
📈 KPI Trend Sheet Tab
-
Select any KPI from the dropdown (Range C3) to view its performance trend
-
Displays KPI Group, Unit, Formula, and Definition for full clarity
-
Tracks MTD and YTD trends with dynamic charts
-
Highlights whether each KPI is Lower-the-Better (LTB) or Upper-the-Better (UTB)
This helps managers identify seasonal patterns, detect issues, and monitor growth.
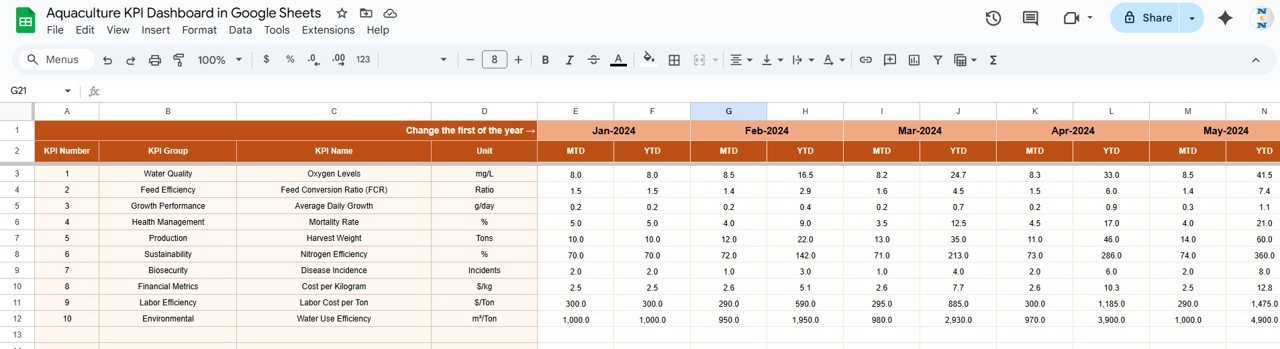
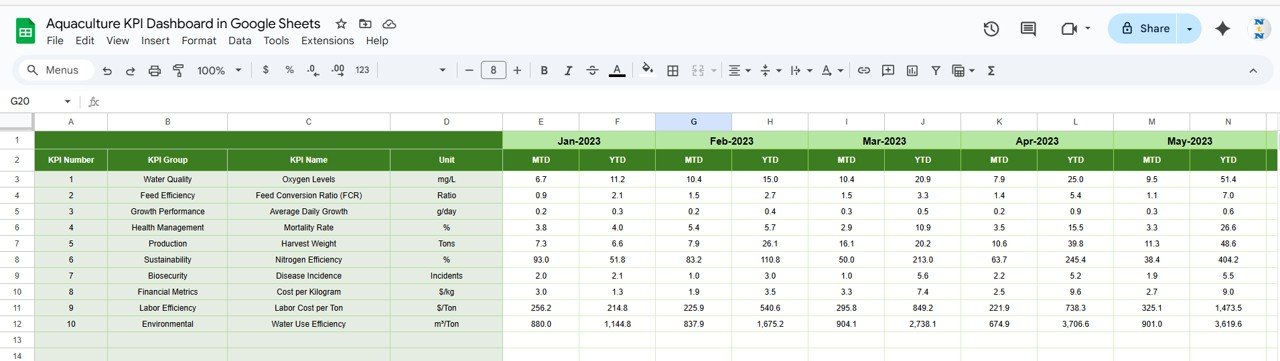
🧾 Actual Number Sheet Tab
-
Input actual performance values for each KPI
-
Supports both MTD and YTD entries
-
Adjust starting month dynamically in Range E1
-
Enables real-time updates to all reports
🎯 Target Sheet Tab
-
Record planned target values for each KPI
-
Compare Actual vs Target automatically
-
Supports both short-term and long-term goal tracking
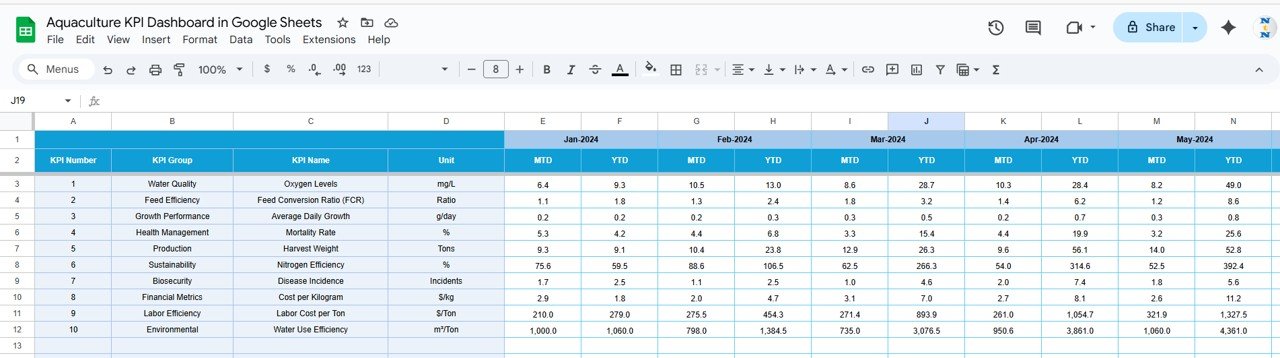
📅 Previous Year Sheet Tab
-
Store last year’s data for year-over-year comparison
-
Measure improvements in production, efficiency, and cost control
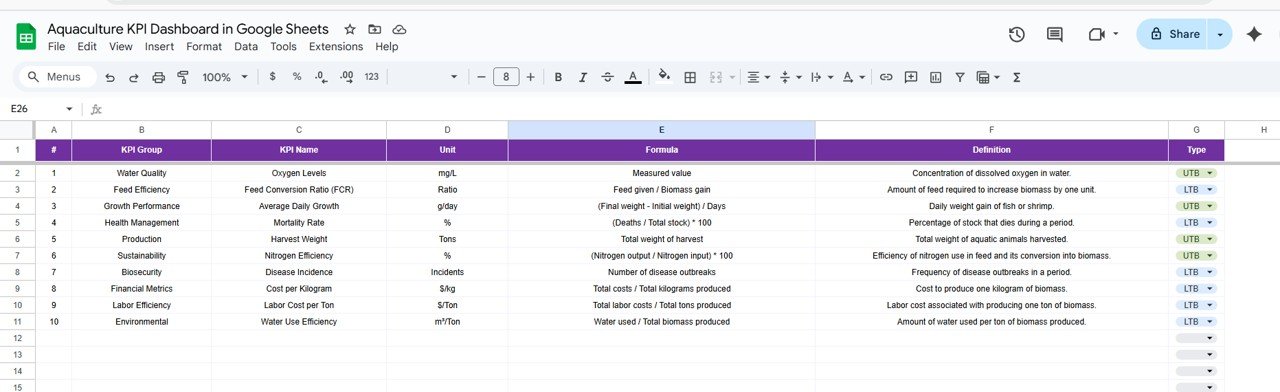
📖 KPI Definition Sheet Tab
-
Centralized documentation for every KPI
-
Columns include: KPI Name, Group, Unit, Formula, Definition, and Type (LTB/UTB)
-
Promotes accuracy, transparency, and consistent KPI interpretation
📦 What’s Inside the Aquaculture KPI Dashboard?
✅ Dashboard Sheet – Visual summary of key metrics and comparisons
✅ KPI Trend Sheet – Drill down into specific KPI trends
✅ Actual Number Sheet – Data entry section for current performance
✅ Target Sheet – Input and monitor planned goals
✅ Previous Year Sheet – Analyze year-over-year growth
✅ KPI Definition Sheet – Reference for formula and KPI explanations
Every sheet is automatically linked, ensuring data entered once updates the entire dashboard instantly. No coding or manual calculations required! 🧮🐠
🧑💼 Who Can Benefit from This Dashboard?
🎯 Aquaculture Farm Managers – Track production efficiency and mortality rates
💼 Operations Teams – Monitor feed conversion and water quality metrics
💧 Sustainability Teams – Evaluate environmental and resource performance
📊 Finance & Planning Teams – Measure cost per kilogram and revenue
🌍 Business Owners & Investors – Get clear visual insights into profitability and sustainability
This tool is scalable for fish farms, shrimp hatcheries, aquaponic setups, or integrated aquaculture businesses.
🧪 How to Use the Aquaculture KPI Dashboard
-
Enter Actual Data – Input daily, weekly, or monthly values in the Actual Sheet
-
Set Targets – Define monthly or annual goals in the Target Sheet
-
Track Trends – Analyze monthly or yearly patterns using the KPI Trend Sheet
-
Compare Performance – Review Actual vs Target and Previous Year metrics
-
Review Insights – Identify improvement areas and make informed adjustments
Built in Google Sheets, the dashboard supports real-time collaboration, enabling teams to update and review performance simultaneously. ✅
🌟 Why Choose This Dashboard?
-
Comprehensive tracking of aquaculture KPIs
-
Real-time visual performance updates
-
Clear comparisons between MTD, YTD, and Previous Year metrics
-
Fully customizable KPI setup for any farm type
-
Scalable for small, medium, or large operations
-
Built-in trend analysis and conditional formatting
-
No software installation or coding required
With the Aquaculture KPI Dashboard in Google Sheets, aquaculture professionals can transform data into actionable insights — driving better production, profitability, and sustainability. 🌊💡
🔗 Click here to read the Detailed blog post
Watch the step-by-step video Demo:


Reviews
There are no reviews yet.