




🏭 Take control of your steel & metals business with data-driven insights!
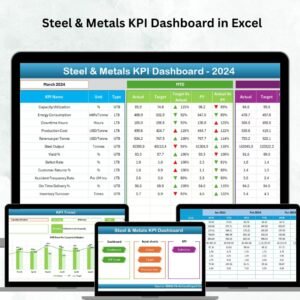
The Steel & Metals KPI Dashboard in Excel is a ready-to-use, interactive performance management tool that helps you track, analyze, and optimize operations. From production efficiency to cost management and sustainability metrics, this dashboard centralizes all key performance indicators (KPIs) in one place for smarter, faster decisions.
Instead of relying on scattered reports or manual calculations, this dashboard delivers real-time visibility into your business health. With structured worksheets, slicers, charts, and conditional formatting, it transforms raw data into actionable insights that drive productivity and profitability.
⚡ Key Features of Steel & Metals KPI Dashboard in Excel
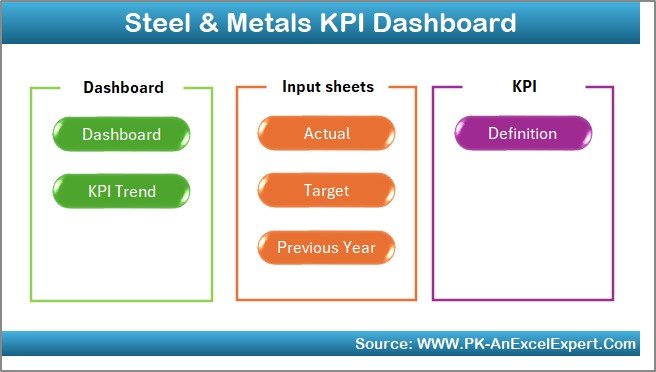
🗂️ 7 Structured Worksheets – Home, Dashboard, KPI Trend, Actuals, Targets, Previous Year, and KPI Definitions.
📊 Central Dashboard – See Month-to-Date (MTD) and Year-to-Date (YTD) Actuals vs. Targets vs. Previous Year.
📈 KPI Trend Analysis – Select any KPI to view trends, formulas, and definitions with charts for deeper insights.
📥 Actual Numbers Input – Enter monthly and yearly data for accurate reporting.
🎯 Target Sheet – Set MTD and YTD targets to track performance against planned benchmarks.
📅 Previous Year Sheet – Compare historical data to spot long-term improvements or recurring issues.
📖 KPI Dictionary – Standardize KPI definitions across departments for clarity and consistency.
✅ Visual Indicators – Conditional formatting arrows highlight performance trends at a glance.
🎨 Customizable – Add KPIs, modify formulas, or tailor sheets to fit your business needs.
📂 What’s Inside the Dashboard

Home Sheet – User-friendly navigation hub with clickable buttons to jump between sheets.
Dashboard Sheet – Central KPI view with MTD & YTD comparisons, conditional arrows, and month selector.
KPI Trend Sheet – Deep dive into KPI behavior with detailed metadata and visual trend analysis.
Actuals Sheet – Input space for current performance figures that feed into the dashboard.
Target Sheet – Define benchmarks and goals for accurate performance tracking.
Previous Year Sheet – Historical data store for year-over-year analysis.
KPI Definition Sheet – Master list of KPIs with names, formulas, groups, and definitions.
🛠️ How to Use the Dashboard
Enter Actuals – Record MTD and YTD performance data.
Set Targets – Define monthly and yearly goals for KPIs.
Compare Results – Use the Dashboard tab to view actual vs. target vs. previous year.
Analyze Trends – Switch to the KPI Trend tab to identify short-term vs. long-term patterns.
Take Action – Use insights to optimize production, costs, and sustainability initiatives.
👥 Who Can Benefit from This Dashboard?
Steel Plants & Foundries 🔩 – Monitor production efficiency and scrap rates.
Manufacturing Leaders 🏭 – Track output, downtime, and material usage.
Quality Teams ✅ – Measure defect rates and compliance with standards.
Supply Chain Managers 🚚 – Evaluate logistics, raw material costs, and vendor performance.
Finance Teams 💰 – Compare costs against budgets and improve forecasting.
Executives 📈 – Access a bird’s-eye view of organizational performance.
⭐ Best Practices
Define KPIs clearly in the KPI Definition sheet.
Keep actuals and targets updated regularly.
Use visual indicators for quick decision-making.
Benchmark against previous year data for realistic goals.
Customize KPIs for different plants or product lines.
Automate repetitive updates with Excel formulas or macros.
🔧 Opportunities for Improvement
🔗 ERP Integration – Automate data import from ERP/SCM systems.
☁️ Cloud Access – Share dashboards on cloud-based Excel for collaboration.
📊 Advanced Visuals – Add pivot dashboards or slicers for deeper interactivity.
🤖 VBA Automation – Save time by automating repetitive reporting tasks.
🔒 Data Security – Introduce access control for sensitive business data.
✅ Conclusion
The Steel & Metals KPI Dashboard in Excel is more than just a reporting sheet—it’s a decision-making engine for your business. By consolidating production, cost, quality, and sustainability KPIs into one interactive dashboard, it ensures better visibility, faster decisions, and improved performance.
Whether you’re running a steel plant, managing supply chains, or leading operations, this tool provides the structure and insights you need to stay competitive in today’s demanding industry.
🔗 Click here to read the Detailed blog post
Visit our YouTube channel to learn step-by-step video tutorials
Watch the step-by-step video tutorial:
Compatibility and Requirements
- Works in Microsoft Excel desktop (Excel 2016 or later, or Microsoft 365).
- You pick the month from a dropdown on the Dashboard sheet. Microsoft explains dropdowns in Create a drop-down list.
Frequently Asked Questions
Which sheets are included?
Seven sheets: Home, Dashboard, KPI Trend, Actual Numbers Input, Target, Previous Year Numbers and KPI Definition.
How do I update the dashboard?
Enter your monthly figures in the Actual Numbers Input sheet and your goals in the Target sheet. Then pick a month on the Dashboard sheet and the MTD and YTD comparisons update.
Can I compare this year with last year?
Yes. Add last year’s figures to the Previous Year Numbers sheet. The Dashboard shows them next to your actuals and targets, with up and down arrows.
How do I see the trend for one KPI?
Open the KPI Trend sheet and select the KPI from the dropdown. Charts show its MTD and YTD trend, along with its unit, type and formula.
Can I change the steel KPIs?
Yes. Edit the KPI Definition sheet to add or change KPIs, their units and formulas.
Is there a Power BI version?
Yes. See the Steel & Metals KPI Dashboard in Power BI.
Related Steel and Metals Templates
- Steel & Metals KPI Dashboard in Power BI: the Power BI edition
- Steel & Metals Dashboard in Excel: an operations dashboard for the same industry
- Steel & Metals Dashboard in Google Sheets: the dashboard in Google Sheets
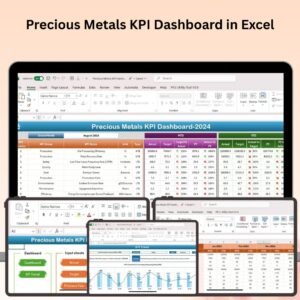
- Precious Metals KPI Dashboard in Excel: KPIs for precious metals businesses
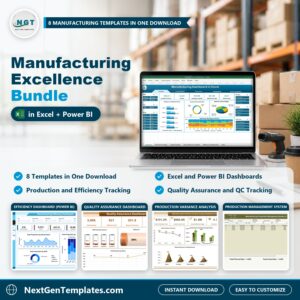
- Manufacturing Excellence Bundle: 8 manufacturing templates in one download
Browse all Excel KPI dashboards.














Reviews
There are no reviews yet.