

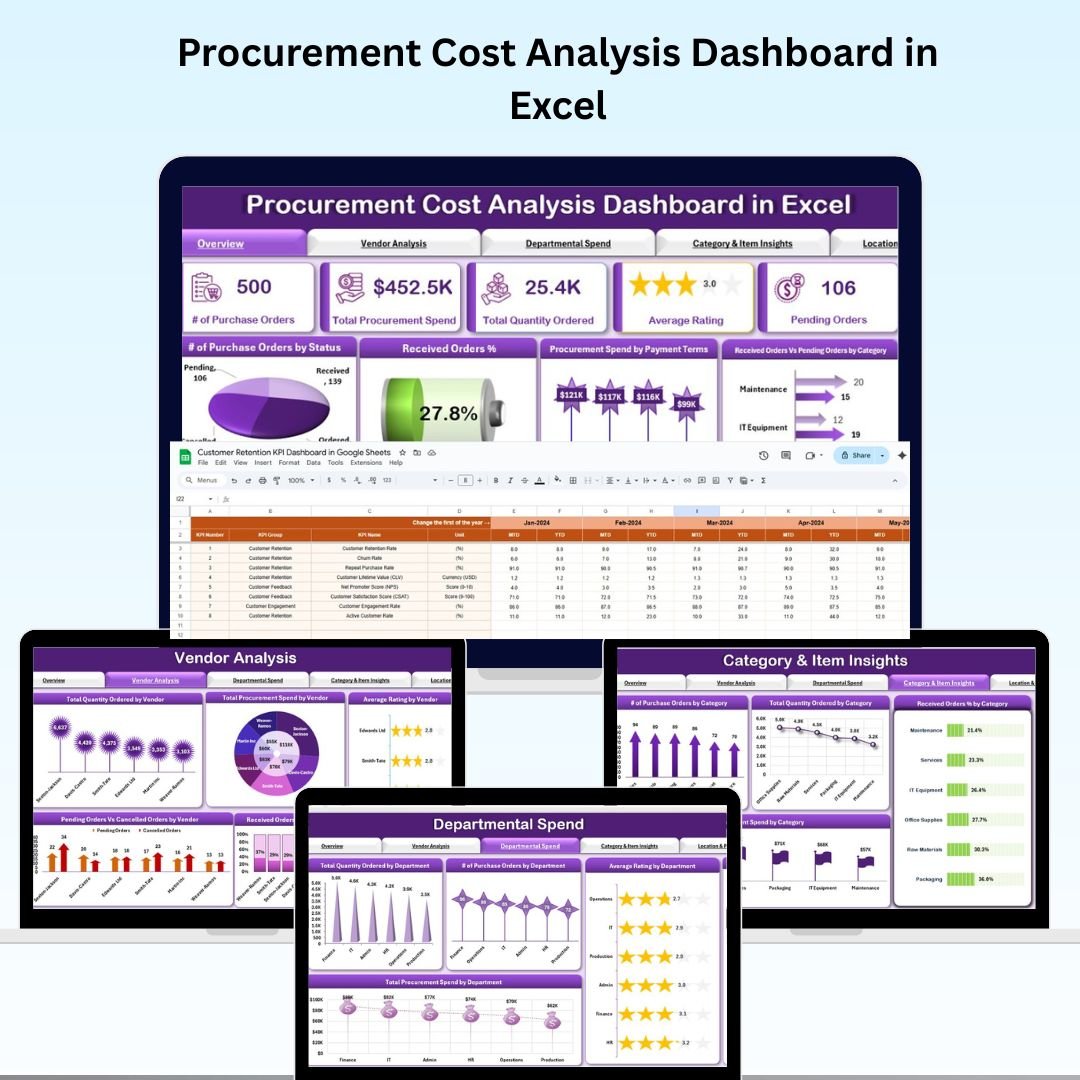

Managing procurement effectively is essential for keeping business operations smooth and controlling costs. 💼 The Procurement Cost Analysis Dashboard in Excel is a ready-to-use, interactive solution designed to give procurement teams a real-time view of spending, vendor performance, departmental budgets, and cost optimization opportunities.
With its clean design, pre-built charts, and automated calculations, this dashboard empowers decision-makers to track key procurement metrics, uncover inefficiencies, and make data-driven improvements — all within Excel. 📊✅
🔑 Key Features of the Procurement Cost Analysis Dashboard
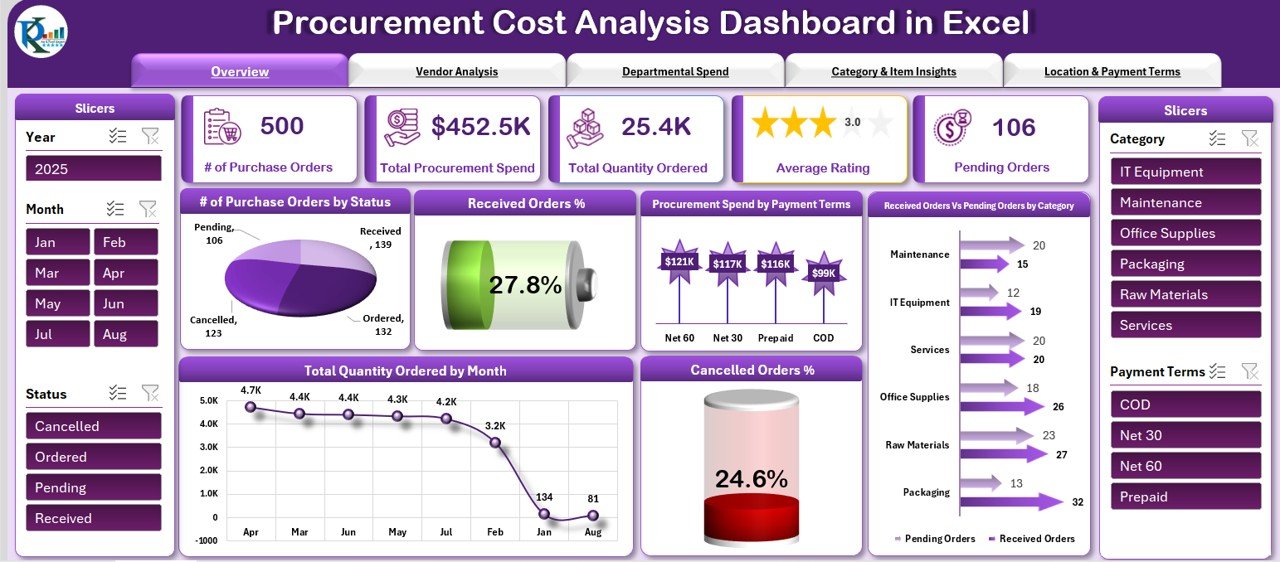
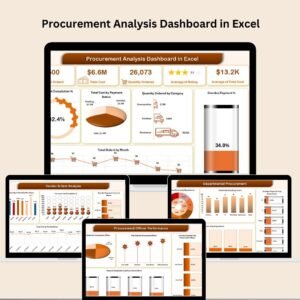
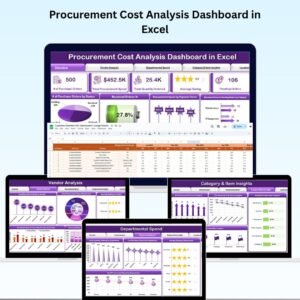
📌 Overview Sheet – Complete Procurement Summary
Cards for Key Metrics – Purchase Orders, Total Spend, Quantity Ordered, Average Rating, Pending Orders
Insightful Charts – Order Status, Received Orders %, Spend by Payment Terms, Received vs Pending Orders by Category, Quantity Ordered by Month, and Cancelled Orders %
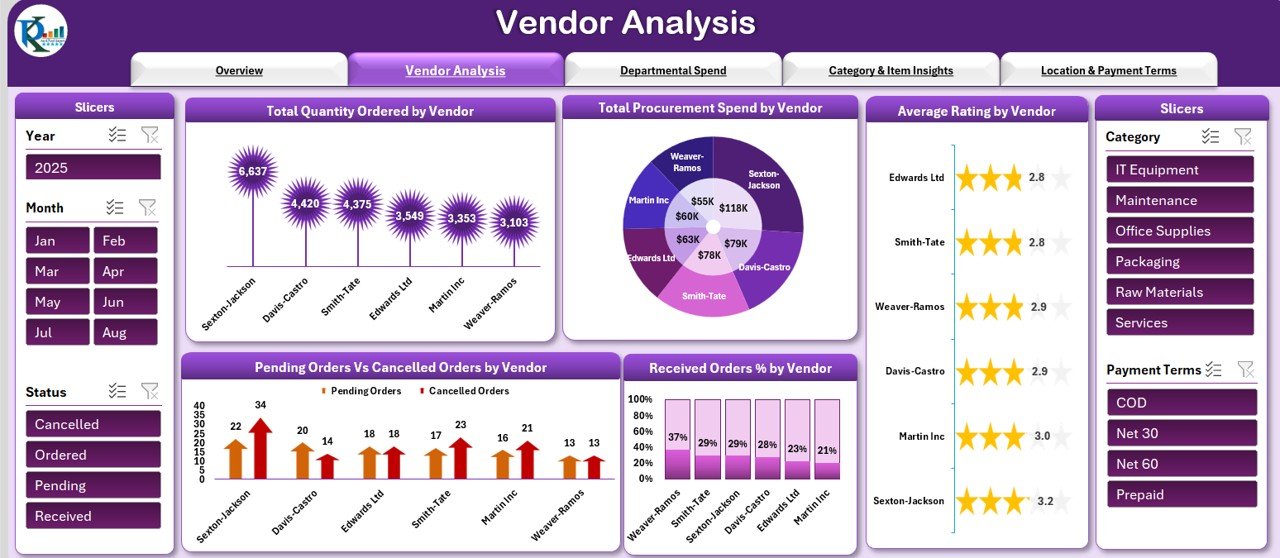
📌 Vendor Analysis – Measure Supplier Performance
Compare Total Spend, Quantity Ordered, Average Ratings, and Order Fulfillment % across vendors
Identify high-performing suppliers and flag those with high cancellation or pending rates
Optimize vendor partnerships with clear performance data
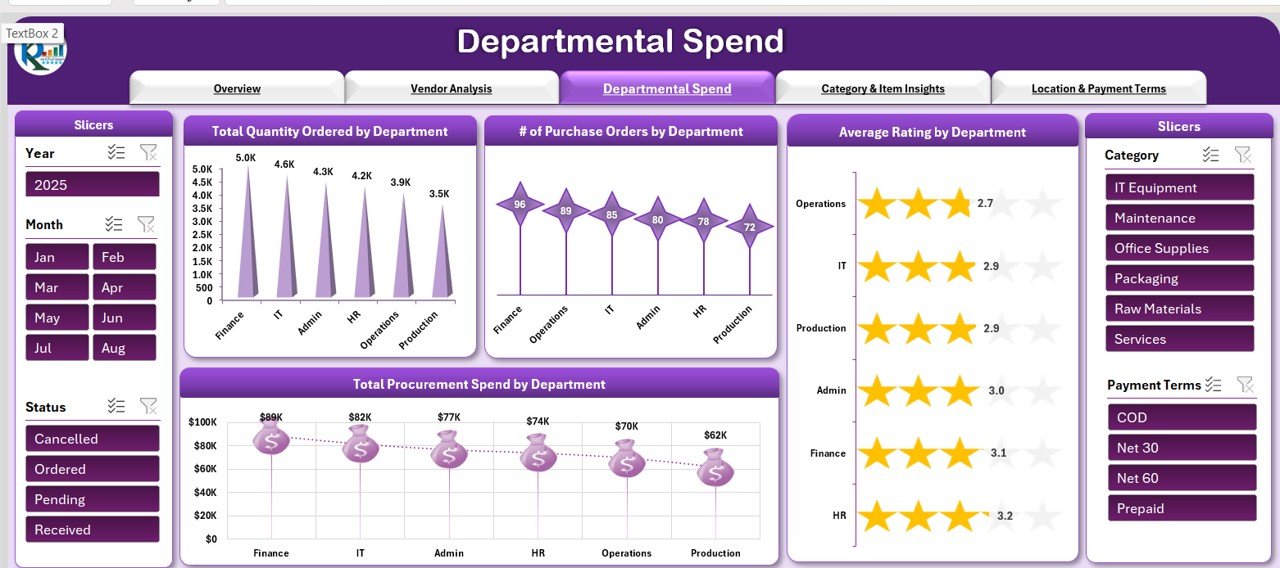
📌 Departmental Spend – Budget Tracking by Team
Monitor procurement activity per department
Track Quantity Ordered, Purchase Orders, Average Ratings, and Spend per department
Improve budget compliance and resource allocation
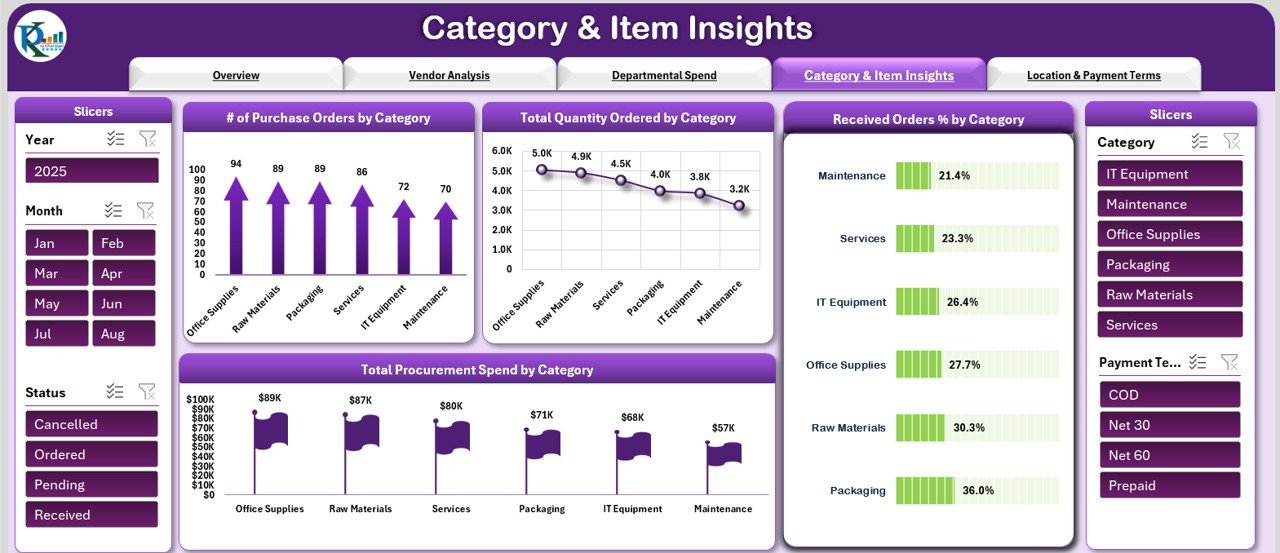
📌 Category & Item Insights – Understand Procurement Priorities
Analyze Purchase Orders, Quantities, Spend, and Fulfillment Rates by category
Identify high-cost procurement categories for better negotiation and planning
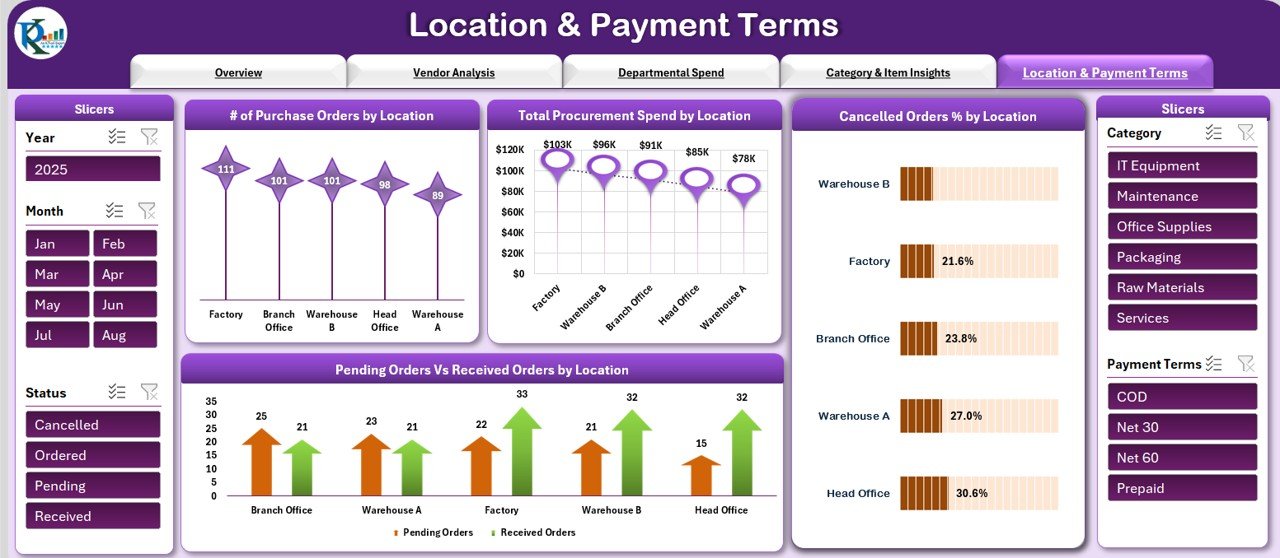
📌 Location & Payment Terms – Regional and Financial Insights
View procurement performance by location with spend, order counts, and cancellation rates
Analyze spending patterns by payment terms (Net 30, Net 60, etc.) to manage cash flow better
📌 Data Input Sheet – Centralized Data Entry
All procurement data entered here automatically updates the dashboard and all charts
Easy-to-use structure for consistent, accurate reporting
📦 What’s Inside the Procurement Cost Analysis Dashboard?
When you download this dashboard, you get:
✅ Overview Sheet – Key metrics and visual summaries
✅ Vendor Analysis Tab – Supplier performance breakdown
✅ Departmental Spend Tab – Department-level procurement tracking
✅ Category & Item Insights Tab – Category-wise cost analysis
✅ Location & Payment Terms Tab – Regional and payment term performance
✅ Data Input Sheet – Single entry point for all procurement data
✅ Pre-Built Charts & Formulas – Fully functional and ready to use
✅ Customizable Layout – Adapt it to your organization’s needs
🧠 How to Use the Procurement Cost Analysis Dashboard
Download & Open the Excel file
Enter Procurement Data into the Data Input Sheet
View Metrics in the Overview Sheet for a quick summary
Analyze Vendors, Departments, and Categories for cost optimization
Use Location & Payment Insights to refine purchasing strategies
Update Data Regularly to maintain real-time visibility
👥 Who Can Benefit from This Dashboard?
📦 Procurement Managers – Monitor costs, suppliers, and order status in one place
🏢 Finance Teams – Track spending patterns and ensure budget compliance
🛠 Operations Managers – Identify procurement bottlenecks and streamline processes
🌍 Multi-Location Businesses – Compare procurement performance across regions
🏭 Manufacturing & Retail Companies – Manage supplier relations and control category spending
🔗 Click here to read the Detailed blog post
Watch the step-by-step video Demo:
🔗 Visit our YouTube channel to learn step-by-step video tutorials
Compatibility and Requirements
- Works in Microsoft Excel desktop (Excel 2016 or later, or Microsoft 365).
- For help with the Excel features it uses, see Microsoft’s guide Create a chart from start to finish.
Frequently Asked Questions
Which KPI cards does the Overview sheet show?
Purchase Orders, Total Spend, Quantity Ordered, Average Rating and Pending Orders.
Can I compare vendors?
Yes. The Vendor Analysis sheet compares total spend, quantity ordered, average ratings and order fulfillment % across vendors.
Does it show spend by payment terms?
Yes. The Location and Payment Terms sheet breaks spending down by terms such as Net 30 and Net 60, and by location.
Where do I enter procurement data?
In the Data Input Sheet. Everything you enter there updates the dashboard and all charts.
Related Procurement Templates
- Procurement Dashboard in Excel: a broader procurement dashboard in Excel.
- Procurement Spend Analysis Dashboard in Excel: analyze spend by category and supplier.
- Procurement Tracker and Dashboard in Google Sheets: track purchases in Google Sheets.
- Procurement Dashboard in Power BI: the Power BI procurement dashboard.
- Procurement and Vendor Management Kit: 7 procurement and vendor templates in one kit.
Browse all Excel dashboards or the Excel operations templates.








Reviews
There are no reviews yet.