

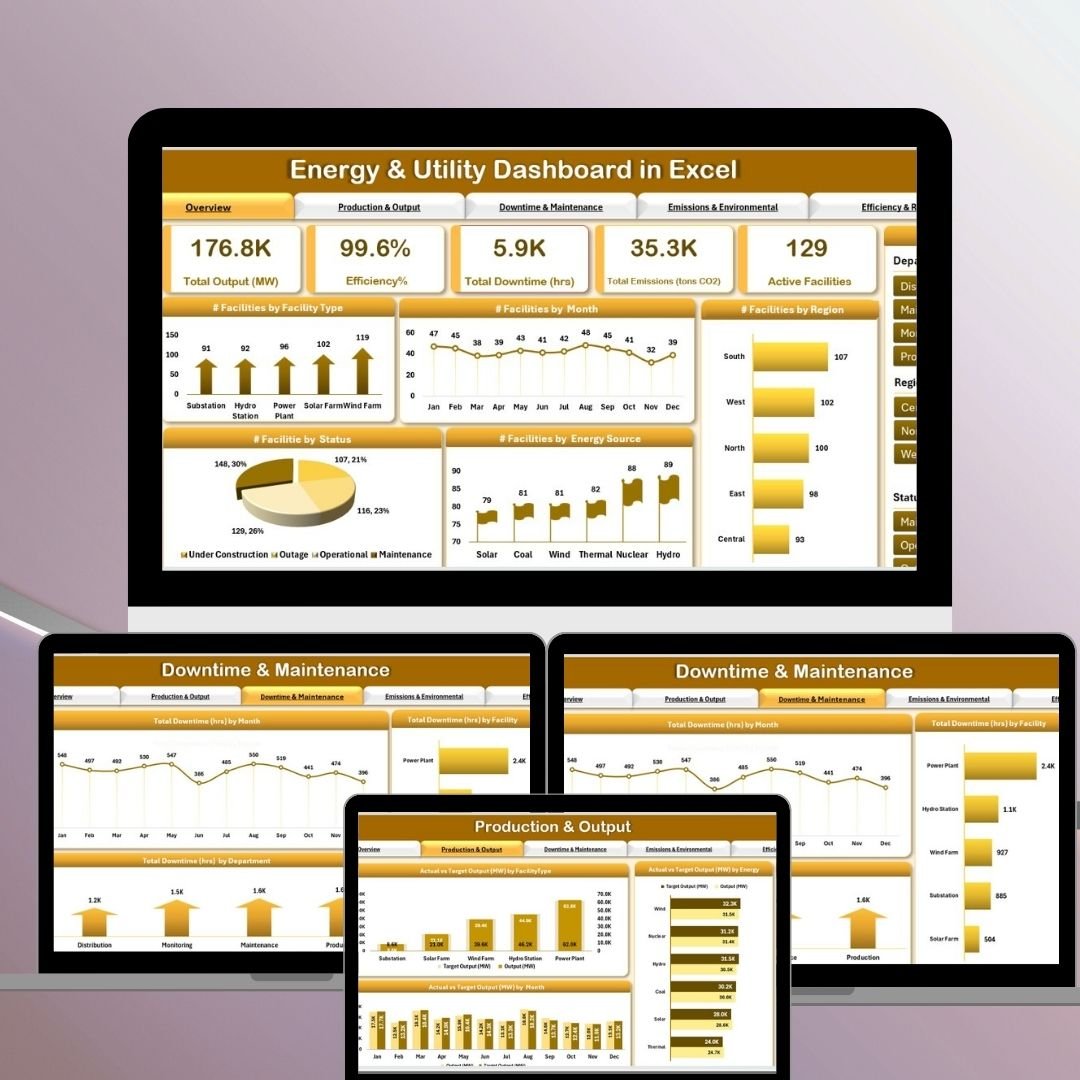

The Energy & Utility Dashboard in Excel is an essential tool designed to help energy and utility organizations monitor, track, and optimize their operations efficiently. Whether you’re managing energy production, facility performance, or emissions, this interactive, ready-to-use template in Excel allows you to visualize key performance indicators (KPIs) related to your operations. With various charts, real-time data, and in-depth analytics, it’s easy to track metrics and make informed, data-driven decisions.
The Energy & Utility Dashboard provides a structured and organized platform to monitor various KPIs such as energy output, downtime, emissions, operational efficiency, and more. Through the use of Excel’s dynamic features like slicers, pivot tables, and charts, this dashboard allows for a comprehensive understanding of facility performance and helps drive improvements across energy and utility systems.
🌍 What’s Inside the Energy & Utility Dashboard 🌍
The Energy & Utility Dashboard consists of several worksheets, each designed to track a different aspect of operations:
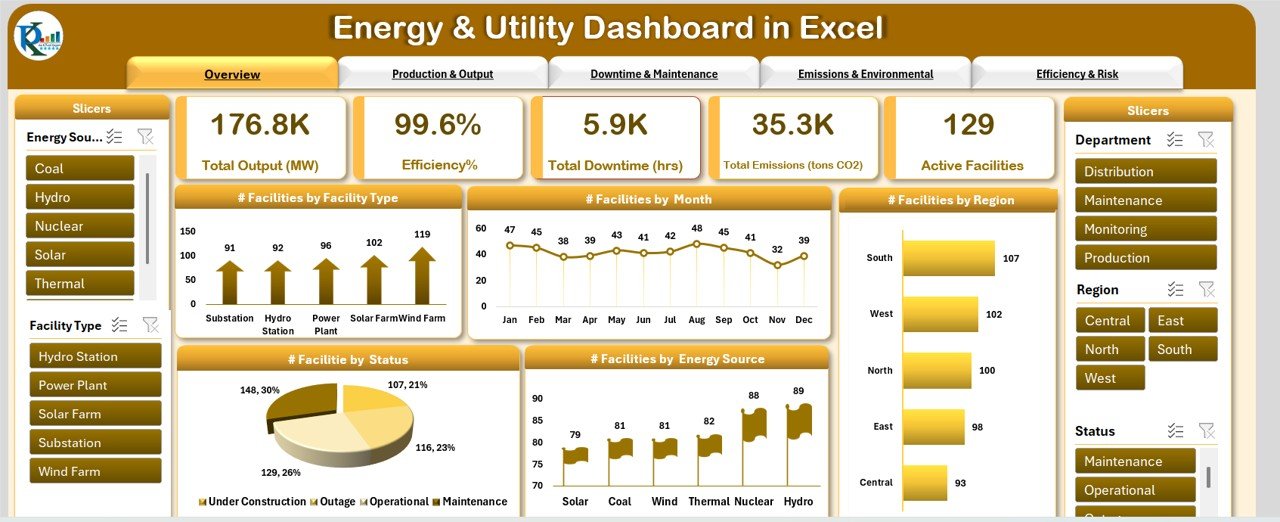
Overview Sheet Tab
Cards:
Total Output (MW): Total energy output for the facilities.
Efficiency %: Overall energy production efficiency.
Total Downtime (hrs): Total downtime across all facilities.
Total Emissions (tons CO2): Total CO2 emissions.
Active Facilities: Number of operational facilities.
Charts:
Facilities by Facility Type: Breakdown of facilities based on type.
Facilities by Month: Performance over the months.
Facilities by Region: Geographical distribution of facilities.
Facilities by Status: Operational status of facilities.
Facilities by Energy Source: Energy source breakdown across facilities.
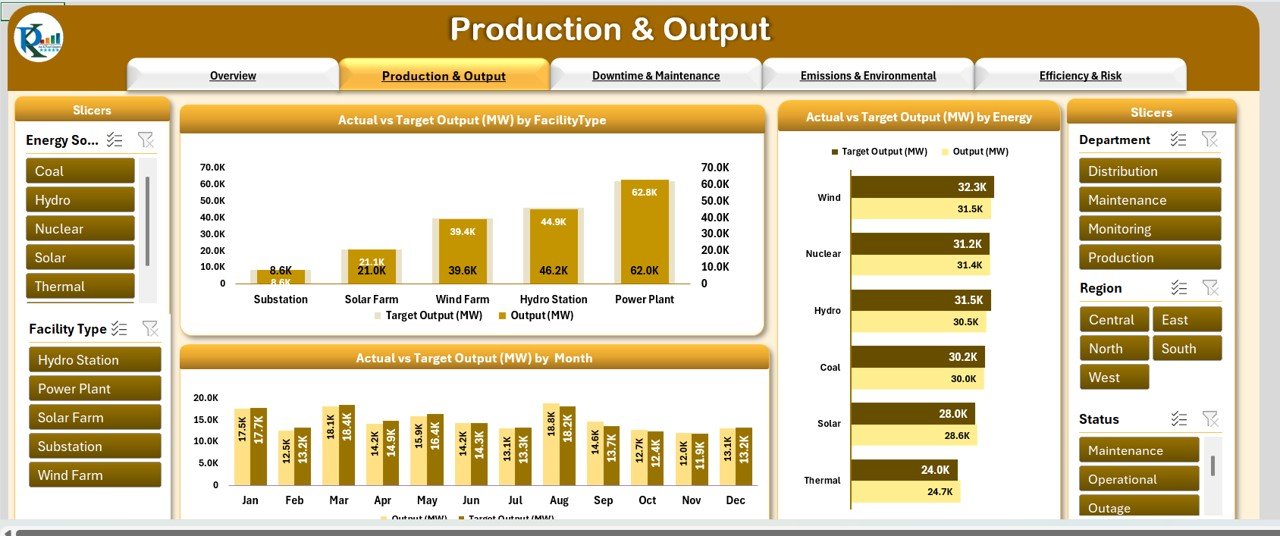
Production & Output Sheet Tab
Charts:
Actual vs Target Output (MW) by Facility Type: Comparing actual output to the target for each facility type.
Actual vs Target Output (MW) by Energy Source: Comparing output by energy source.
Actual vs Target Output (MW) by Month: Comparing monthly output to the target.
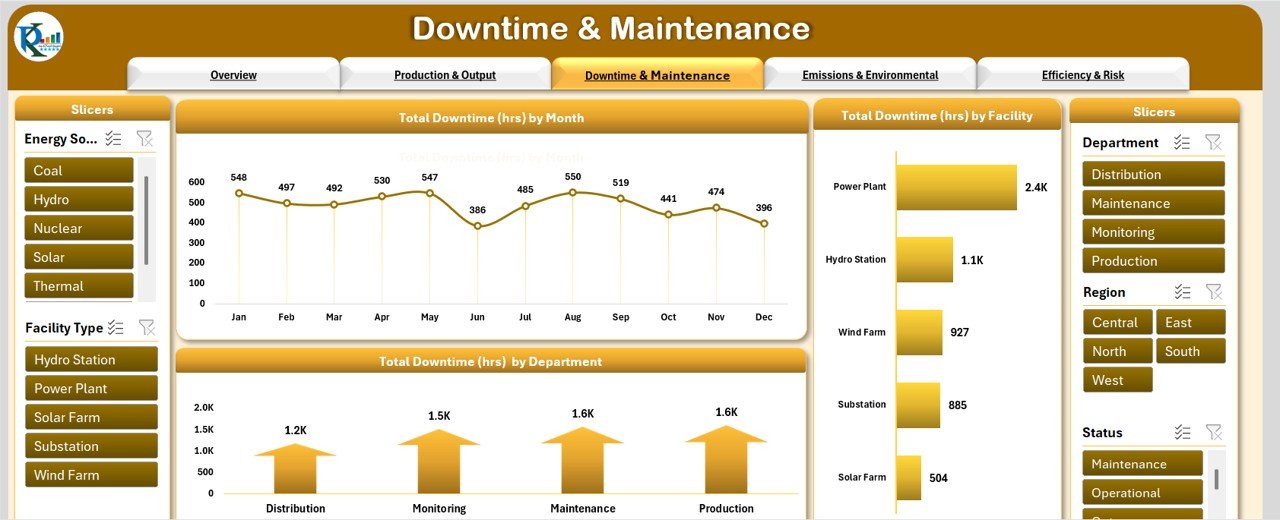
Downtime & Maintenance Sheet Tab
Charts:
Total Downtime (hrs) by Month: Total downtime across the months.
Total Downtime (hrs) by Facility Type: Downtime categorized by facility type.
Total Downtime (hrs) by Department: Downtime categorized by departments managing the facilities.
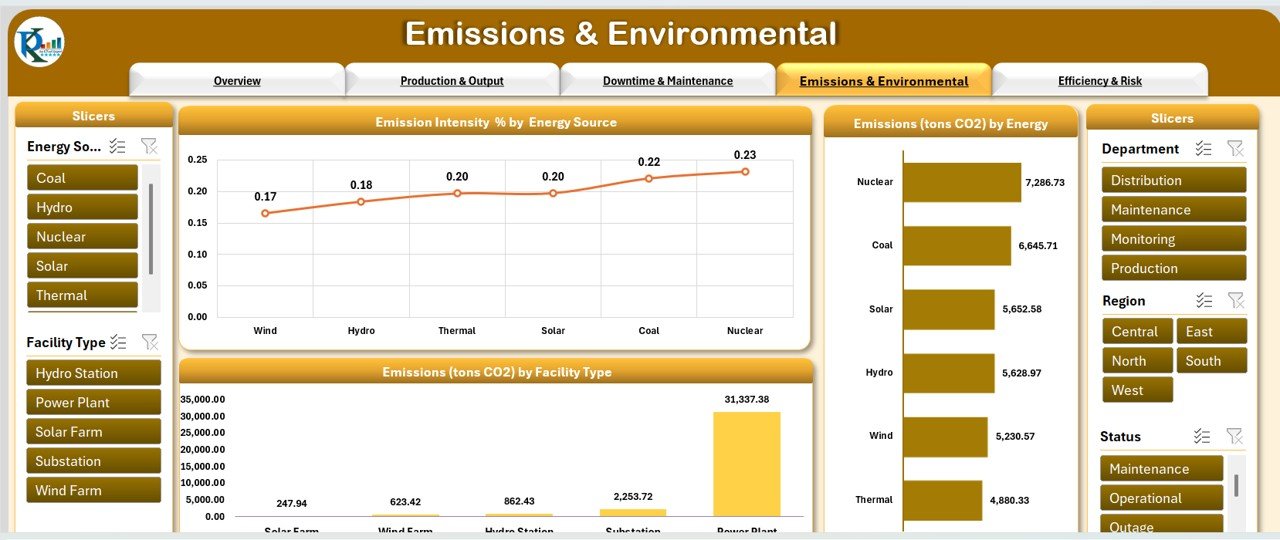
Emissions & Environmental Sheet Tab
Charts:
Emission Intensity (%) by Energy Source: Tracks emission intensity by energy type.
Emissions (tons CO2) by Facility Type: Emissions for each facility type.
Emissions (tons CO2) by Energy Source: Emissions comparison by energy source.
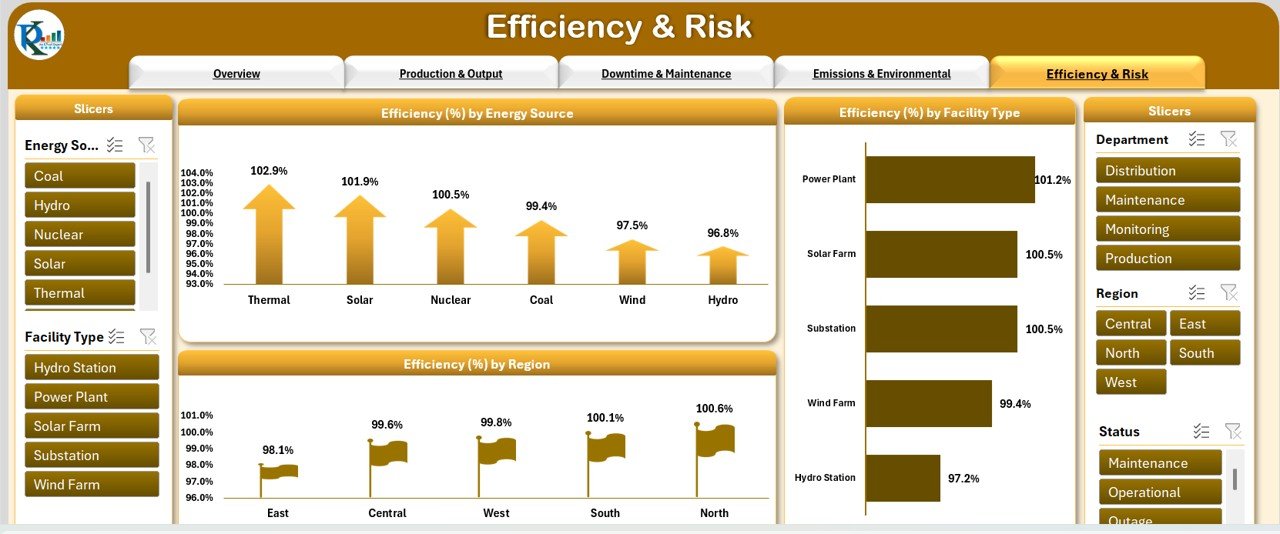
Efficiency & Risk Sheet Tab
Charts:
Efficiency (%) by Energy Source: Shows energy efficiency by energy source.
Efficiency (%) by Facility Type: Breaks down efficiency by facility type.
Efficiency (%) by Region: Regional breakdown of efficiency data.
Data Sheet Tab
This sheet is where raw data is entered, including:
Facility ID: Unique identifier for each facility.
Energy Source: The energy source used by the facility.
Facility Type: Category of the facility.
Region: Facility location.
Status: Operational status.
Output (MW): Energy produced.
Emissions (tons CO2): Emissions recorded.
Efficiency (%): Energy efficiency.
Month/Year: Timeframe for the data entry.
🏅 Advantages of Using the Energy & Utility Dashboard 🏅
The Energy & Utility Dashboard offers multiple benefits that drive better decision-making and operational improvements:
Comprehensive Data Visualization: View key metrics across different charts, making it easier to interpret and act on performance data.
Real-Time Monitoring: The dashboard updates in real-time, ensuring you are always working with the latest data for faster, informed decisions.
Improved Efficiency: Identify operational bottlenecks like downtime or high emissions and take action to improve efficiency.
Operational Insights: Compare actual performance against targets and historical data, providing actionable insights that help optimize facility operations.
Cost-Effectiveness: As a ready-to-use Excel template, the dashboard is a cost-effective solution for energy and utility companies to manage operations without the need for expensive software.
🚀 Opportunities for Improvement in the Energy & Utility Dashboard 🚀
While the Energy & Utility Dashboard provides valuable insights, here are some areas that can be enhanced:
Automation of Data Updates: Integrating the dashboard with energy monitoring systems or IoT sensors could automate data collection and reduce the need for manual updates.
Advanced Data Visualization: Adding more sophisticated chart types or visualization tools would help track trends more effectively.
Predictive Analytics: Implementing predictive analytics could help forecast potential issues such as energy shortages, downtime, or emissions spikes, allowing for more proactive management.
Mobile Compatibility: Optimizing the dashboard for mobile devices would enable energy managers and decision-makers to access key metrics on the go.
📈 Best Practices for Using the Energy & Utility Dashboard 📈
To make the most of the Energy & Utility Dashboard, consider these best practices:
Update Data Regularly: Ensure that your data is kept up-to-date for accurate performance tracking.
Focus on High-Impact KPIs: Prioritize KPIs that significantly affect energy production, efficiency, and cost management.
Monitor Trends Over Time: Regularly analyze trends to spot areas for improvement and adjust strategies accordingly.
Collaborate Across Teams: Share the dashboard with all relevant stakeholders to ensure that everyone is aligned on performance goals and strategies.
Use Conditional Formatting: Leverage Excel’s conditional formatting to quickly identify areas that require attention, such as underperforming facilities or excessive emissions.
🔑 Conclusion 🔑
The Energy & Utility Dashboard in Excel is an invaluable tool for managing and optimizing energy production and utility operations. By tracking KPIs such as energy output, downtime, emissions, and operational efficiency, this dashboard provides key insights that help decision-makers improve performance and achieve sustainability goals. By incorporating best practices and exploring opportunities for improvement, your organization can further enhance operational efficiency and reduce environmental impact.
Frequently Asked Questions (FAQs)
What KPIs are tracked in the Energy & Utility Dashboard?
The dashboard tracks KPIs such as energy output, emissions, downtime, efficiency, and more to monitor the performance of energy and utility operations.
How do I update the Energy & Utility Dashboard?
Data is updated by entering actual performance data in the Data Sheet. Once updated, the dashboard charts and metrics automatically refresh.
Can I customize the Energy & Utility Dashboard?
Yes, the dashboard is fully customizable. You can modify KPIs, add new metrics, or adjust chart types to fit your organization’s specific needs.
Is the Energy & Utility Dashboard compatible with all Excel versions?
The dashboard is compatible with Excel 2016 and later versions, supporting slicers, pivot tables, and advanced charting features.
Can I automate data entry in the Energy & Utility Dashboard?
Yes, automation can be achieved by integrating the dashboard with IoT sensors or SCADA systems for real-time data updates.
Visit our YouTube channel to learn step-by-step video tutorials
Click here to read the detailed blog post































Reviews
There are no reviews yet.