

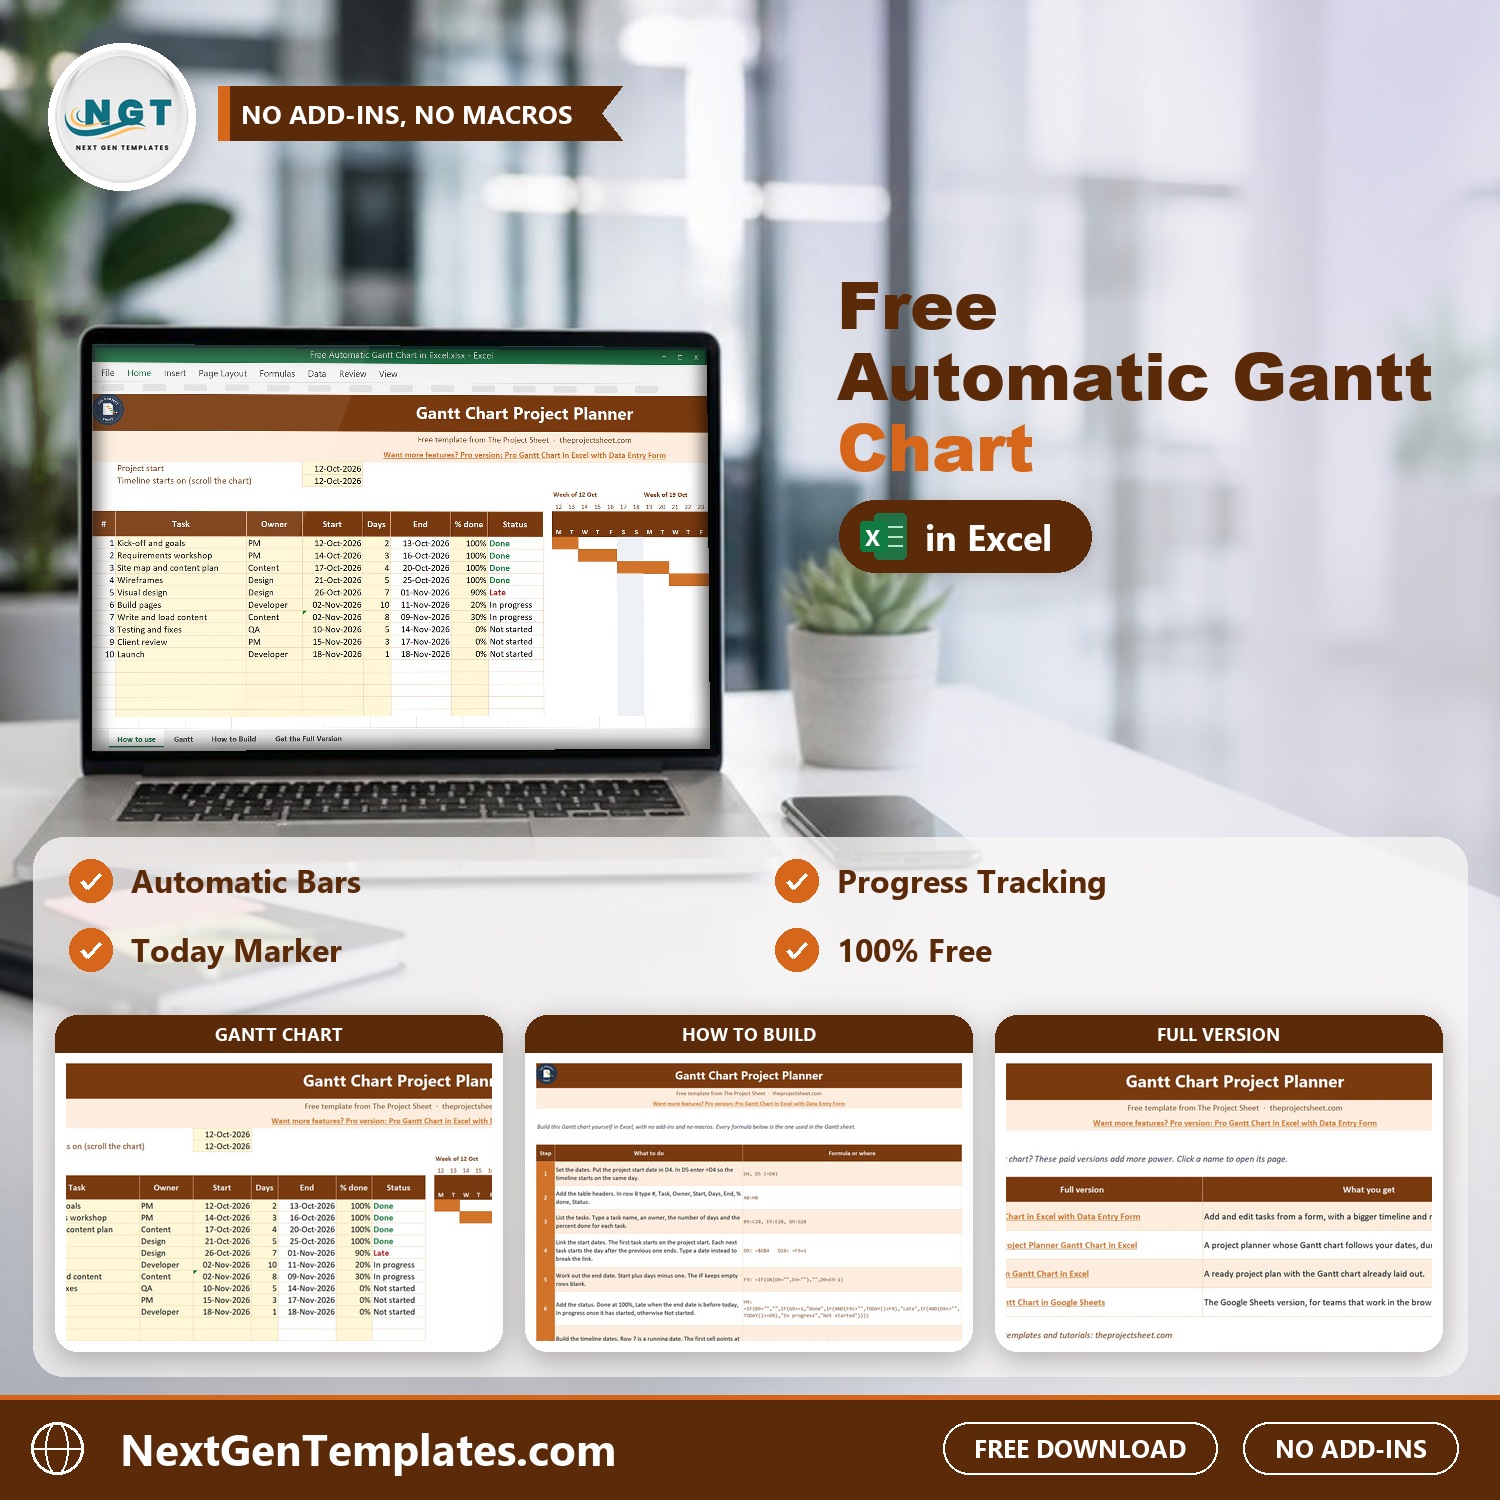
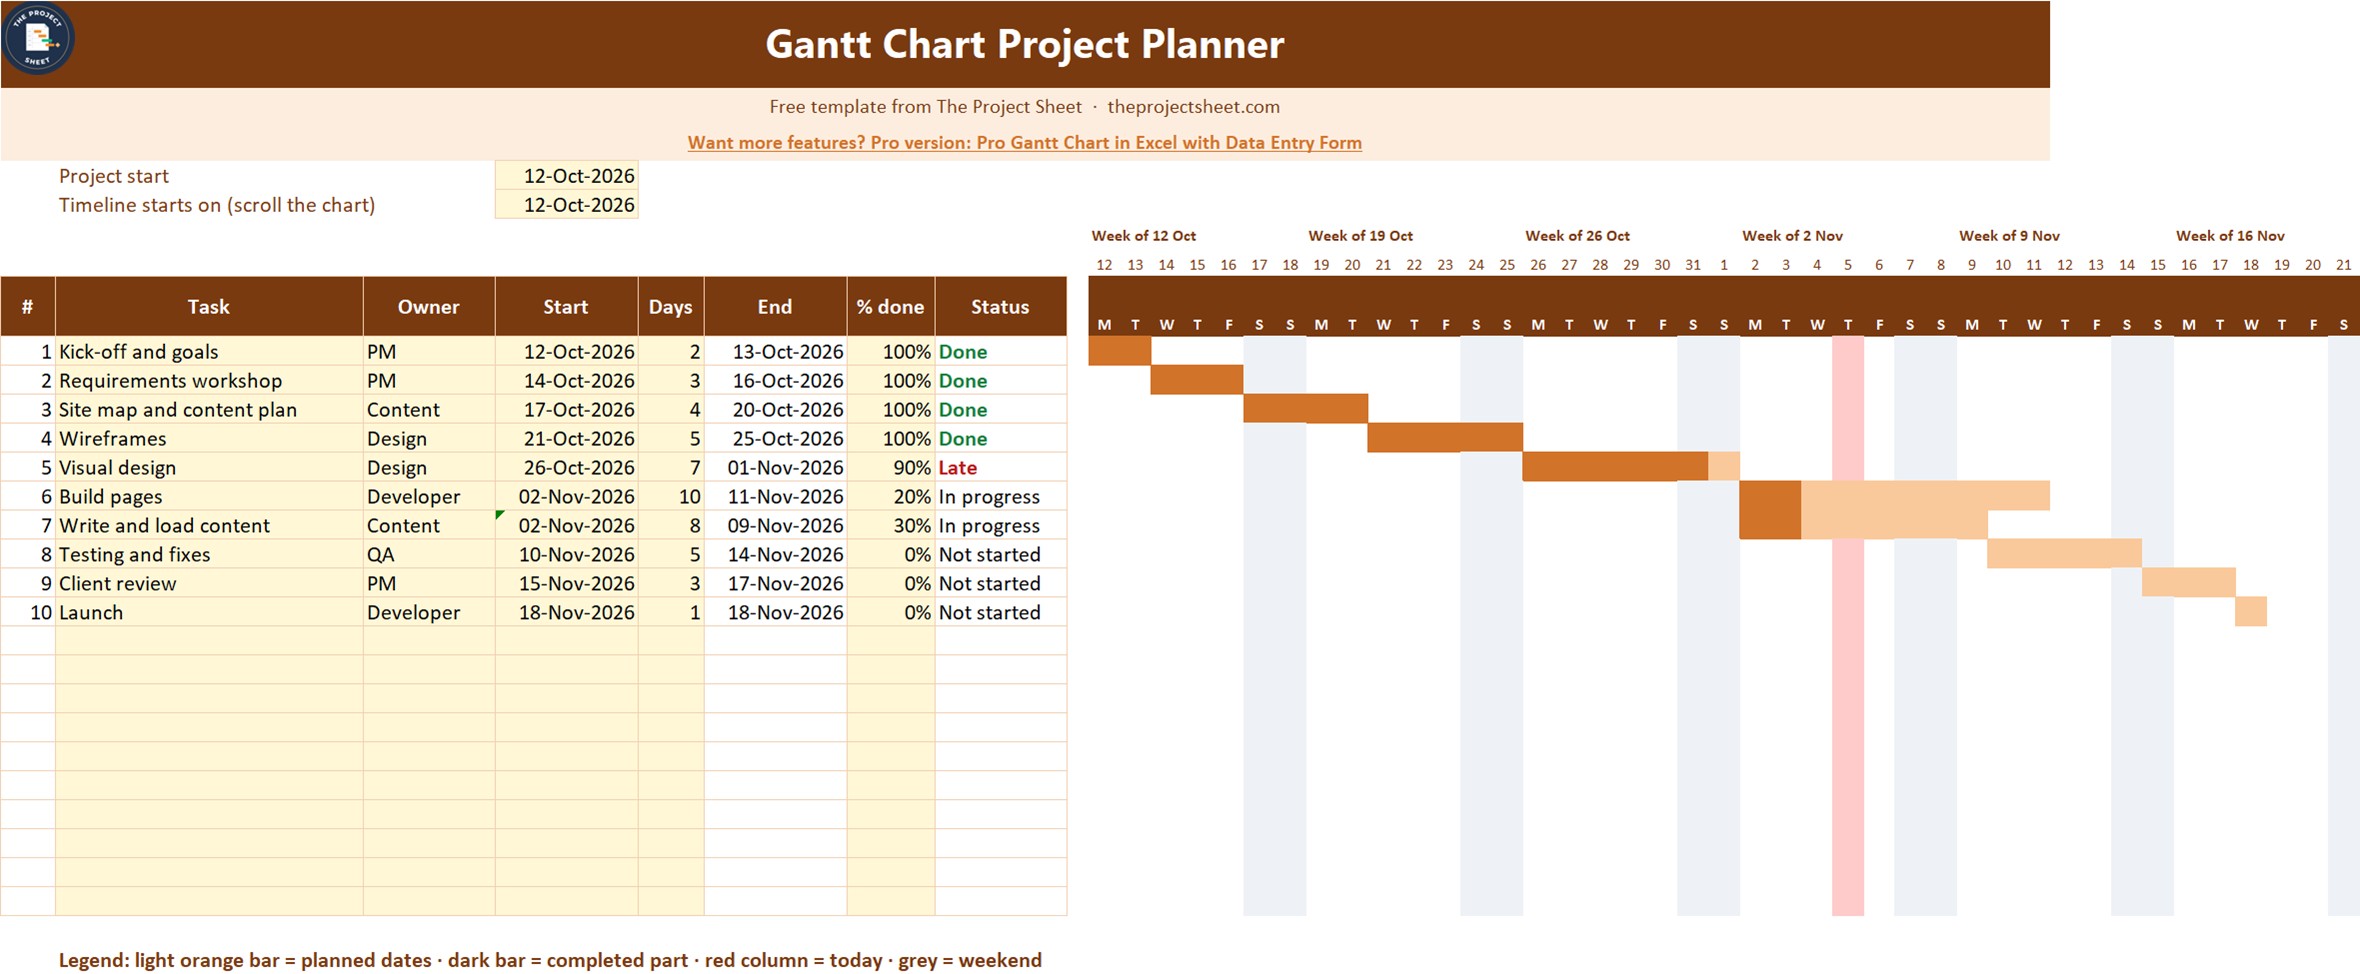

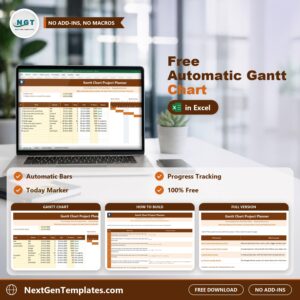
The Free Automatic Gantt Chart in Excel draws your project timeline for you. List your tasks with a start date, the number of days and the percent done, and the bars appear on a 9 week calendar, with the finished part of each bar in a darker color, today marked in red and weekends shaded grey. It uses plain Excel formulas and conditional formatting, so there are no add-ins, no macros and nothing to install.
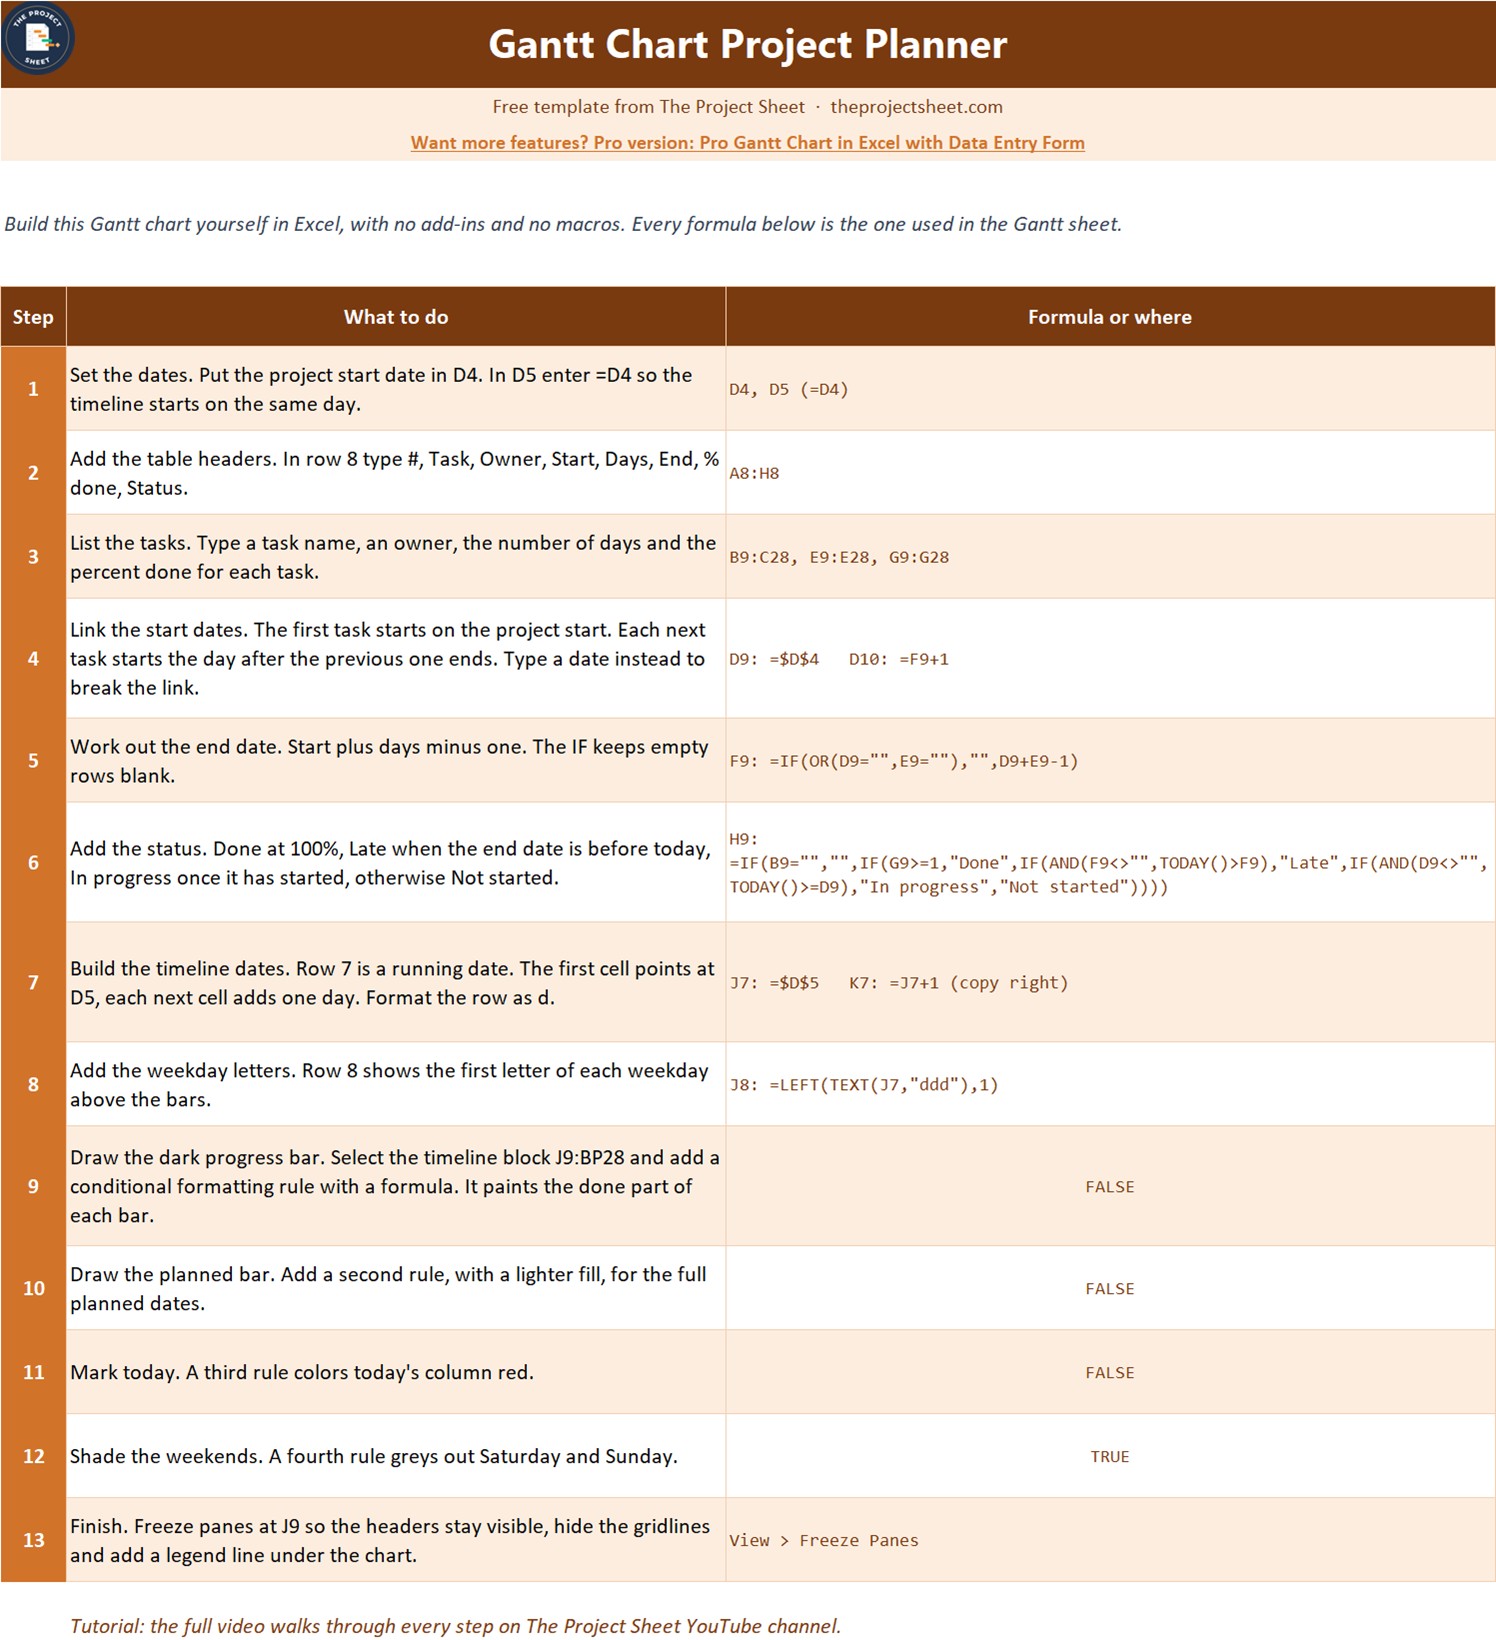
It is 100% free. It is the light version of our paid Gantt chart planners, and it comes with a How to Build sheet that shows every formula, so you can rebuild the chart from a blank workbook and learn how it works. Setup takes about two minutes: set the project start date, replace the sample tasks with yours and the chart redraws itself.
Free download | Works in any recent Excel | No add-ins or macros | Copy it for every project
Key features of the free Gantt chart
- Bars that draw themselves. The timeline reads each task start date and duration and shades the matching days. Change a date or a duration and the bar moves at once.
- Progress shown on the bar. The percent done column colors the completed part of each bar in a darker shade, so you see how far along a task is without reading numbers.
- Automatic end date. The end date is calculated from the start date and the number of days, so you only type two things per task.
- Status that updates by itself. Each task shows Not started, In progress, Late or Done. The status uses TODAY(), so it changes every morning without you touching it.
- Today marker and weekend shading. The current day is a red column through the chart and weekends are shaded grey, which makes delays and weekends easy to spot.
- Linked start dates. In the sample, each task starts the day after the previous one finishes. Type a date to break the link whenever tasks run in parallel.
- 20 task rows and a 9 week timeline. Change the timeline start date in D5 to scroll the chart to any week.
What is inside the file
| Sheet | What it does |
|---|---|
| How to use | A short guide to the template and its yellow input cells |
| Gantt | The task table, the 9 week timeline and the bars |
| How to Build | The 13 steps and every formula, so you can rebuild the chart from a blank sheet |
| Get the Full Version | Links to the paid Gantt chart planners when you need more |
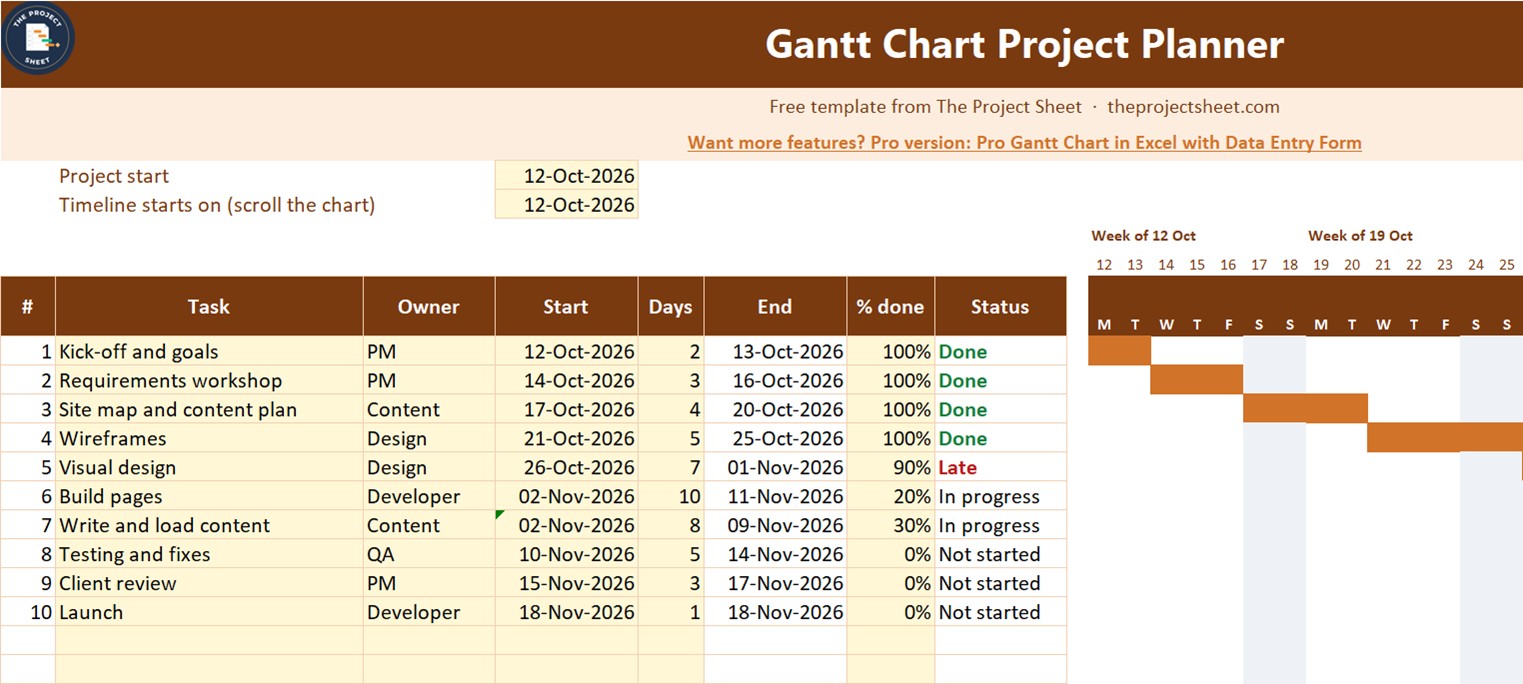
The sample is a ten task website project that starts on 12 October 2026. Some tasks are finished, one is late, two are in progress and three have not started, so you can see every status and color at once. Replace it with your own project.
How to use it in three steps
- Set the dates. Enter the project start date in D4. The timeline starts on the same day, and you can change D5 to scroll the chart.
- List your tasks. Type each task, its owner, the number of days and the percent done. The end date and the status fill in on their own.
- Read the chart. Dark bars show finished work, light bars show planned days and the red column shows today. Update the percent done each week.
Who this free Gantt chart is for
Project managers, team leads, freelancers, students and small business owners who need a clear project schedule without paying for project management software. It suits a website build, an event, a product launch, a renovation or any project with 20 tasks or fewer.
When it makes sense to upgrade
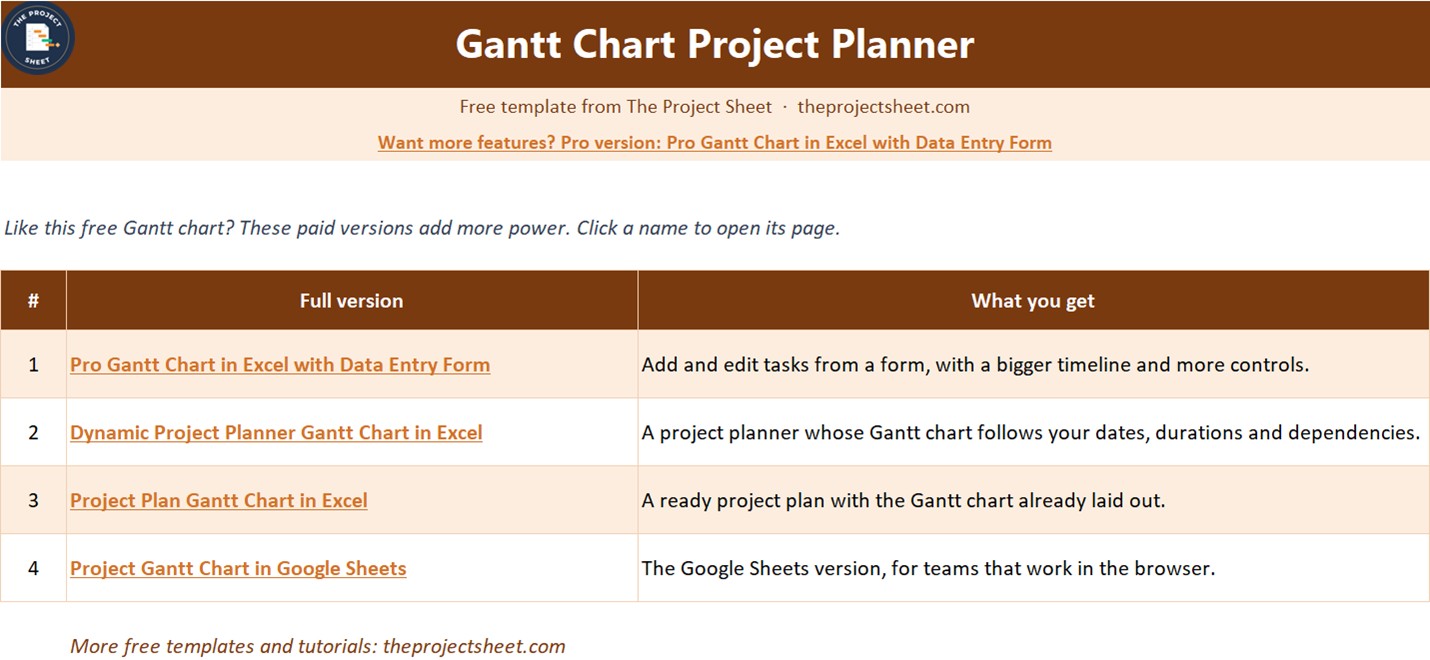
The free chart is built for one project and a short task list. If you need more, these paid files from NextGenTemplates go further:
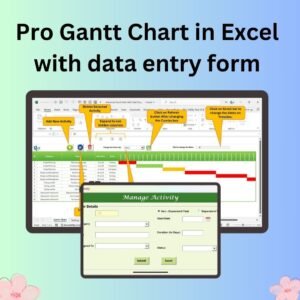
- Pro Gantt Chart in Excel with Data Entry Form to add and edit tasks from a form, with a bigger timeline and more controls.
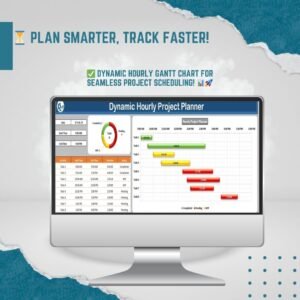
- Dynamic Project Planner Gantt Chart in Excel for a planner whose Gantt chart follows your dates and durations.
- Project Plan Gantt Chart in Excel for a ready project plan with the chart already laid out.
- Project Gantt Chart in Google Sheets if your team works in the browser.
Frequently asked questions
Is the Gantt chart template really free?
Yes. It costs nothing to download and you can copy it for every project.
Do I need add-ins or macros?
No. The chart uses normal formulas and conditional formatting, so it works in any recent version of Excel without add-ins or macros.
How many tasks can it hold?
The table has 20 task rows and the timeline shows 9 weeks. Change the timeline start date in D5 to move to a later week.
Why does a task show Late?
A task shows Late when its end date is before today and it is not 100% done. Update the percent done, or move the dates, and the status changes.
Can I build it myself?
Yes. The How to Build sheet lists all 13 steps with the exact formulas, so you can rebuild the chart from a blank workbook.










Reviews
There are no reviews yet.