
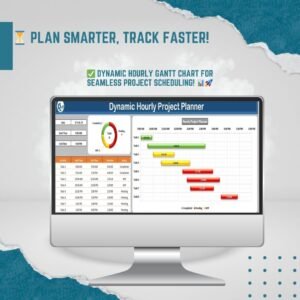
Managing projects effectively requires precise tracking, real-time updates, and a visually engaging tool to monitor task progress. The Dynamic Hourly Gantt Chart for Projects is an advanced project management tool designed to break down daily tasks at an hourly level, helping professionals and teams efficiently allocate resources, track status, and ensure seamless project execution.
Why Choose the Dynamic Hourly Gantt Chart?
This interactive Excel-based Gantt Chart is perfect for teams and individuals who need detailed scheduling for their projects. Whether you’re managing client tasks, tracking hourly operations, or scheduling multiple employees, this tool offers a structured approach to handling project activities while ensuring real-time tracking and visibility.

Key Features
1. Hourly Task Breakdown
Unlike traditional Gantt charts that focus on daily or weekly scheduling, this tool provides an hourly breakdown of project activities. This level of detail ensures that teams can efficiently allocate time slots for different tasks, improving productivity and minimizing scheduling conflicts.
2. Real-Time Status Updates
The Gantt chart dynamically updates task statuses based on input data, automatically categorizing tasks as:
✅ Completed – Successfully finished tasks displayed in green
⏳ Work in Progress (WIP) – Ongoing tasks represented in yellow
🛑 Pending – Unfinished tasks highlighted in red
This automated system ensures that project managers and team members have a clear view of project progress at all times.
3. Customizable Interface
Users can personalize fields such as:
- Activity Name
- Start & End Time
- Duration of Task
- Task Status
The flexible structure allows organizations to adapt the chart to their specific workflow, making it suitable for various industries, including IT development, construction, event planning, and corporate management.
4. Enhanced Visualization
With an interactive hourly timeline, this tool makes it easy to:
📊 Identify overlapping tasks and dependencies
⏳ Adjust schedules efficiently in response to unexpected delays
🚀 Communicate progress effectively with stakeholders
The clear, color-coded Gantt view simplifies complex schedules, ensuring that everyone stays on track with project deadlines.
5. Automatic Task Duration Calculation
The system automatically calculates task duration based on start and end times, reducing manual data entry errors and ensuring accuracy in time tracking.
6. Seamless Collaboration & Reporting
The Dynamic Hourly Gantt Chart enhances team collaboration by providing an intuitive project timeline that can be easily shared across teams.
📢 Benefits for Teams & Businesses:
✔ Improved task visibility and accountability
✔ Real-time tracking for project managers
✔ Enhanced resource allocation and prioritization
Who Can Use This?
This Excel-based hourly Gantt Chart is suitable for:
📌 Project Managers – Plan and allocate tasks efficiently
📌 Event Planners – Schedule every stage of an event by the hour
📌 Software Developers – Track coding and testing timelines
📌 Freelancers & Consultants – Manage multiple client projects with precision
📌 Construction Teams – Organize step-by-step site work schedules
Why This Gantt Chart is a Must-Have?
✅ Flexible & Easy to Use – No complex formulas or software required
✅ Visually Intuitive – Color-coded for quick decision-making
✅ Time-Saving – Automates calculations and tracking
Final Thoughts
The Dynamic Hourly Gantt Chart for Projects is an essential tool for professionals seeking an efficient way to plan, track, and manage hourly project tasks. With customizable fields, real-time updates, and automated duration calculations, this Gantt chart provides unparalleled control over project timelines, ensuring timely completion and optimized productivity.
🎯 Upgrade your project management with this powerful Gantt Chart today! 🚀
Click here to read the detailed blog post
Watch the step-by-step video tutorial:
Also check our Quality Analysis Dashboard in Power BI


Reviews
There are no reviews yet.