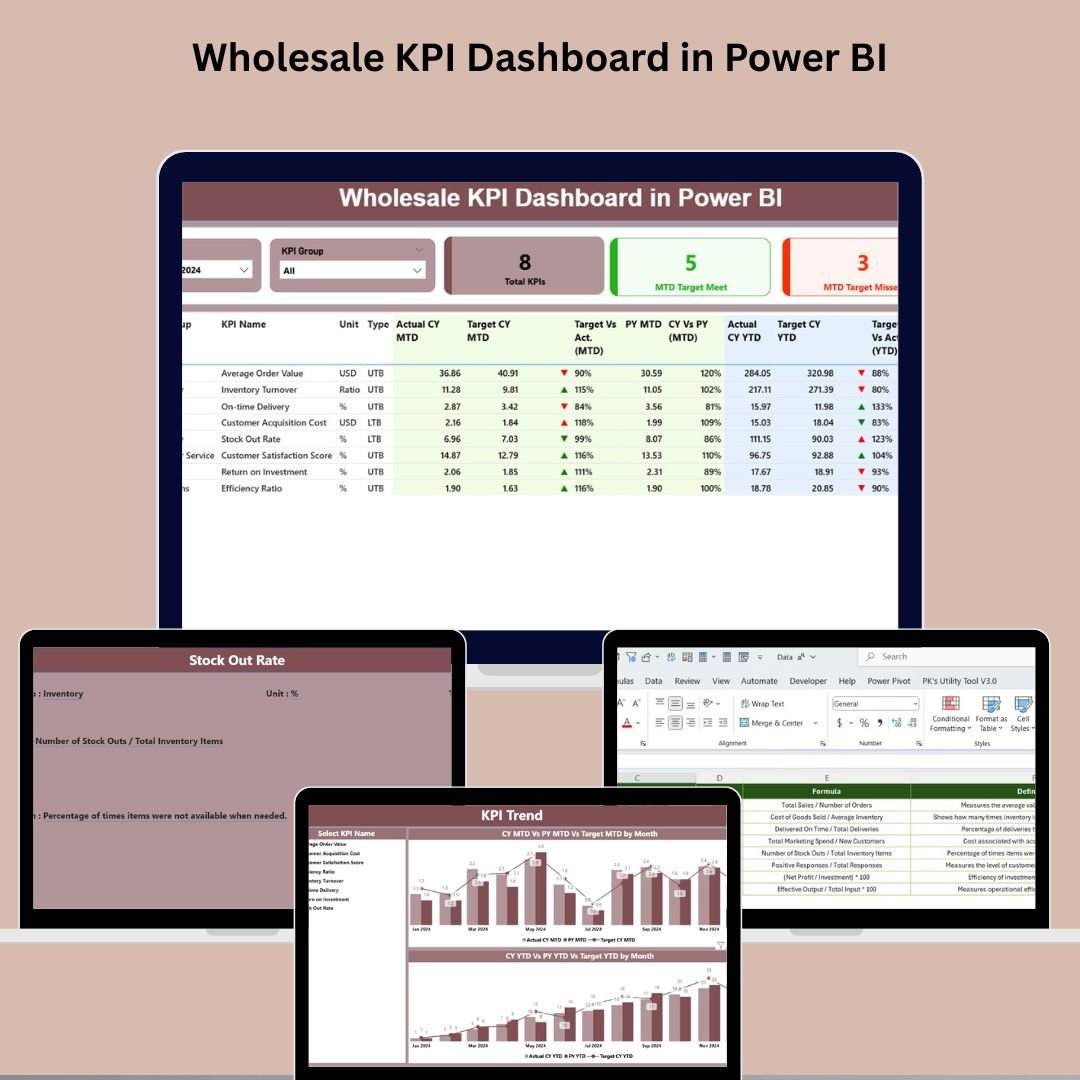
Managing KPIs in a fast-paced wholesale environment can be overwhelming—until now. Say hello to the Wholesale KPI Dashboard in Power BI, a fully interactive, Excel-integrated solution that empowers your team to visualize key metrics, monitor real-time performance, and make faster, smarter decisions—all in one place! 📊⚡
With three power-packed pages, intuitive slicers, KPI insights, and drill-through functionality, this dashboard is designed to streamline your operations and align your team on what truly matters: performance and growth.
✨ Key Features of Wholesale KPI Dashboard in Power BI
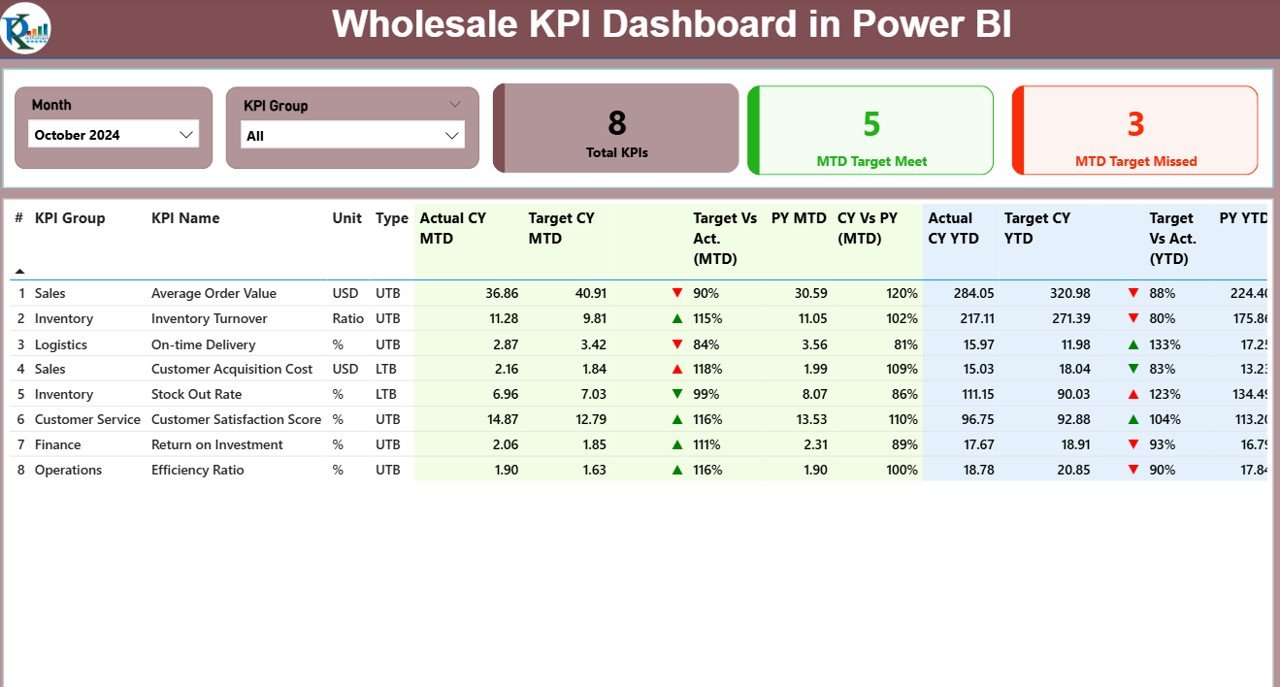
🔷 Executive Summary Page
-
Get a bird’s-eye view of all business KPIs at once
-
Slice data by Month and KPI Group
-
Visual indicators (✅/❌, ▲/▼ icons) help you understand performance at a glance
-
View MTD and YTD Actuals vs Targets along with Previous Year comparisons
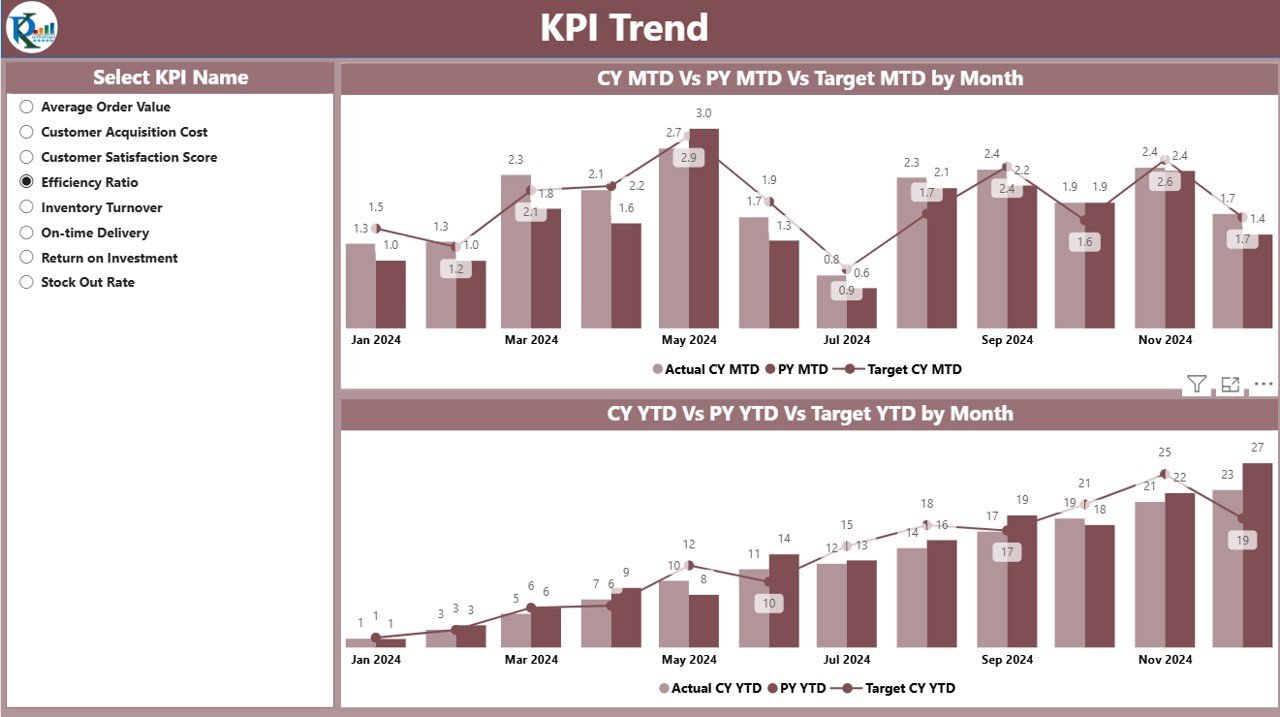
📈 KPI Trend Page
-
Track monthly performance trends using combo charts
-
Compare Actual vs Target vs Previous Year
-
Drill into specific KPIs to analyze fluctuations and improvements
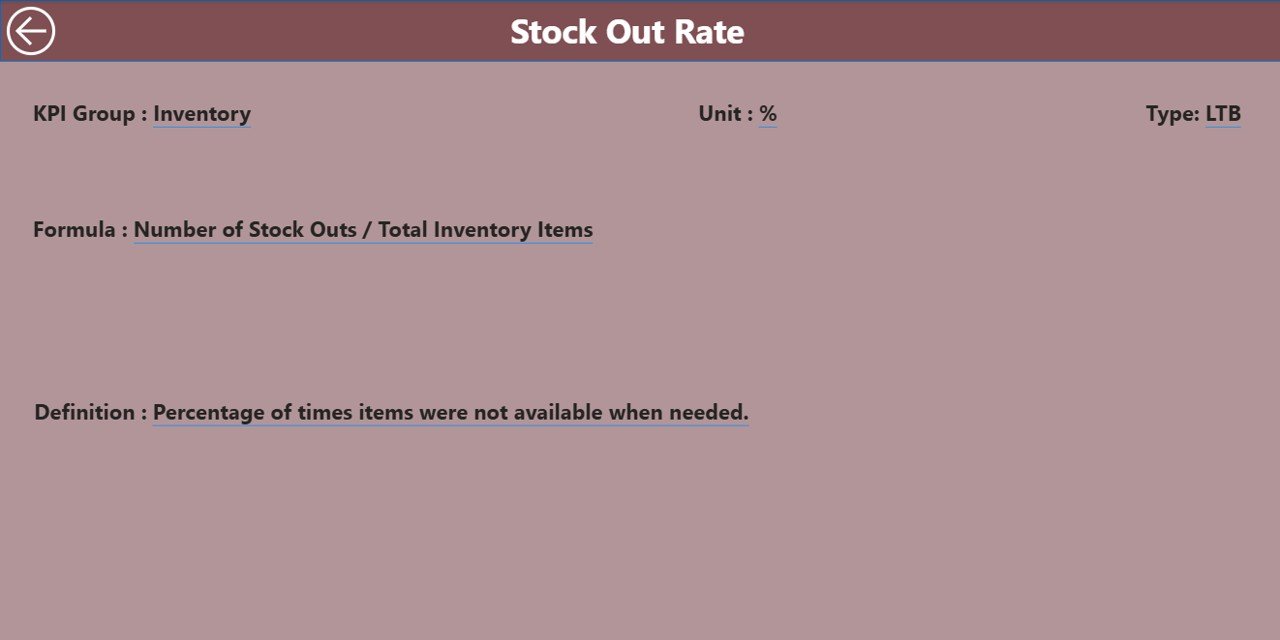
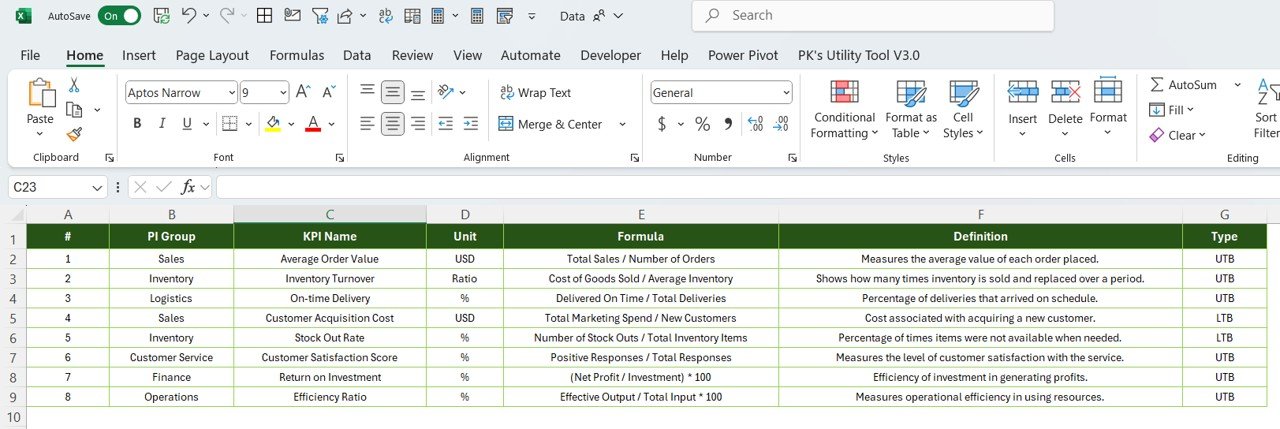
🧾 KPI Definition Drill-Through Page
-
Get formula, unit, type (UTB/LTB), and KPI definitions in one click
-
Ensure your team understands what they’re measuring and why
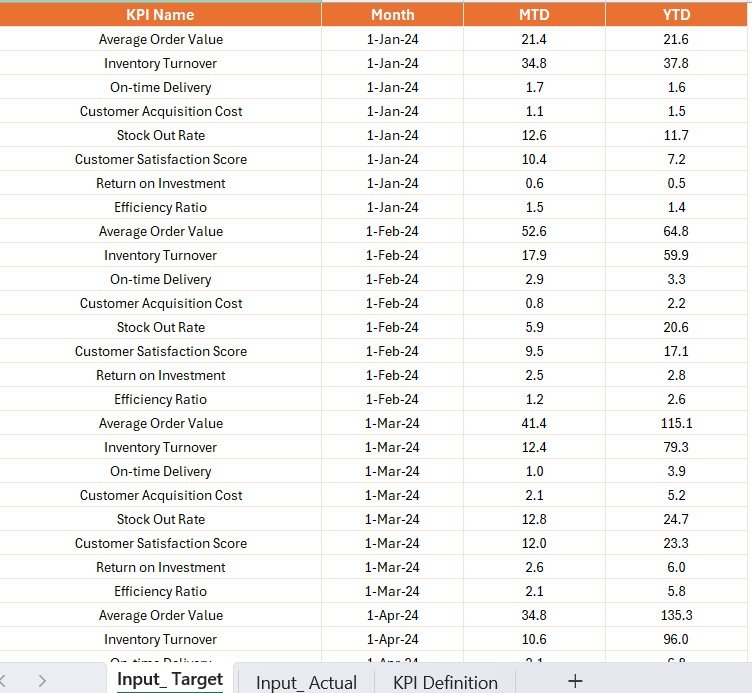
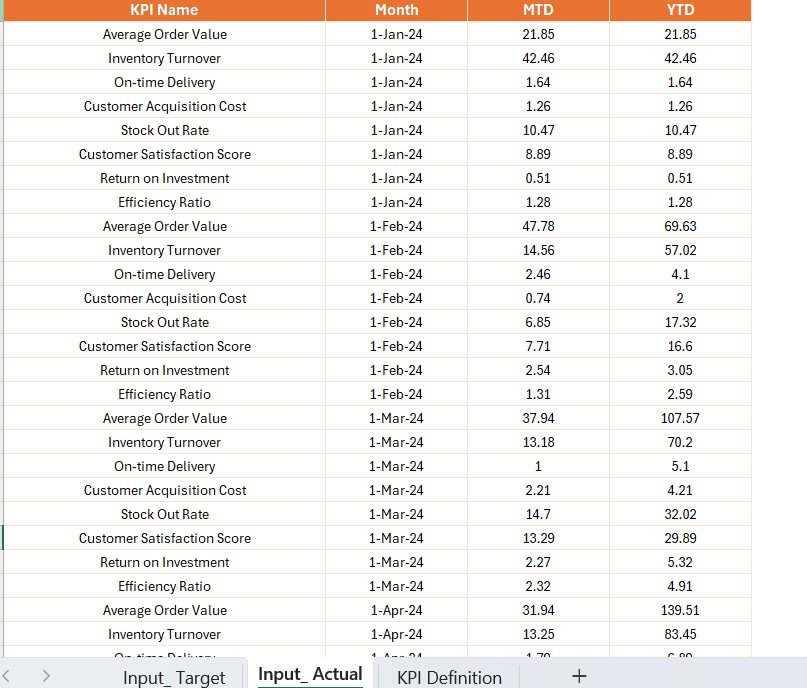
🔗 Excel Integration
-
Manage KPI Data in Excel: Actual, Target, and Definitions
-
Easy monthly updates—just refresh Power BI and go!
📦 What’s Inside the Wholesale KPI Dashboard
🧩 This dashboard includes:
-
✅ Prebuilt Power BI (.pbix) file
-
✅ Sample Excel data (Actual, Target, KPI Definitions)
-
✅ Three Pages: Summary, KPI Trend, and Drill-Through Definition
-
✅ Built-in icons and conditional formatting
-
✅ Slicers for Month and KPI Group
💡 Example KPIs you can track:
-
Inventory Turnover Rate
-
Order Fulfillment Time
-
Delivery Accuracy
-
Cost of Goods Sold
-
Profit Margin %
-
Sales by Category or Region
🛠️ How to Use the Wholesale KPI Dashboard
🔌 Step-by-Step Setup:
-
Open the Power BI dashboard file
-
Link your Excel data to the Power BI model
-
Click “Refresh” to update KPIs instantly
-
Use slicers to drill down by month or category
-
Right-click a KPI for deeper insights on the definition page
🧠 Pro Tip: Use this dashboard during monthly review meetings to keep your team aligned and performance-focused! 💼📍
👥 Who Can Benefit from This Dashboard
🎯 Sales Managers
Analyze revenue trends, product performance, and targets vs actuals.
🏬 Wholesale Operations Teams
Monitor delivery times, fulfillment rates, and supplier efficiency.
💰 Finance Professionals
Keep track of costs, margins, and profit trends over time.
📊 Executives & Business Owners
Make strategic decisions with confidence using real-time insights.
📦 SMEs & Large-Scale Wholesalers
Whether you’re running a local warehouse or a multi-location business, this dashboard will scale with you.
💡 Why Choose This Dashboard?
✅ No coding needed
✅ Fully editable in Power BI
✅ Simple Excel-based data structure
✅ Ready-to-use with real-world visuals
✅ Customizable for any business size
🔗 Click here to read the Detailed blog post
📺 Visit our YouTube channel to learn step-by-step video tutorials


Reviews
There are no reviews yet.