



Managing venture capital investments requires speed, clarity, and accurate insights. With multiple funding rounds, fast-changing valuations, unpredictable market trends, and hundreds of portfolio activities happening every month, investors need a powerful tool that simplifies decision-making. The Venture Capital Dashboard in Power BI provides everything in one place—turning complex venture capital data into simple, actionable, and visually rich insights. Whether you are tracking fund performance, partner efficiency, industry trends, or monthly growth patterns, this dashboard helps you evaluate risks and opportunities with confidence.
Built for modern VC firms, investment analysts, and fund managers, this dynamic dashboard brings real-time clarity to fast-moving investment environments. Instead of manually merging spreadsheets or verifying dozens of files, Power BI automates the entire process—making investment tracking effortless, accurate, and incredibly fast.
🚀 Key Features of the Venture Capital Dashboard in Power BI
The dashboard includes powerful features designed to help investors analyze performance from every possible angle.
📊 1. Complete Investment Overview

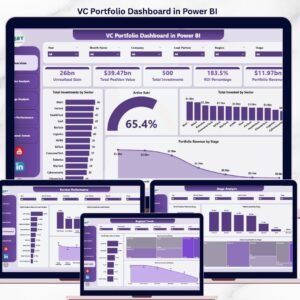
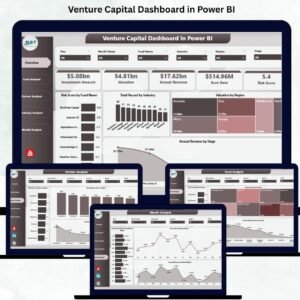
The Overview Page serves as your central command center. With intelligent slicers for fund type, industry, and region, investors can instantly switch between portfolios. The page also displays four essential KPIs:
Total Funds
Total Portfolio Companies
Average Risk Score
Total Annual Revenue
These KPIs deliver a quick health check of your entire investment ecosystem.
📈 2. Smart Visual Insights
The dashboard includes four major charts to help investors compare major performance indicators:
Risk Score by Fund Type
Total Records by Industry
Valuation by Region
Annual Revenue by Stage
These visuals reveal diversification levels, regional strength, industry exposure, and revenue patterns.
📁 3. Deep Fund-Level Analysis
The Fund Analysis page helps investors compare the performance of individual funds. With charts for ESG score, valuation, and annual revenue, users can identify which funds drive growth and which need attention.
🤝 4. Partner Performance Evaluation
The Partner Analysis page shows how each partner contributes to portfolio success. View:
Risk Score by Partner Name
Burn Rate by Partner Name
Annual Revenue by Partner Name
This allows leadership teams to reward strong performers and coach others more effectively.
🏭 5. Industry-Wise Comparison
Every industry behaves differently—some burn cash quickly, while others generate strong recurring revenue. This page highlights:
Risk Score by Industry
Burn Rate by Industry
Annual Revenue by Industry
This helps VC firms diversify and balance risk across sectors.
📅 6. Monthly Performance Tracking
Track how portfolio companies perform month after month with key visuals:
Investment Amount by Month
Burn Rate by Month
Annual Revenue by Month
These charts support forecasting and strategic planning.
📦 What’s Inside the Venture Capital Dashboard in Power BI
This product includes a fully structured Power BI solution built on real-time visuals and clean data architecture.
📄 Data Input Sheets
The dashboard connects to structured datasets containing:
Investment Amount
Valuation
Risk Score
Burn Rate
ESG Score
Revenue
Industry, Partner, Region & Fund Type Details
These data sheets form the backbone of the dashboard.
🧩 Dynamic Slicers
Filter your insights instantly by:
Fund Type
Industry
Region
Partner
Investment Stage
Month or Year
This helps investors deep-dive into any segment.
📚 KPI Definitions & Metrics
Every KPI used in the dashboard is clearly defined to help all investors, analysts, and partners interpret results consistently.
🛠️ How to Use the Venture Capital Dashboard in Power BI
Using this dashboard is simple and fast:
1️⃣ Load or Update Your Dataset
Add the latest valuation, investment, and revenue data into your data source.
2️⃣ Refresh the Dashboard
Click the Refresh button to update all visuals instantly with new numbers.
3️⃣ Explore the Overview Page
Start with the high-level KPIs and key charts to understand portfolio health.
4️⃣ Analyze Funds & Partners
Dive into fund-level and partner-level performance to identify strong and weak areas.
5️⃣ Compare Industries
See which industries are growing, which are risky, and which sectors burn cash fastest.
6️⃣ Review Monthly Trends
Use the Monthly Trends page to understand seasonality and investment patterns.
7️⃣ Share Reports Easily
Export visuals or share via Power BI service for stakeholder reporting.
👥 Who Can Benefit from This Venture Capital Dashboard
This dashboard is built for professionals who need clarity in investment performance:
💼 Venture Capital Firms
Track returns, fund performance, and partner efficiency effortlessly.
📊 Investment Analysts
Analyze trends, compare sectors, and identify investment opportunities.
🏢 Startup Accelerators & Incubators
Monitor portfolio startup health and risk exposure.
🤝 Private Equity Teams
Evaluate fund value, growth trends, and partner-level insights.
💰 Fund Managers
Make informed decisions based on real-time financial indicators.
By using this dashboard consistently, firms strengthen their investment strategies, reduce risks, and improve overall financial planning.
### Click here to read the Detailed blog post
Visit our YouTube channel to learn step-by-step video tutorials
👉 Youtube.com/@PKAnExcelExpert








Reviews
There are no reviews yet.