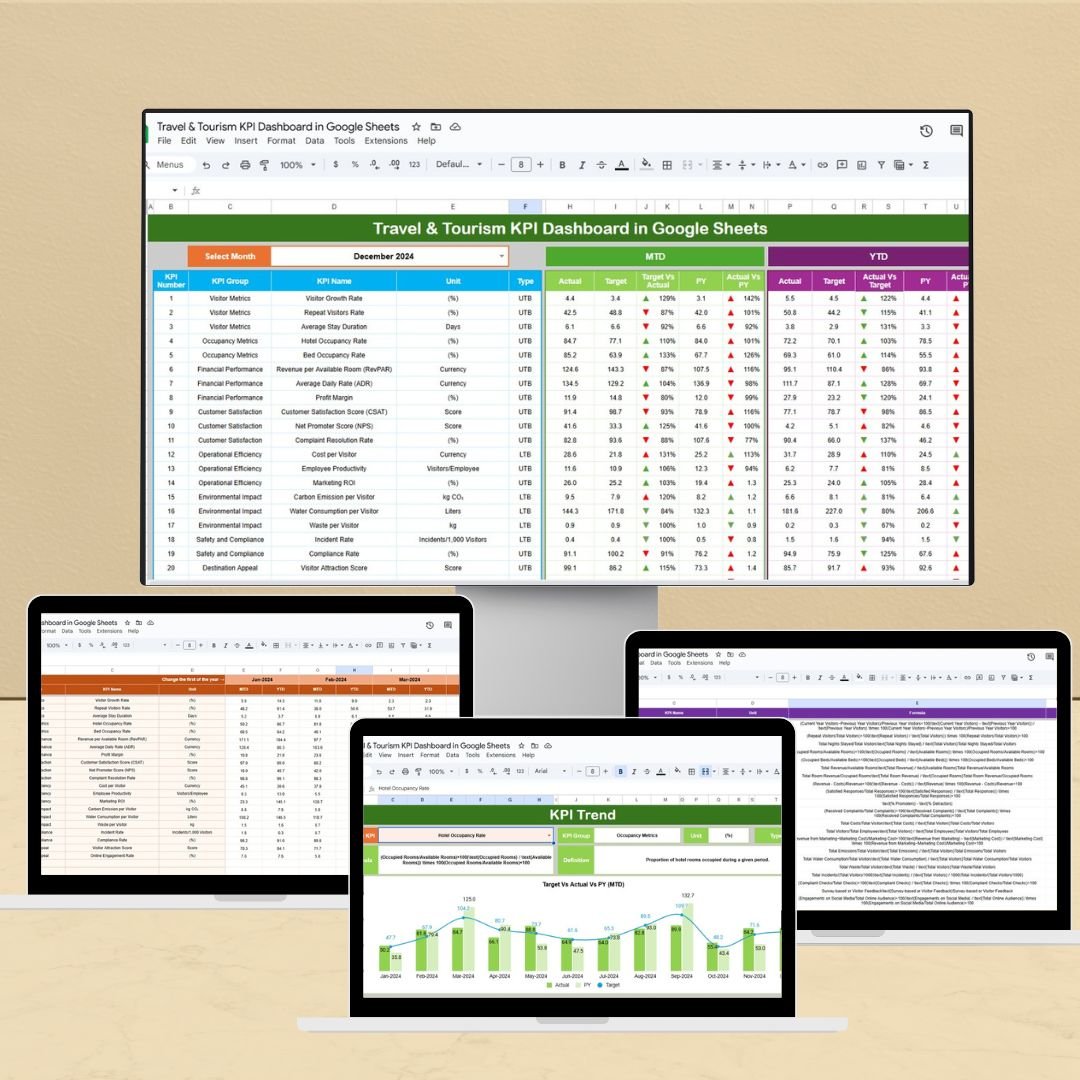
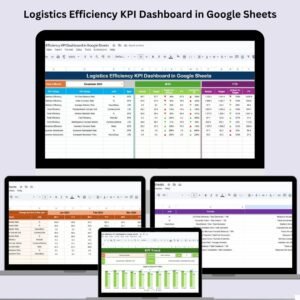
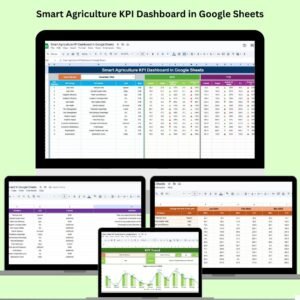
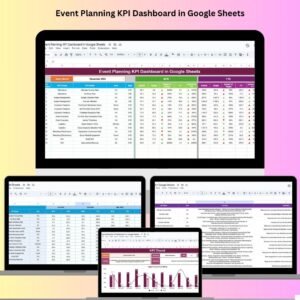
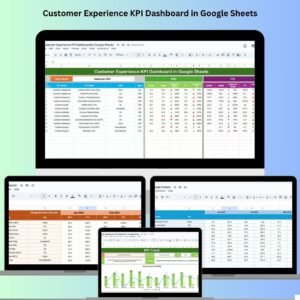
The Travel & Tourism KPI Dashboard in Google Sheets is a comprehensive and user-friendly tool designed to help travel agencies, tour operators, and hospitality businesses monitor and optimize their performance. This dashboard provides a centralized platform to track key performance indicators (KPIs) such as booking trends, revenue per available room (RevPAR), customer satisfaction scores, and seasonal demand fluctuations.
Built within the versatile Google Sheets environment, this dashboard offers real-time data visualization, automated calculations, and customizable templates to suit your specific textile industry needs.
Key Features:
-
Real-Time Data Integration: Seamlessly integrate data from various sources to ensure up-to-date information at your fingertips.
-
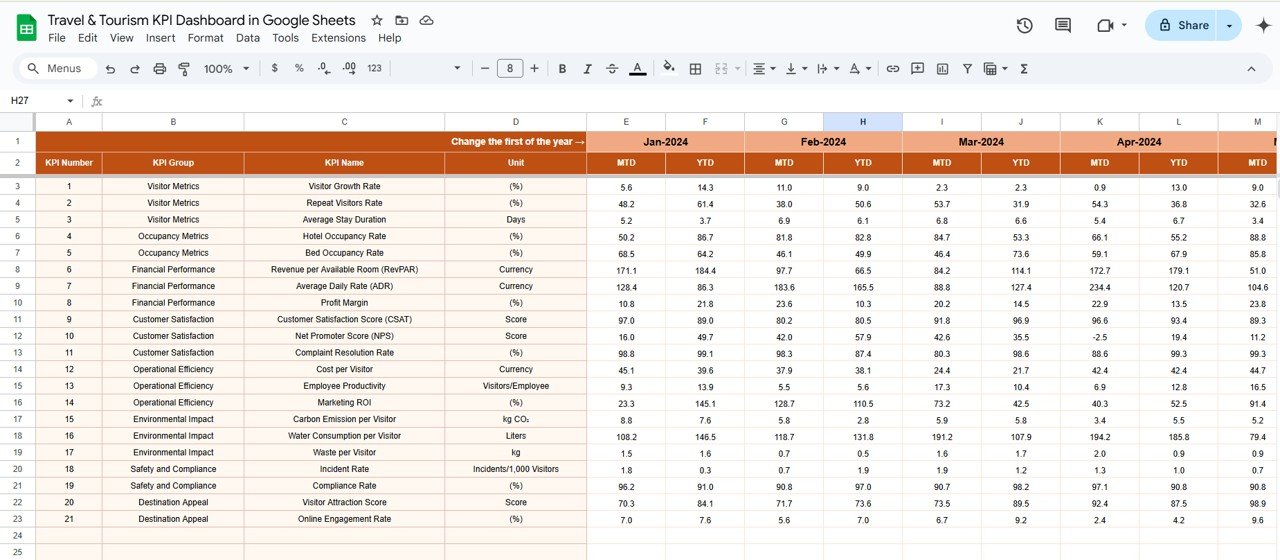
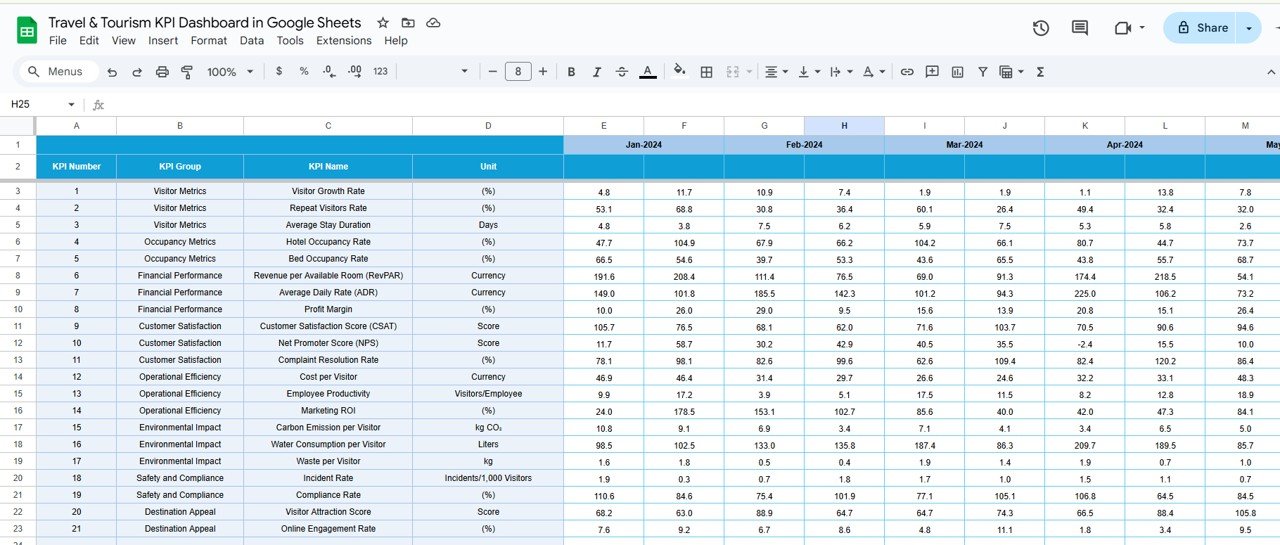
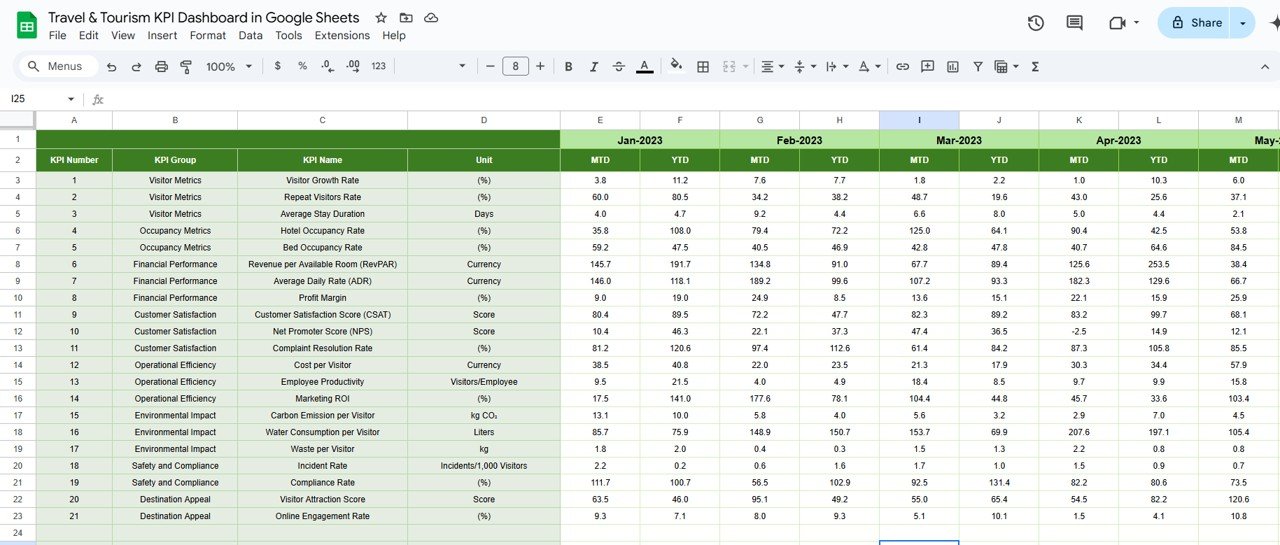
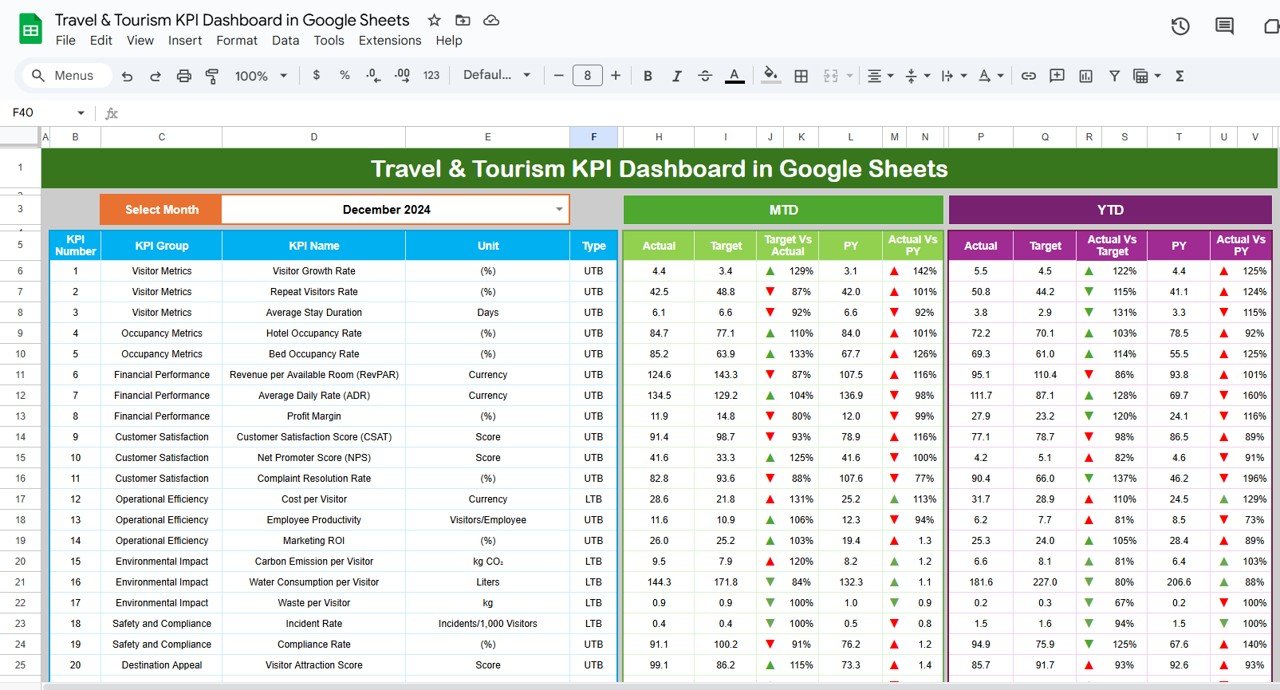
Customizable KPIs: Tailor the dashboard to track the metrics that matter most to your organization, such as occupancy rates, average daily rates (ADR), and customer feedback.
-
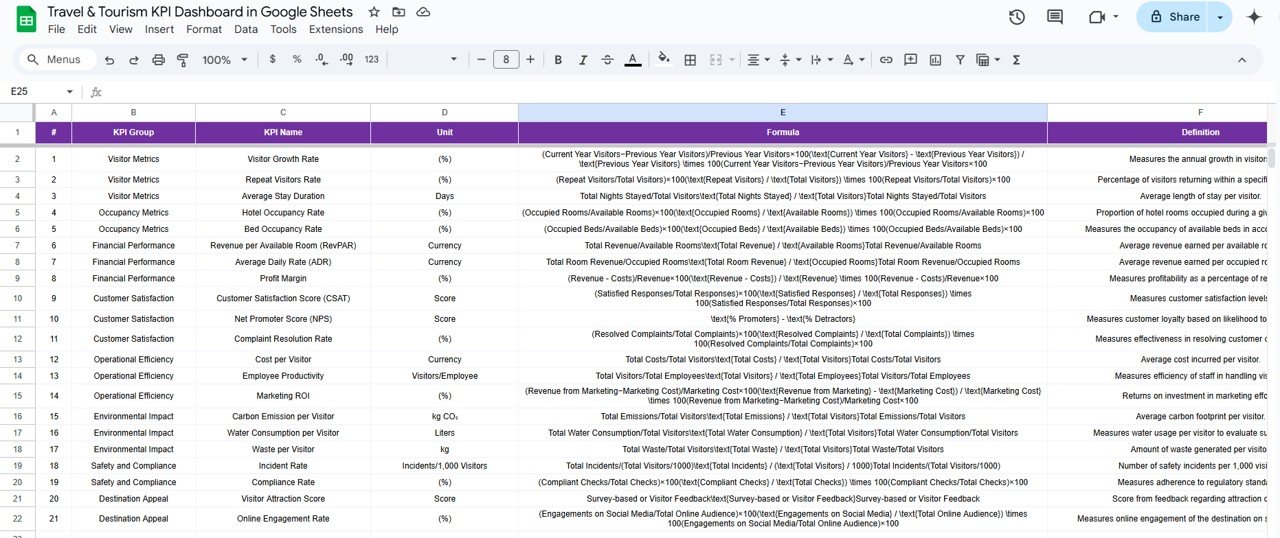
Automated Calculations: Utilize built-in formulas to automatically calculate averages, percentages, and trends, reducing manual effort and minimizing errors.
-
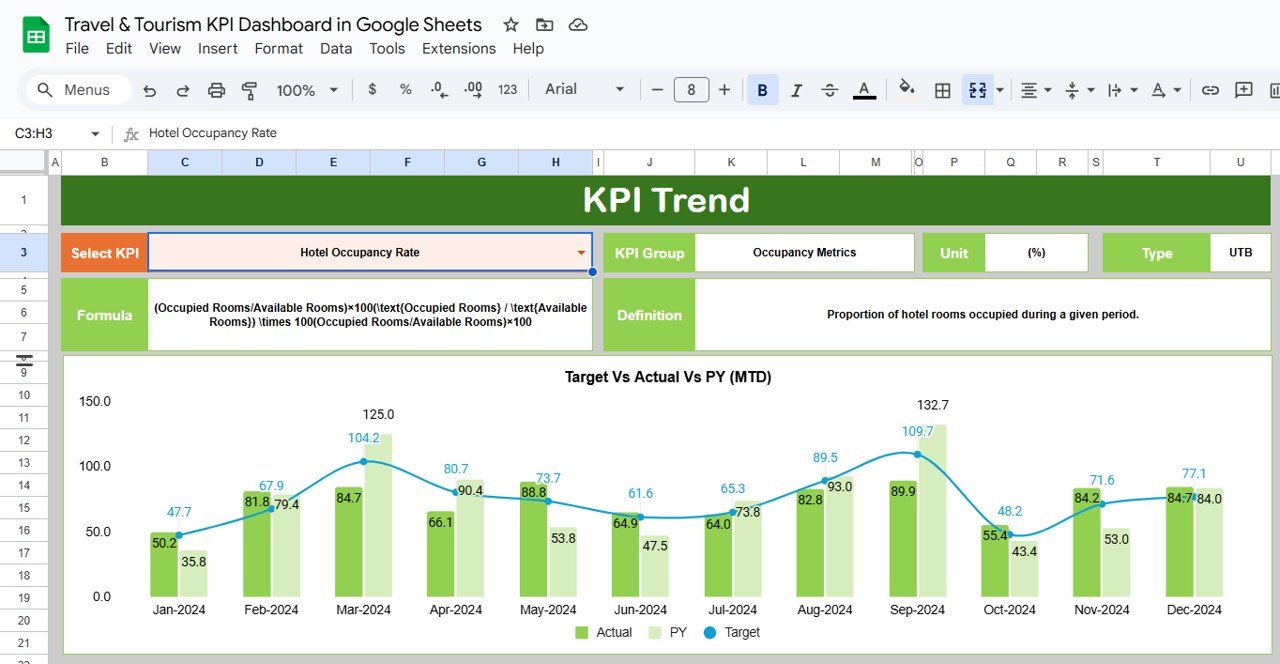
Visual Dashboards: Leverage charts and graphs to visualize performance trends, making it easier to identify areas for improvement.
-
User-Friendly Interface: Navigate through the dashboard with ease, thanks to its intuitive design and clear layout.
Benefits:
-
Enhanced Decision-Making: Access to real-time data and visual insights empowers stakeholders to make informed decisions promptly.
-
Improved Efficiency: Automated processes and centralized data reduce the time spent on manual reporting and analysis.
-
Scalability: As your operations grow, the dashboard can be easily updated to accommodate new KPIs and data sources.
-
Cost-Effective: Utilize the free and widely accessible Google Sheets platform, eliminating the need for expensive software solutions.
How to Use:
-
Download the Template: Access the Google Sheets template provided.
-
Input Data: Enter your travel and tourism data into the designated fields.
-
Customize KPIs: Adjust the dashboard to reflect the KPIs relevant to your operations.
-
Analyze Trends: Use the visual tools to identify performance trends and areas needing attention.
-
Make Informed Decisions: Leverage the insights gained to optimize your business strategies.
Who Can Benefit:
-
Travel Agencies: Monitor booking trends and customer satisfaction.
-
Tour Operators: Track performance across different packages and destinations.
-
Hospitality Businesses: Analyze occupancy rates and revenue metrics.
-
Business Analysts: Evaluate data to support strategic decision-making.
By implementing the Travel & Tourism KPI Dashboard in Google Sheets, organizations can gain a comprehensive view of their performance, leading to more informed decisions and improved operational efficiency.
Click here to read the Detailed blog post
Visit our YouTube channel to learn step-by-step video tutorials
Youtube.com/@PKAnExcelExpert


Reviews
There are no reviews yet.