

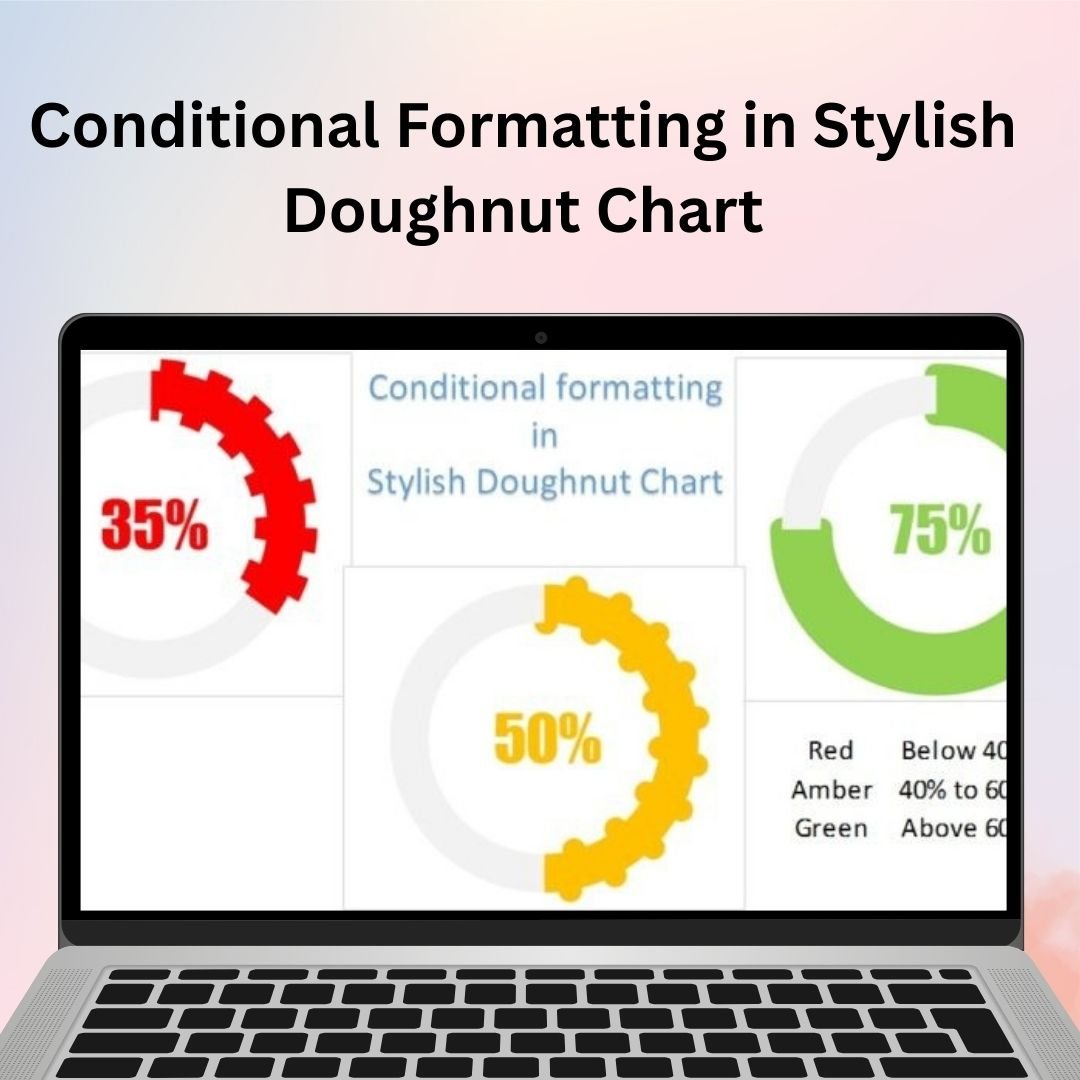

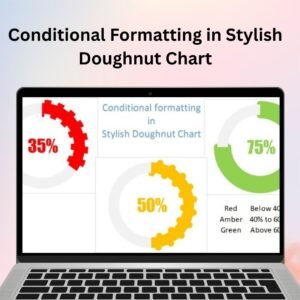
The Conditional Formatting in Stylish Doughnut Chart is a unique and visually appealing Excel tool designed to help you display key performance indicators (KPIs) with dynamic and eye-catching charts. Whether you’re managing sales performance, project progress, or any other metric, this chart allows you to visually represent your data with stylish doughnut charts that update automatically based on the conditions you set.
This advanced Excel tool uses conditional formatting to change the color and style of the doughnut chart based on specific data conditions. It makes it easy to create dashboards that highlight performance variations, track progress, and instantly identify areas that need attention—all in a visually engaging way.
Key Features of the Conditional Formatting in Stylish Doughnut Chart:
🎨 Stylish Doughnut Chart Design
The doughnut chart provides a visually appealing and modern way to represent your data. With a clear, circular design, it’s perfect for showing performance, completion rates, and other metrics in a visually pleasing and easy-to-understand format.
⚙️ Dynamic Conditional Formatting
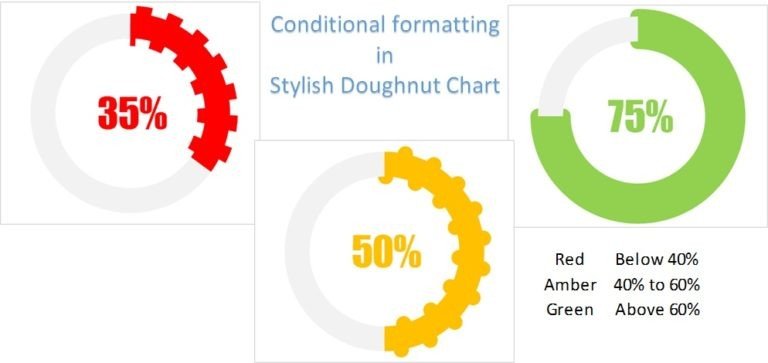
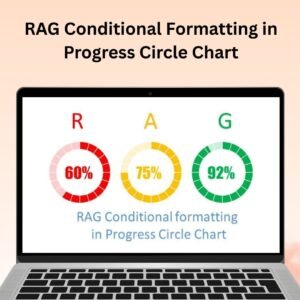
Automatically change the chart’s colors and styles based on the data values. For example, if a KPI is on track, the chart could be green, while an underperforming KPI could turn red. This dynamic formatting helps to easily identify areas of success and areas needing attention.
📊 Multi-Indicator Tracking
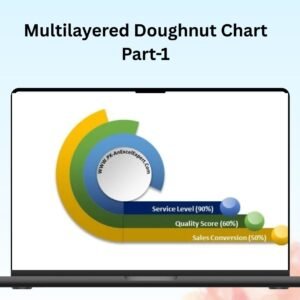
Track multiple KPIs in a single doughnut chart. You can input data for various categories, such as sales, project progress, customer satisfaction, and more, and display them in a single, consolidated chart.
🔄 Real-Time Data Updates
As you input new data, the chart automatically updates itself, making it easy to track performance in real time. The chart adjusts based on the data input, providing an accurate and up-to-date visualization of your KPIs.
⚙️ Customizable Design
Customize the doughnut chart’s appearance to suit your brand or presentation needs. Adjust the colors, design elements, and conditional formatting rules to ensure that the chart reflects your specific preferences and requirements.
Why You’ll Love This Stylish Doughnut Chart:
✅ Visually Engaging and Easy to Understand – The stylish doughnut chart design makes it easy to visually track and present performance data. ✅ Dynamic and Interactive – The chart automatically adjusts to your data inputs and updates in real time, providing an interactive and engaging way to track performance. ✅ Saves Time – No need for manual updates or formatting—everything updates automatically based on the conditions you set. ✅ Highlights Key Insights – With color-changing formatting, you can easily identify performance trends and areas that require attention. ✅ Perfect for Presentations – Its modern, clean, and professional design makes it ideal for business presentations, reports, or dashboards.
What’s Inside the Conditional Formatting in Stylish Doughnut Chart:
- Interactive Doughnut Chart – A modern design that provides a clear visual representation of performance data.
- Conditional Formatting Rules – Automatically adjust the chart’s appearance based on your data values.
- Multiple KPI Tracking – Track several performance indicators in one chart for comprehensive analysis.
- Real-Time Updates – See immediate changes when data is entered, keeping the chart up to date.
- Customizable Features – Adjust the chart’s colors, appearance, and formatting to meet your specific needs.
How to Use the Stylish Doughnut Chart:
1️⃣ Download the Template – Get access to your Excel file immediately after purchase. 2️⃣ Input Your Data – Add your KPIs and relevant data into the designated fields. 3️⃣ Monitor Performance – Watch the doughnut chart update automatically based on your data input. 4️⃣ Customize the Chart – Adjust the design, colors, and conditional formatting to suit your style and needs.
Who Can Benefit from the Conditional Formatting in Stylish Doughnut Chart?
- Business Owners and Managers
- Project Managers
- Sales Teams and Analysts
- Marketing Teams
- HR and Operations Managers
- Data Analysts
- Anyone tracking KPIs or performance metrics
With this stylish and dynamic doughnut chart, you’ll be able to monitor and present your key performance indicators in a visually appealing and insightful way, helping you make data-driven decisions.
Click here to read the Detailed blog post
https://www.pk-anexcelexpert.com/conditional-formatting-in-stylish-doughnut-chart/
Visit our YouTube channel to learn step-by-step video tutorials
Watch the step-by-step video tutorial:
Compatibility and Requirements
- Works in Microsoft Excel desktop (Excel 2016 or later, or Microsoft 365).
- The chart uses conditional formatting rules. Microsoft explains the feature in Use conditional formatting to highlight information.
Frequently Asked Questions
What does the chart show?
Performance data in a doughnut chart whose look changes with your data values through conditional formatting rules.
Can I track more than one KPI?
Yes. You can track several KPIs in one chart.
Does it update when I enter data?
Yes. The chart updates as soon as you enter data.
Can I change the colors?
Yes. You can adjust the colors, design and formatting.
Related Doughnut and KPI Charts
- Stylish Doughnut Charts in Excel: more doughnut chart designs
- Multilayered Doughnut Chart (Part 2): a doughnut chart with several layers
- Half Circle KPI Charts in Excel using Doughnut Charts: half circle KPI charts built from doughnuts
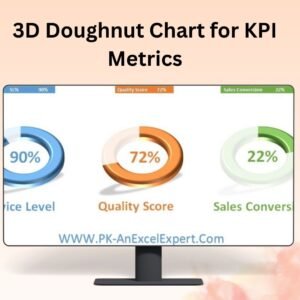
- 3D Doughnut Chart for KPI Metrics: a 3D doughnut for KPI metrics
- Data Analyst’s Chart & Visualization Pack: 10 chart and visualization templates for Excel and Google Sheets
Browse all Excel charts and visualizations.







Reviews
There are no reviews yet.