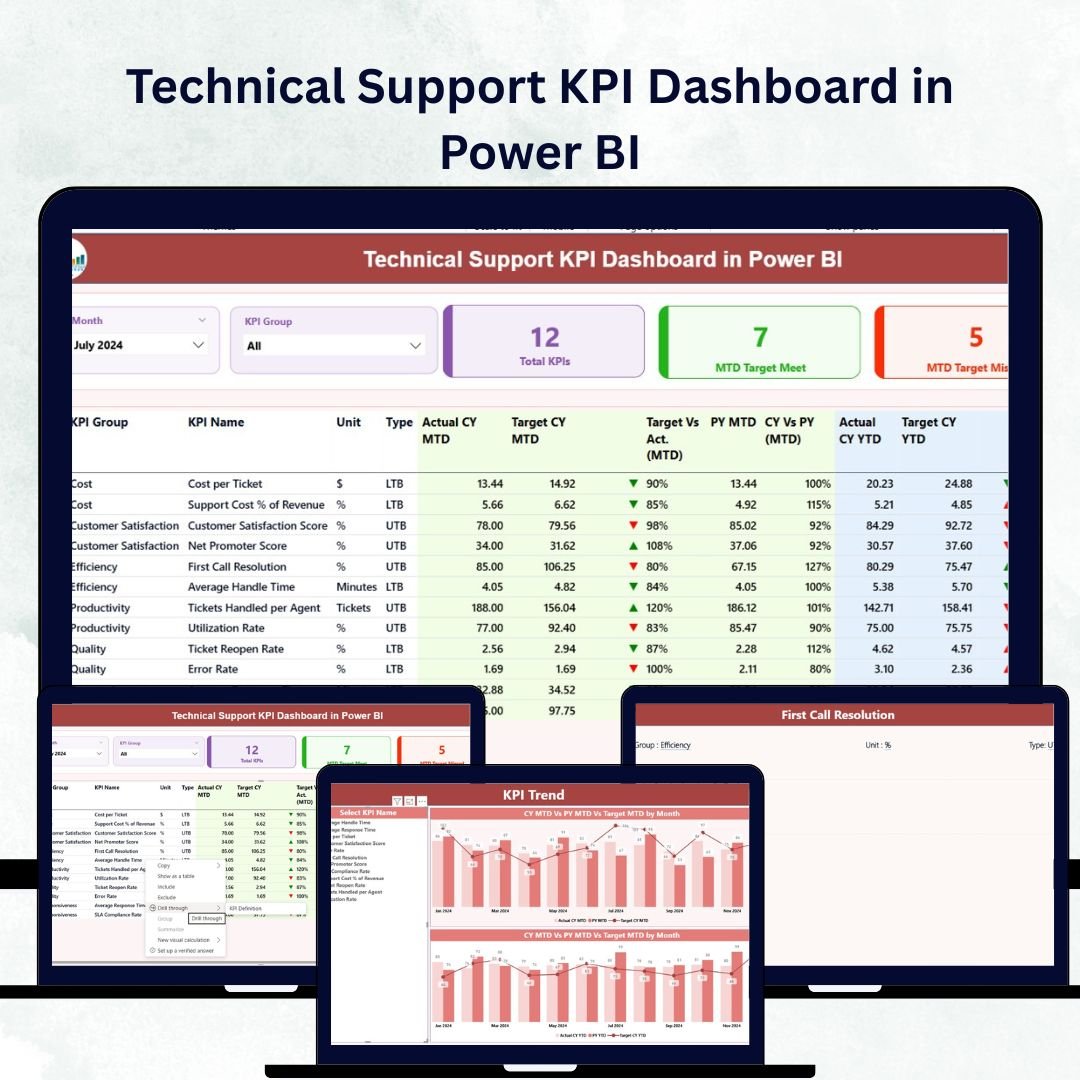
In the fast-paced world of digital operations, maintaining an efficient and reliable technical support system is essential for customer satisfaction and service excellence. The Technical Support KPI Dashboard in Power BI is your all-in-one solution to visualize performance, identify service gaps, and drive actionable insights — without complex setup or coding.
With this ready-to-use Power BI dashboard, support teams can track every important KPI — from ticket resolution rates to customer satisfaction scores — in one place. Whether you manage an IT helpdesk or global tech operations, this dashboard turns your data into clear visuals for smarter, faster decisions.
✨ Key Features of Technical Support KPI Dashboard in Power BI
⚡ 3 Interactive Pages:
Navigate between Summary, Trend, and Definition pages to explore performance metrics from every angle.
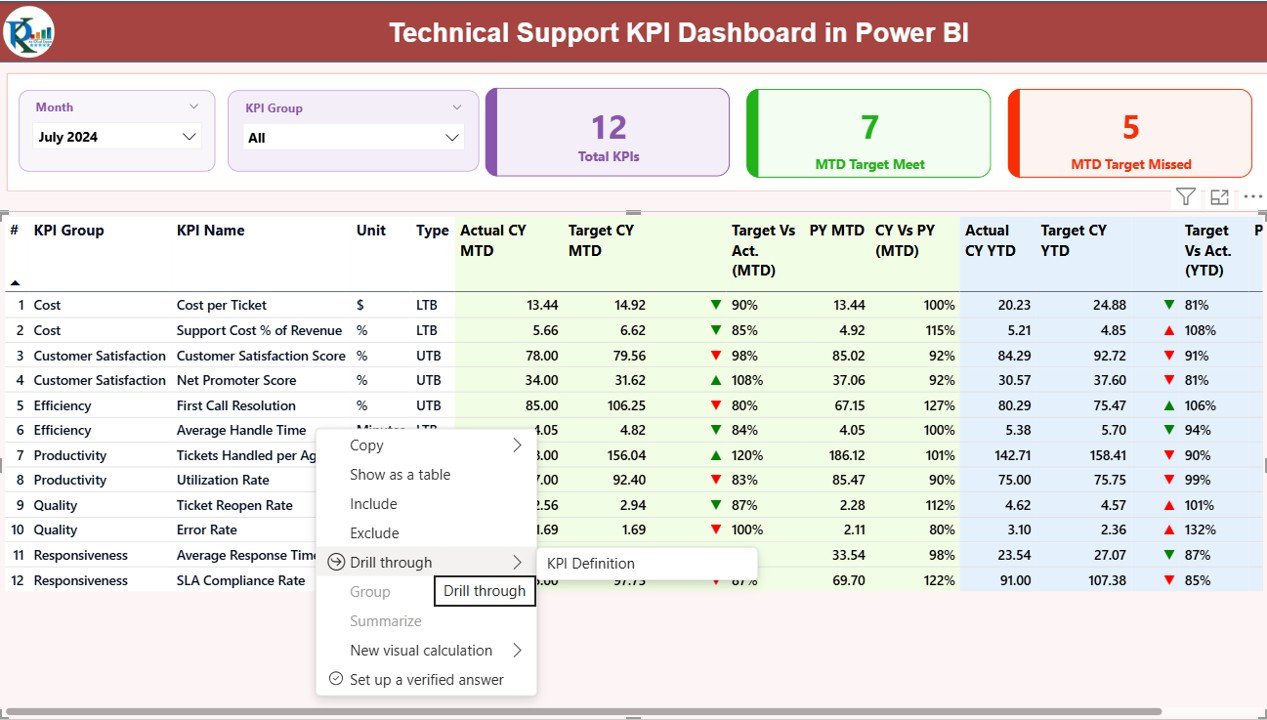
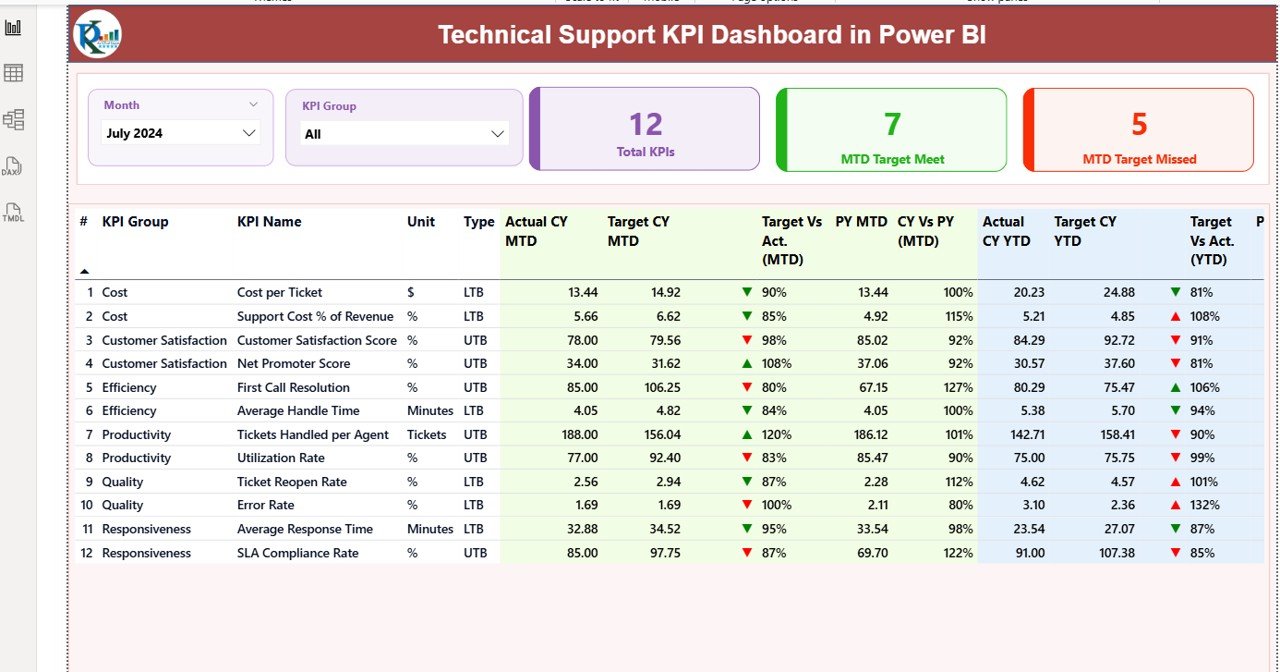
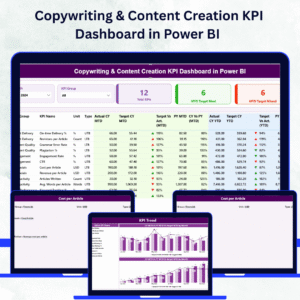
📊 Dynamic Summary Page:
Monitor total KPIs, MTD targets achieved or missed, and detailed KPI tables with conditional icons and comparisons.
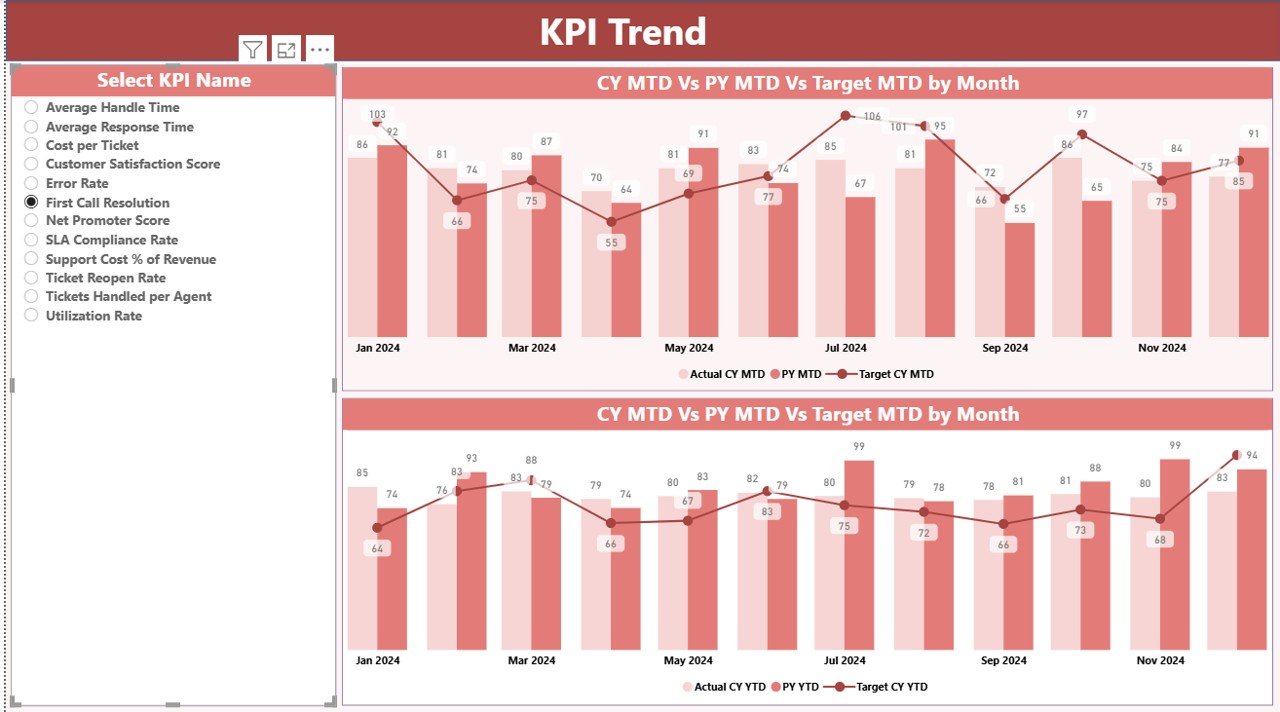
📅 KPI Trend Page:
Analyze month-to-date (MTD) and year-to-date (YTD) trends through interactive combo charts comparing current and previous year data.
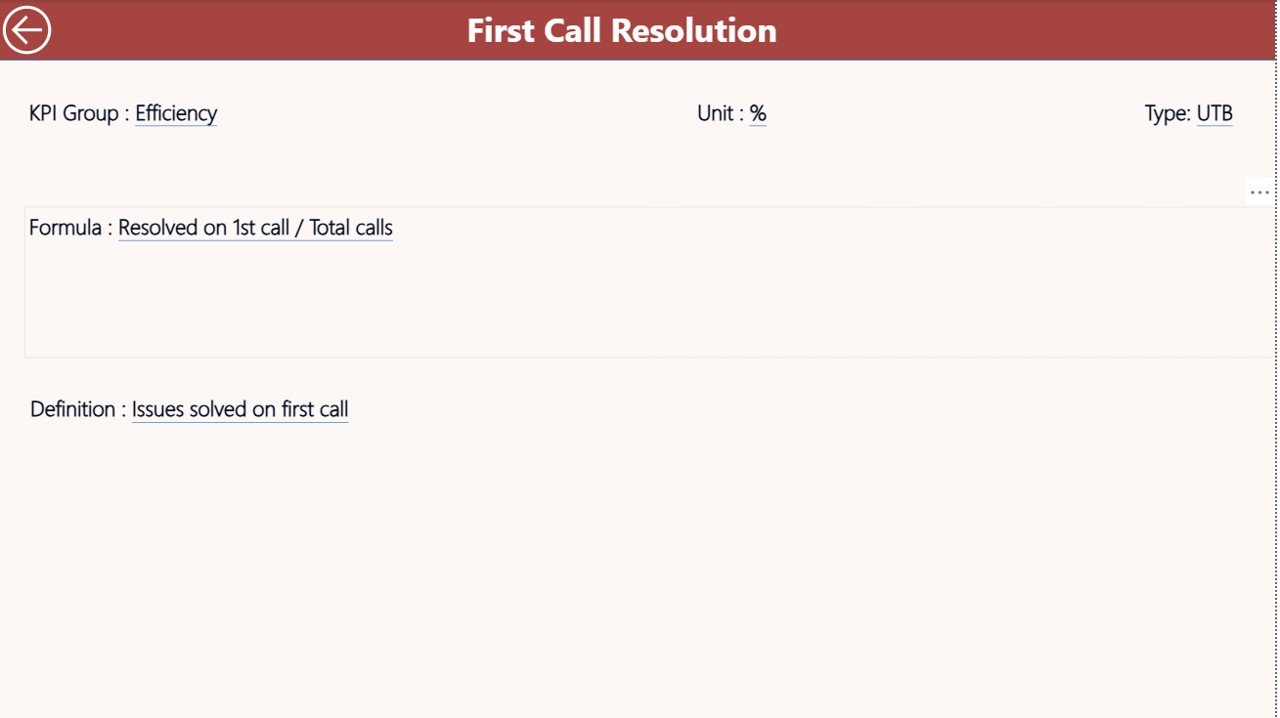
📘 KPI Definition Page:
Drill down into KPI formulas, definitions, and performance logic with a built-in drill-through feature.
📈 Excel-Based Data Source:
Easily manage data in simple Excel sheets — Actual, Target, and KPI Definition — no database or coding required.
🌐 Interactive Filters and Slicers:
Filter KPIs by group, month, or metric type to find exactly what you need in seconds.
💡 Auto-Refresh Capability:
Connect to live Excel files or Power BI Service for real-time updates.
🧩 Customizable and Scalable:
Modify KPI categories, formulas, or visuals to match your organization’s unique requirements.
📦 What’s Inside the Technical Support KPI Dashboard
Inside this Power BI file, you’ll find:
-
Summary Page: A clean and interactive view showing KPI details such as MTD performance, targets, year-on-year comparison, and color-coded icons for quick status review.
-
KPI Trend Page: Combo charts displaying monthly and yearly variations for each KPI to help identify patterns and improvement areas.
-
KPI Definition Page: A hidden yet powerful page where users can drill through for metric definitions, formulas, and KPI types (LTB/UTB).
-
Excel Data File: Three linked worksheets — Input_Actual, Input_Target, and KPI_Definition — for seamless data input and updates.
🧭 How to Use the Technical Support KPI Dashboard
🧩 Step 1: Open the Excel data file and fill in the Actual, Target, and KPI Definition sheets.
🔁 Step 2: Connect the Excel file to Power BI and click Refresh to update your visuals.
📆 Step 3: Use the slicers on the Summary Page to filter results by month or KPI group.
📊 Step 4: Navigate to the KPI Trend Page to visualize monthly and yearly performance.
🔍 Step 5: Right-click any KPI to drill through and view its formula and definition.
No coding, DAX expertise, or database knowledge is required — everything is prebuilt for immediate use.
👥 Who Can Benefit from This Technical Support KPI Dashboard
💼 IT Managers: Monitor real-time support performance and team efficiency.
🧑💻 Technical Support Leads: Identify weak areas and improve service turnaround times.
🏢 Operations Teams: Gain a complete view of performance trends and SLA compliance.
📈 Business Executives: Make informed decisions with accurate and up-to-date analytics.
⚙️ Consultants & Analysts: Customize and scale the dashboard for different client use cases.
Whether you run a small IT desk or manage global support operations, this dashboard helps you stay proactive, productive, and performance-focused.


Reviews
There are no reviews yet.