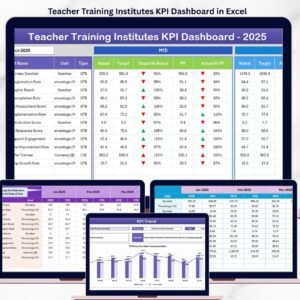
In the fast-evolving education sector, data-driven decision-making has become the foundation of effective training and resource management. Whether you’re overseeing a single institute or an entire network of teacher training centers, tracking performance, cost, and satisfaction can be overwhelming.
That’s why we’ve built the Teacher Training Institutes Dashboard in Excel — a ready-to-use, interactive, and fully customizable solution designed to simplify analysis, visualize key metrics, and enhance educational performance. 📊
Built entirely in Microsoft Excel, this dashboard brings together financial, operational, and satisfaction data in one place. No coding, no complex software — just actionable insights that help educators, administrators, and policymakers make smarter choices.
⚙️ Key Features of the Teacher Training Institutes Dashboard in Excel
📍 Intuitive Page Navigator – A left-side panel lets you jump between pages like Overview, Institute Analysis, Course Analysis, Funding Source Analysis, and Monthly Trends.
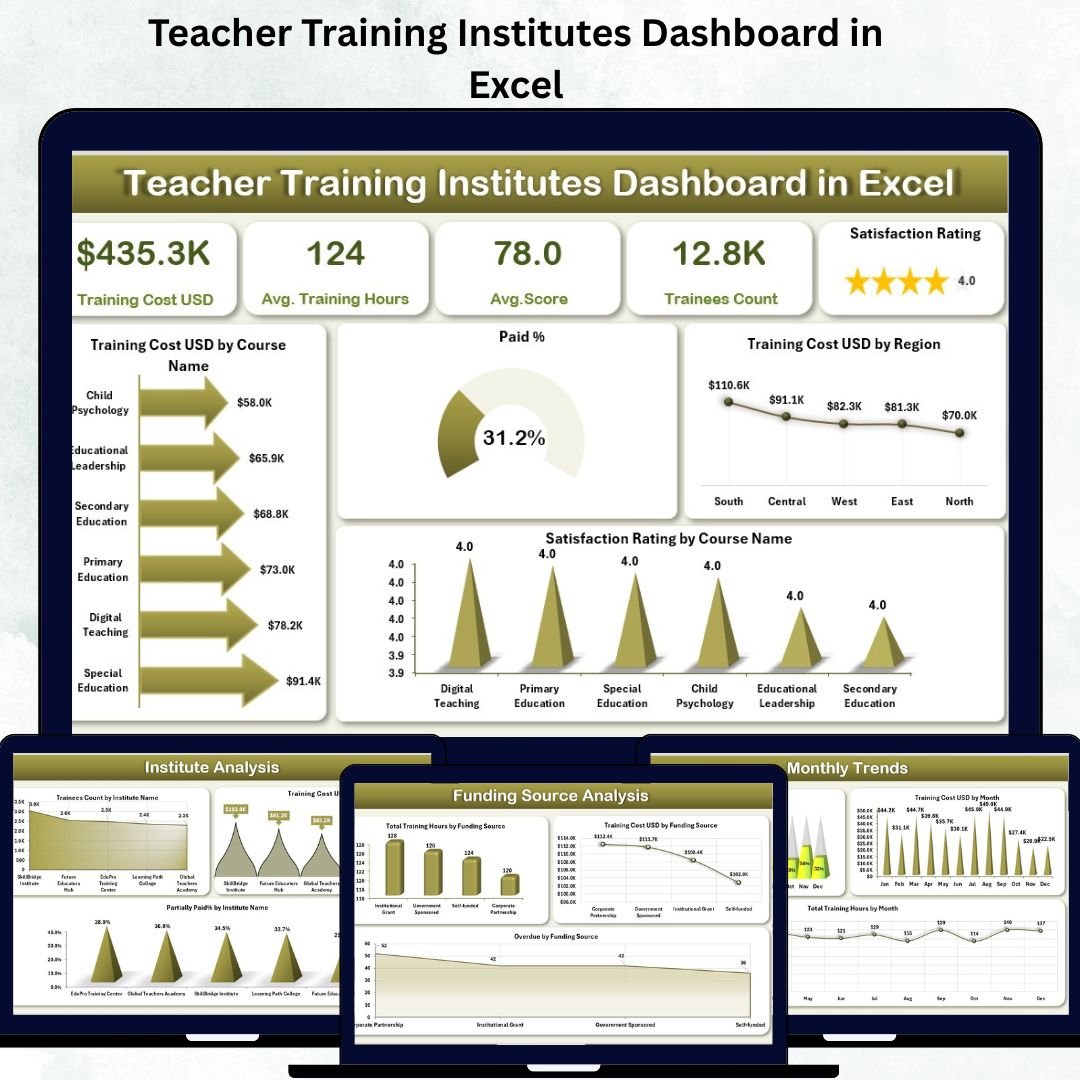
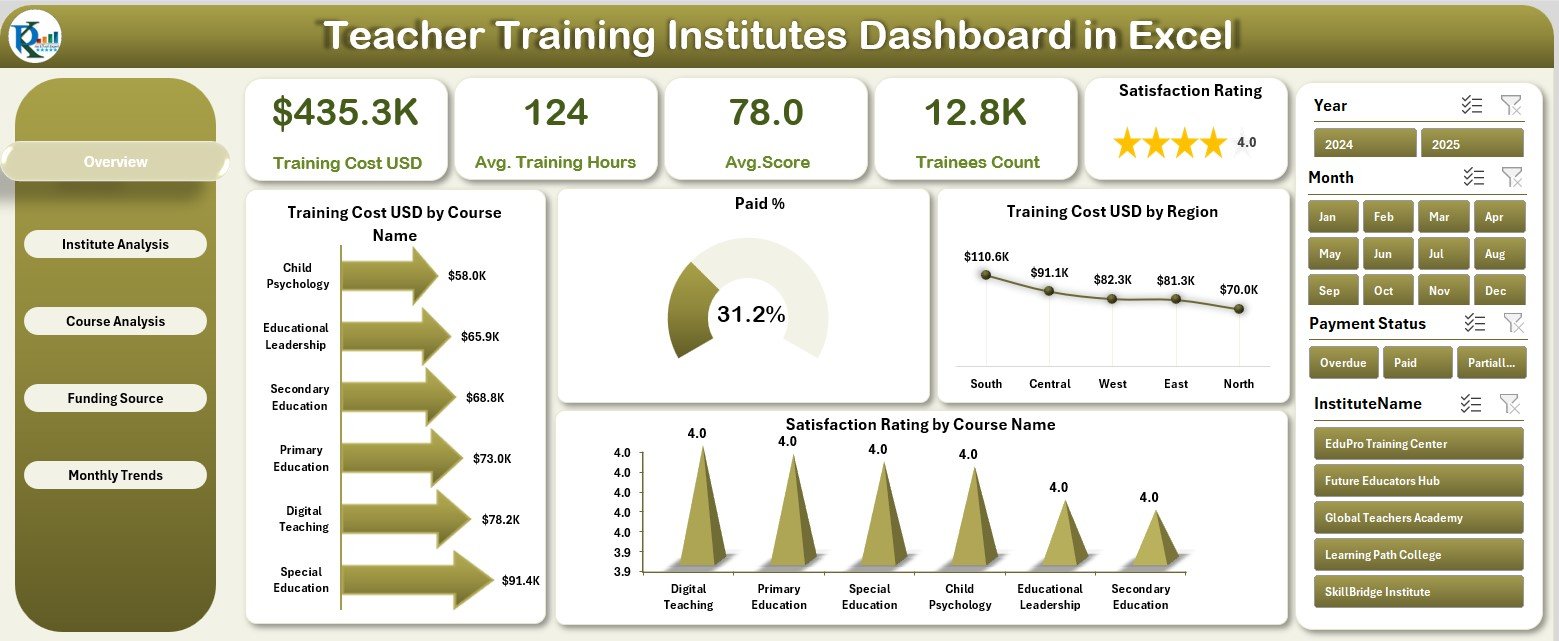
📊 Dynamic Overview Page – View total training cost, satisfaction ratings, and paid percentage across regions and courses through KPI cards and interactive charts.
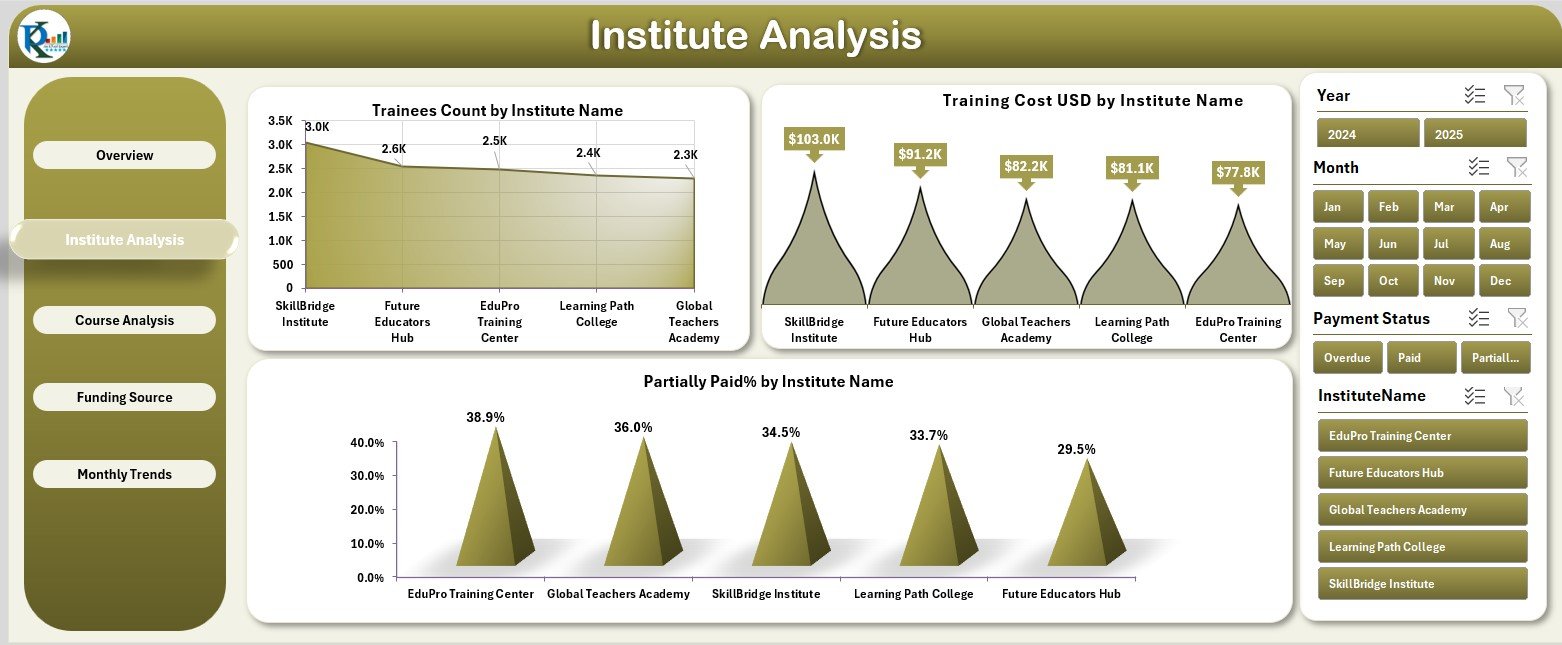
🏫 Institute Analysis Page – Compare institute performance with visuals showing Trainees Count, Training Cost, and Partially Paid %.
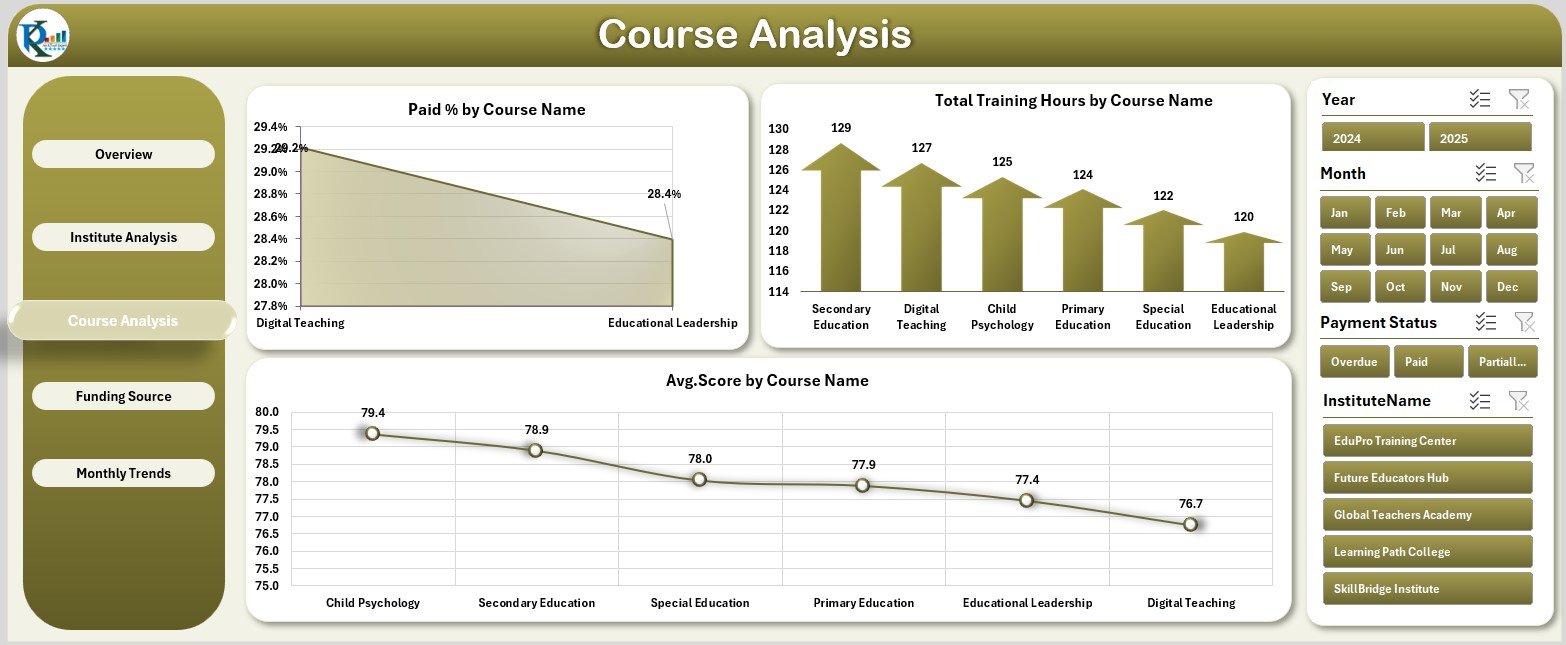
📘 Course Analysis Page – Evaluate cost efficiency, training hours, and average scores by course name.
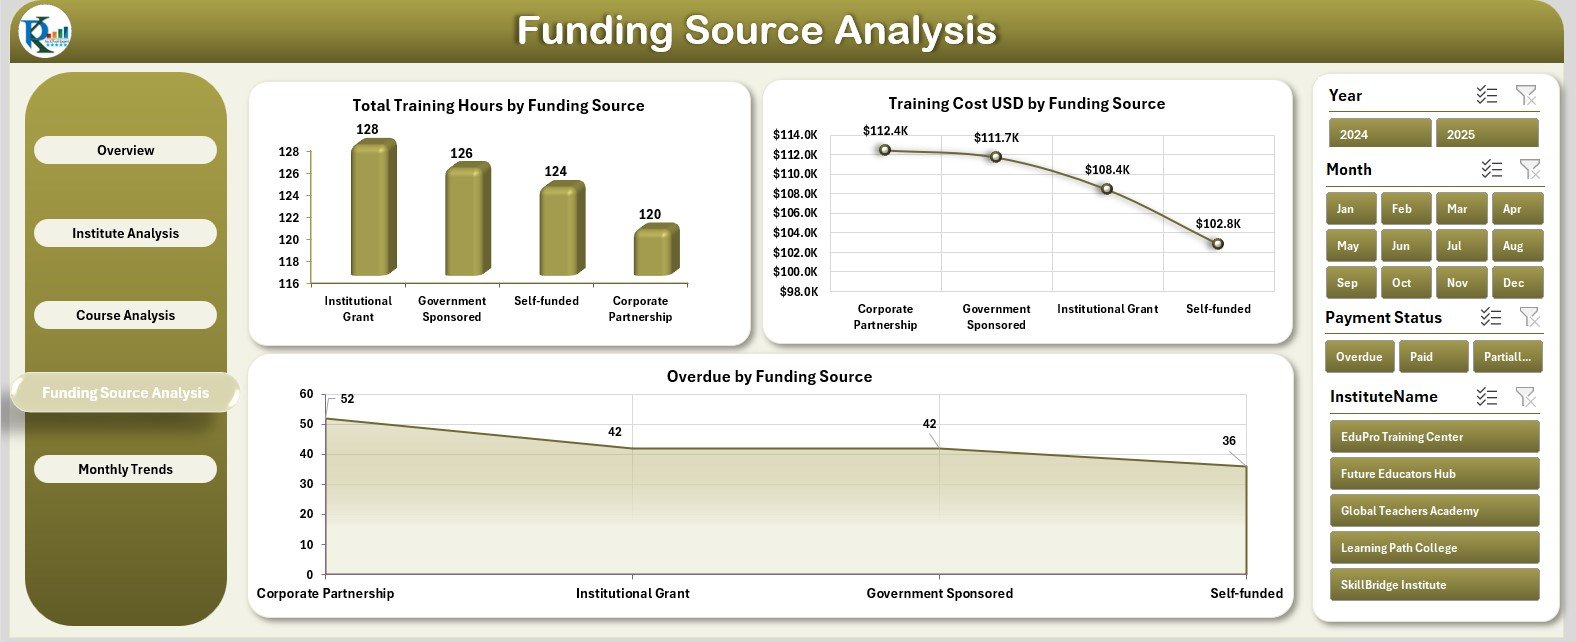
💰 Funding Source Analysis – Track costs, training hours, and overdue payments by funding source for financial transparency.
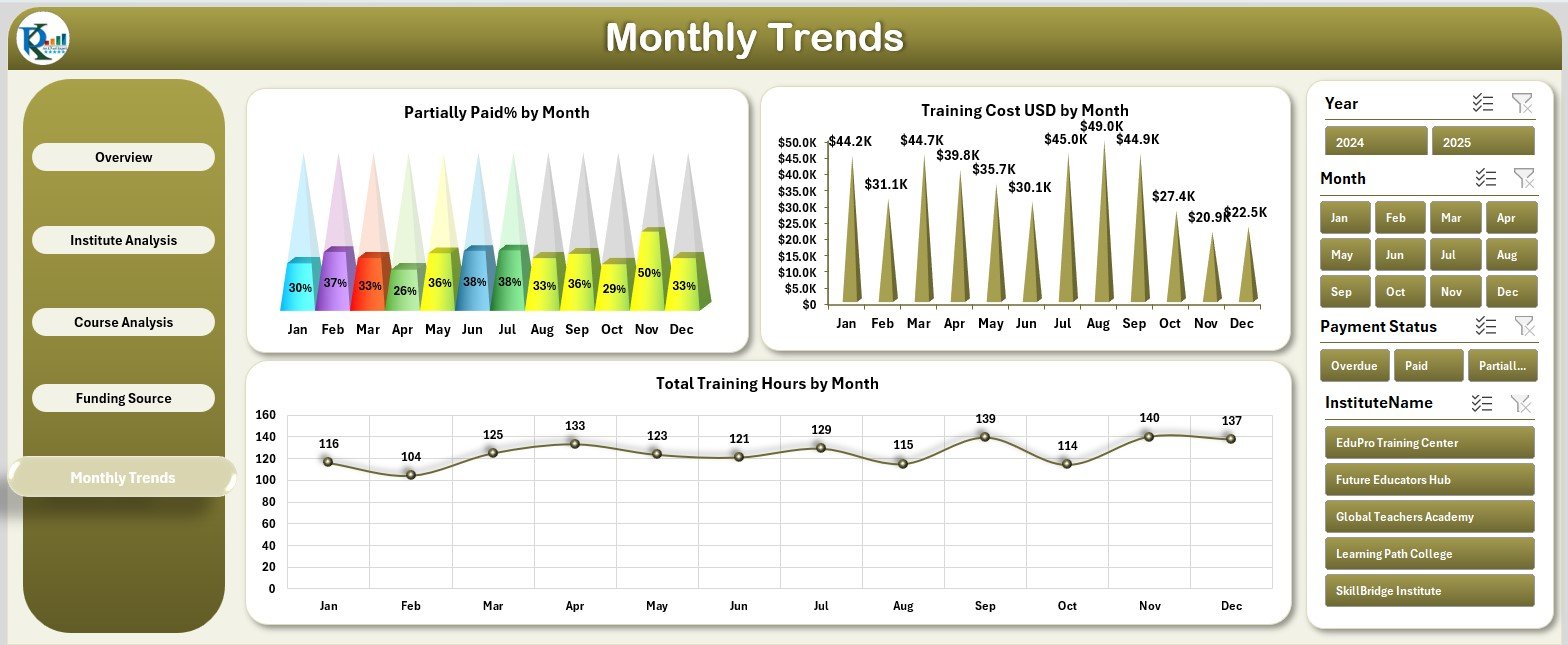
📅 Monthly Trends Page – Identify seasonal patterns in training cost, paid %, and total hours by month.
🧾 Support & Data Sheets – Pre-structured data tables and dropdown lists make it easy to input and update records.
🔒 Zero Coding Required – Powered entirely by Excel formulas and pivot tables — no macros or add-ons needed.
📂 What’s Inside the Teacher Training Institutes Dashboard in Excel
🎯 1. Overview Page:
Your command center — instantly see total costs, satisfaction trends, and high-performing courses with 5 KPI cards and 4 interactive charts.
🏫 2. Institute Analysis:
Gain clarity on institute-wise performance with visuals that reveal where support or efficiency improvements are needed.
📘 3. Course Analysis:
Track performance by course type to understand which training programs yield the best outcomes.
💰 4. Funding Source Analysis:
Ensure financial accountability with insights into fund allocation and pending payments.
📆 5. Monthly Trends:
Monitor yearly progress and identify peak periods for training activity.
📋 6. Support & Data Sheets:
Keep all records clean, validated, and ready for instant visual updates.
Together, these sheets create a comprehensive performance ecosystem — easy to manage and rich in insights.
🧭 How to Use the Teacher Training Institutes Dashboard in Excel
1️⃣ Enter Data: Add training, cost, and satisfaction data in the Data Sheet.
2️⃣ Navigate Pages: Use the left-side navigator to switch between analytical views.
3️⃣ Filter Insights: Apply slicers for course, institute, region, or month.
4️⃣ View KPIs: Review key performance cards for instant highlights.
5️⃣ Analyze Trends: Examine monthly visuals to guide planning and budgeting.
6️⃣ Update Automatically: As you add new data, charts and KPIs refresh instantly.
💡 Tip: Share your dashboard via OneDrive or Teams for real-time collaboration across departments.
👥 Who Can Benefit from This Dashboard
🏫 Institute Administrators: Monitor training outcomes, satisfaction, and financial KPIs in one view.
📚 Training Coordinators: Measure course impact, trainee performance, and cost efficiency.
💼 Policy Makers: Assess program reach, fund utilization, and regional performance.
💰 Finance Teams: Track expenditures, overdue payments, and funding channel performance.
👩🏫 Educators & Trainers: Review feedback, satisfaction scores, and areas for improvement.
Whether you manage one center or multiple institutes, this Excel tool ensures transparency, accountability, and better decision-making.