The Supply Chain and Logistics Sustainability KPI Dashboard in Excel is a ready-to-use, plug-and-play tool that helps you monitor and improve sustainability performance with confidence. It offers interactive visuals, real-time reporting, and powerful analytics—all inside your favorite spreadsheet software.
Let’s dive into what makes this dashboard a must-have for responsible supply chain professionals.
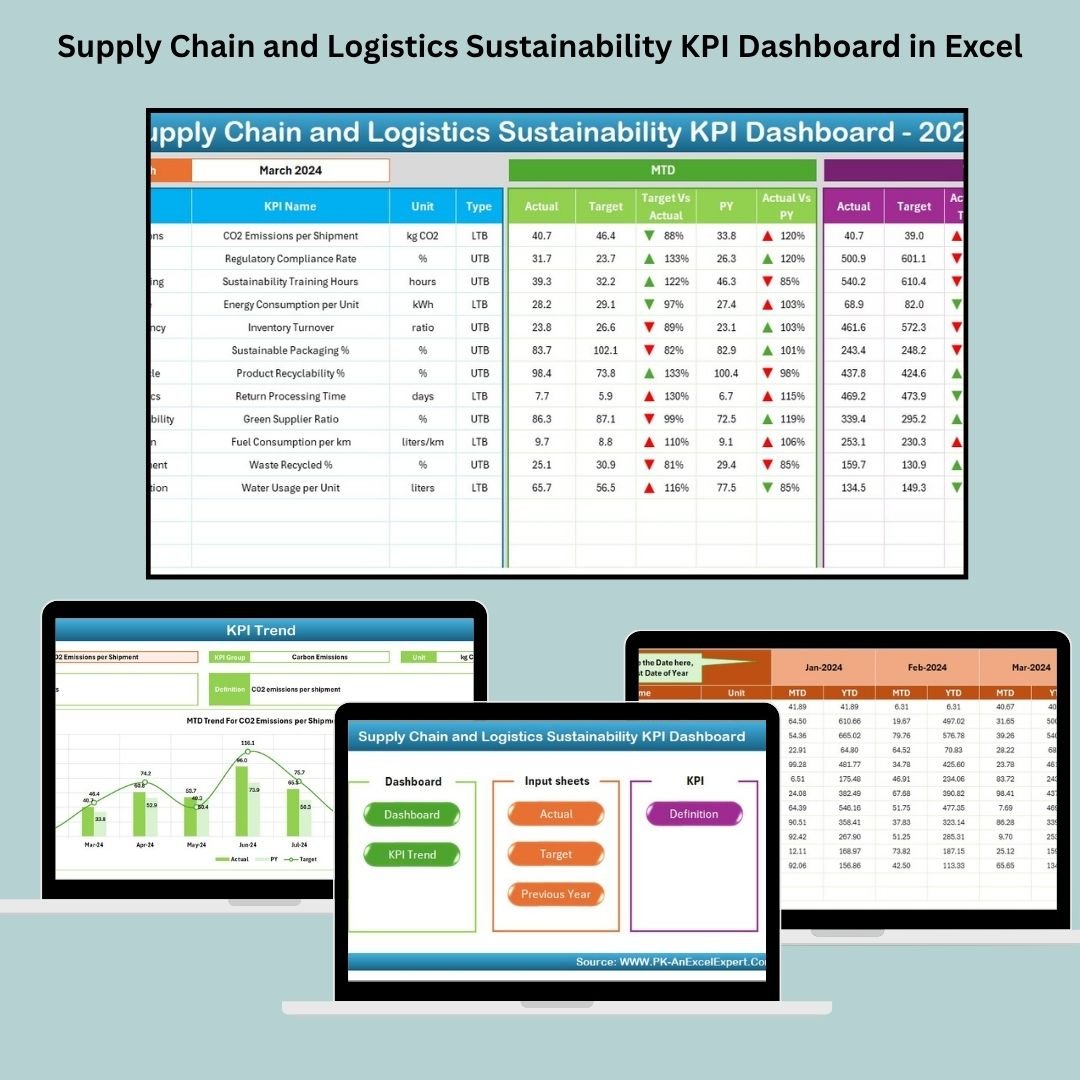
✨ Key Features of Supply Chain Sustainability KPI Dashboard in Excel
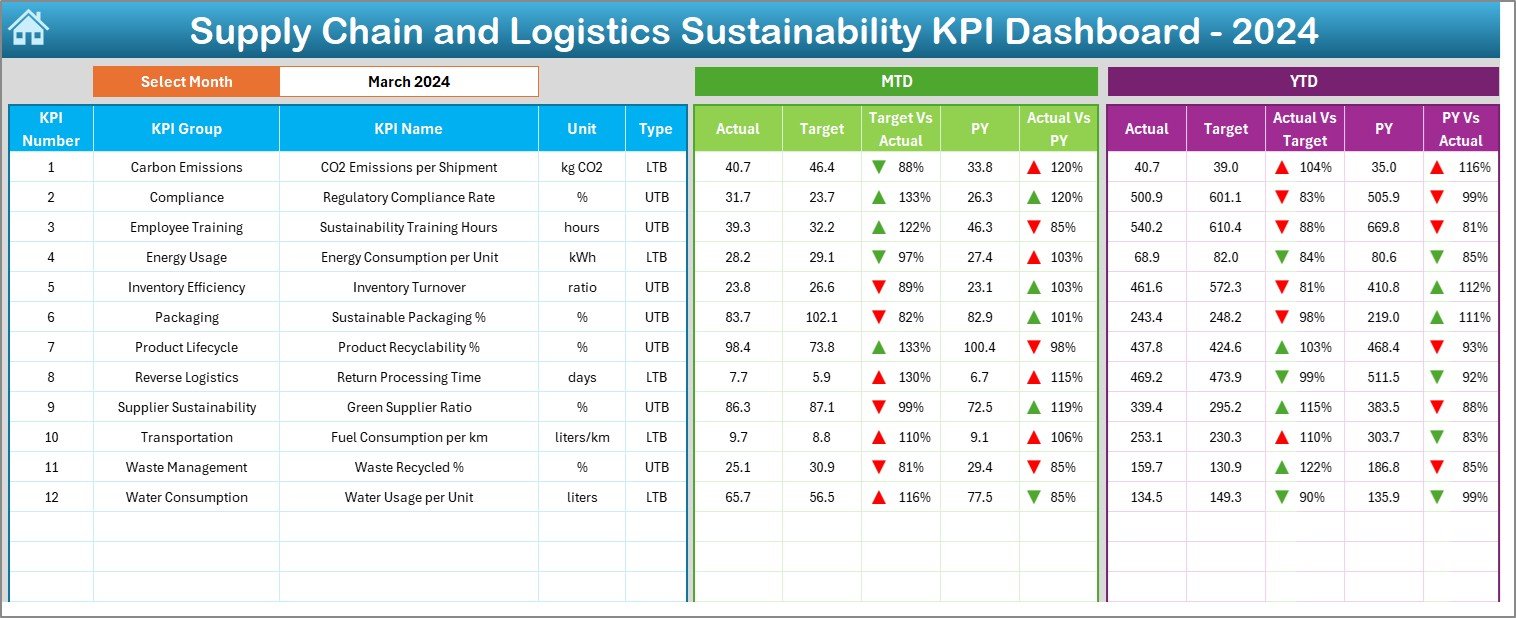
📊 Dynamic, Data-Driven Dashboard
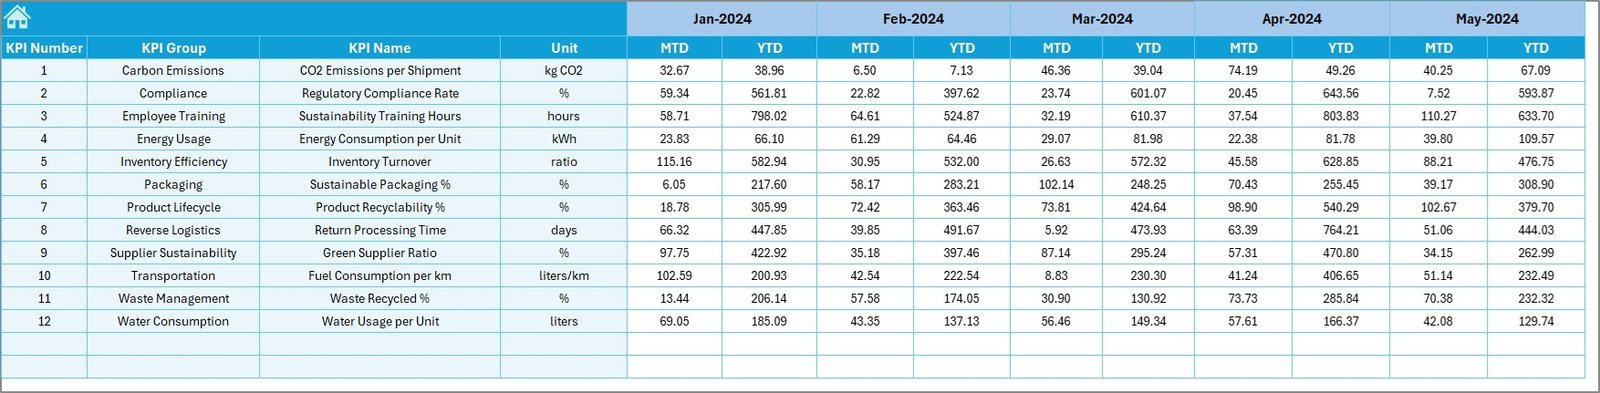
Track Month-to-Date (MTD), Year-to-Date (YTD), and Previous Year (PY) performance—all on one powerful sheet.
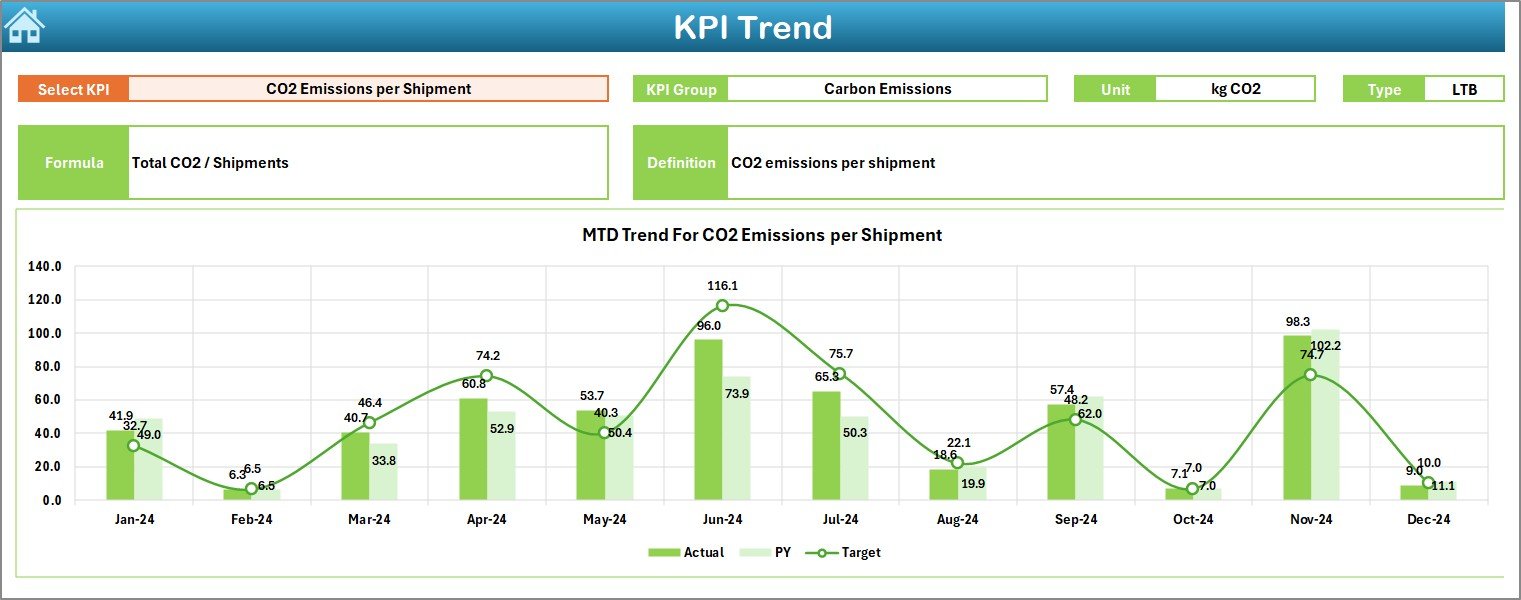
📈 KPI Trend Tracker
Zoom in on any KPI to view performance trends and insights. Compare Actual vs. Target vs. PY with automated line charts.
♻️ Eco-Focused KPIs Built-In
Includes metrics like carbon emissions, recyclable packaging rate, fuel usage per ton-km, and more.
🔁 Side-by-Side Comparisons
Instantly compare current performance against targets and past results—visually flagged with up/down arrows.
🧾 Editable Inputs for Full Control
Input monthly actuals, define targets, and enter PY numbers—your dashboard updates automatically.
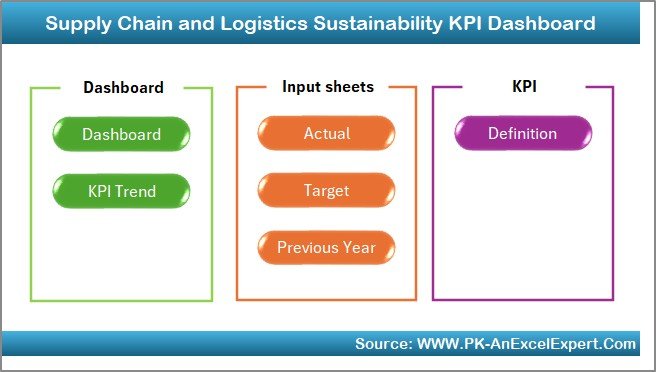
📁 7 Pre-Built Worksheets
Each tab is strategically designed for navigation, input, target-setting, trends, benchmarking, and documentation.
✅ No Coding Needed
Built entirely on Excel formulas, slicers, and conditional formatting—absolutely zero VBA required.
📂 What’s Inside the Sustainability Dashboard
🟢 Home Sheet – Jump to any section with one click
📊 Dashboard Sheet – MTD, YTD, PY, and visual trend indicators
📈 KPI Trend Sheet – View individual KPI details and growth patterns
📥 Actual Numbers Input Sheet – Update your raw sustainability data
🎯 Target Sheet – Set eco-goals aligned with business vision
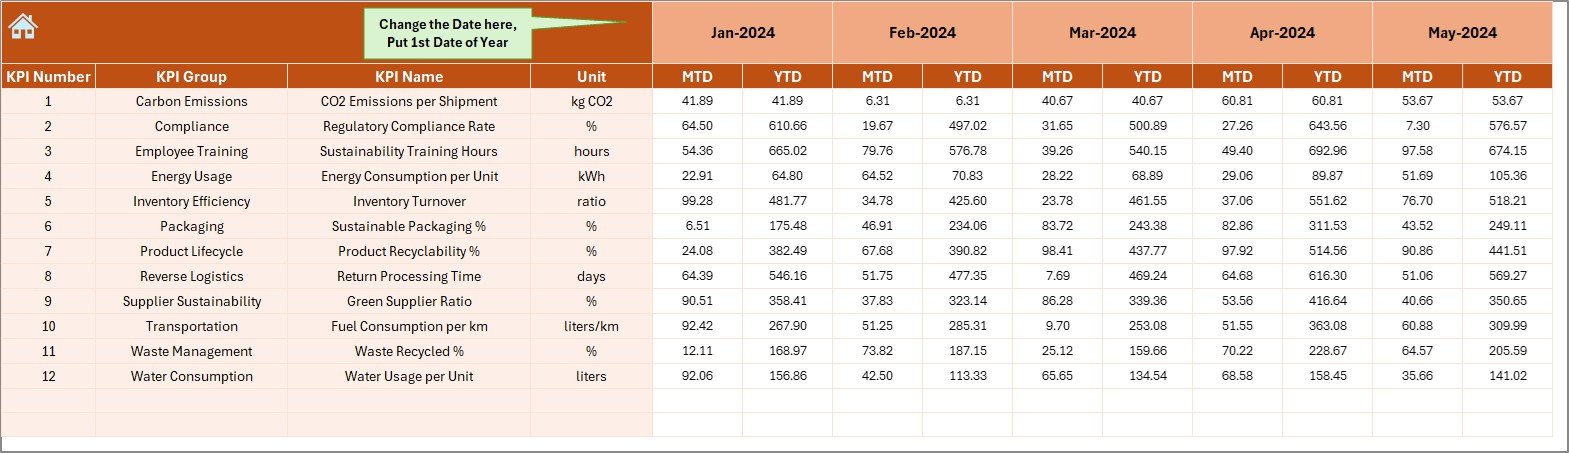
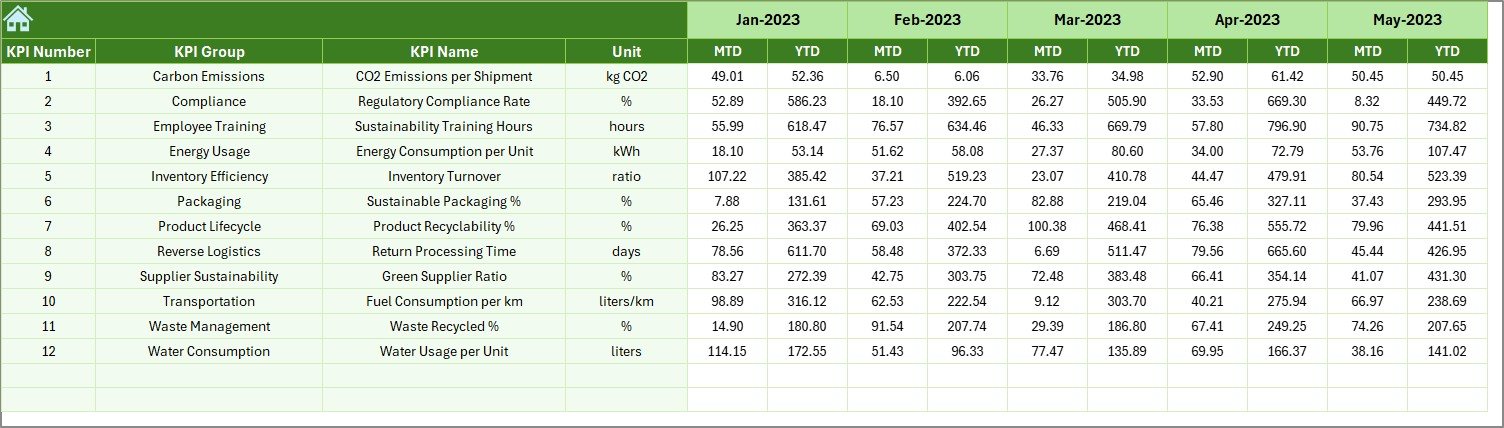
📆 Previous Year Sheet – Benchmark against last year’s stats
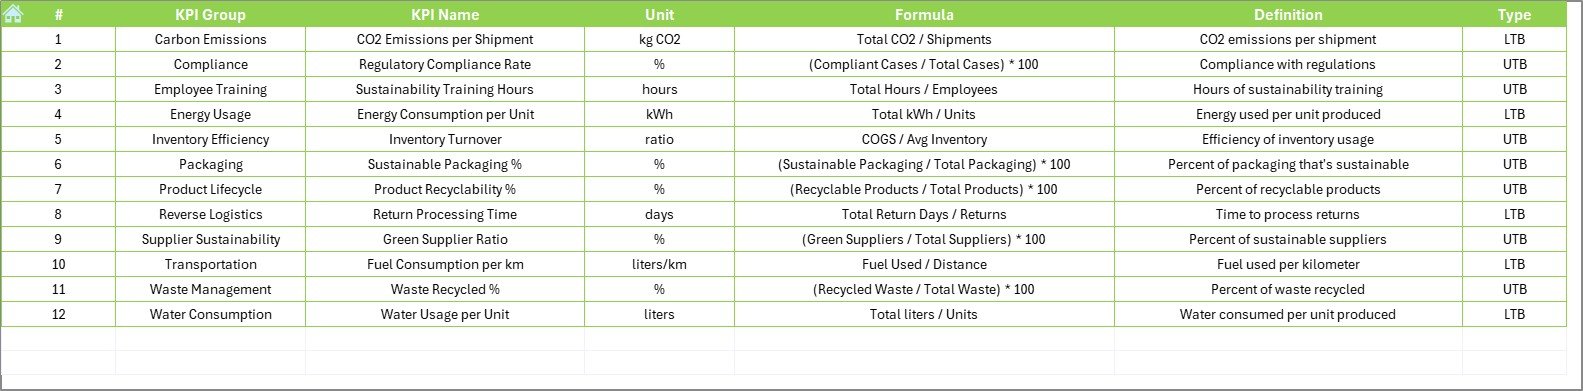
📘 KPI Definition Sheet – Central glossary of each KPI with formula, type, and unit
🛠️ How to Use the KPI Dashboard
1️⃣ Start on the Home Sheet
Use the navigation buttons to jump between tabs effortlessly.
2️⃣ Input Monthly Actuals
Go to the Actual Numbers Input Sheet and update MTD/YTD data for each sustainability KPI.
3️⃣ Set Realistic Targets
Define your monthly targets in the Target Sheet to track goals vs. outcomes.
4️⃣ Benchmark with PY Data
Enter last year’s figures in the Previous Year Sheet to evaluate long-term improvement.
5️⃣ Analyze Trends
Use the KPI Trend Sheet to study detailed progress charts for each metric.
6️⃣ Act on Insights
Identify gaps, act early, and create a greener supply chain!
👥 Who Can Benefit from This Excel Dashboard?
🌿 Sustainability Officers – Monitor emissions and compliance
🚛 Logistics Managers – Track fuel efficiency and waste reduction
🏭 Manufacturers – Evaluate supplier sustainability and packaging
🏬 Retail Chains – Reduce packaging and logistics emissions
📦 Warehousing Teams – Optimize energy and material usage
🧾 Corporate Strategy Teams – Align operations with ESG goals
🔗 Click here to read the Detailed blog post
📺 Visit our YouTube channel to learn step-by-step video tutorials


Reviews
There are no reviews yet.