In the high-stakes world of logistics and supply chain management, delays can be costly—but with the Supply Chain and Logistics Project Timeline KPI Dashboard in Excel, you gain a powerful edge. This ready-to-use Excel tool lets you monitor critical KPIs across months, spot performance gaps early, and make timely, data-driven decisions.
Whether you’re managing delivery routes, warehouse schedules, vendor performance, or inventory movement, this dashboard gives you visual clarity and actionable insight—without complex software or coding.
✨ Key Features of Project Timeline KPI Dashboard in Excel
📊 Visual Dashboard Control Center
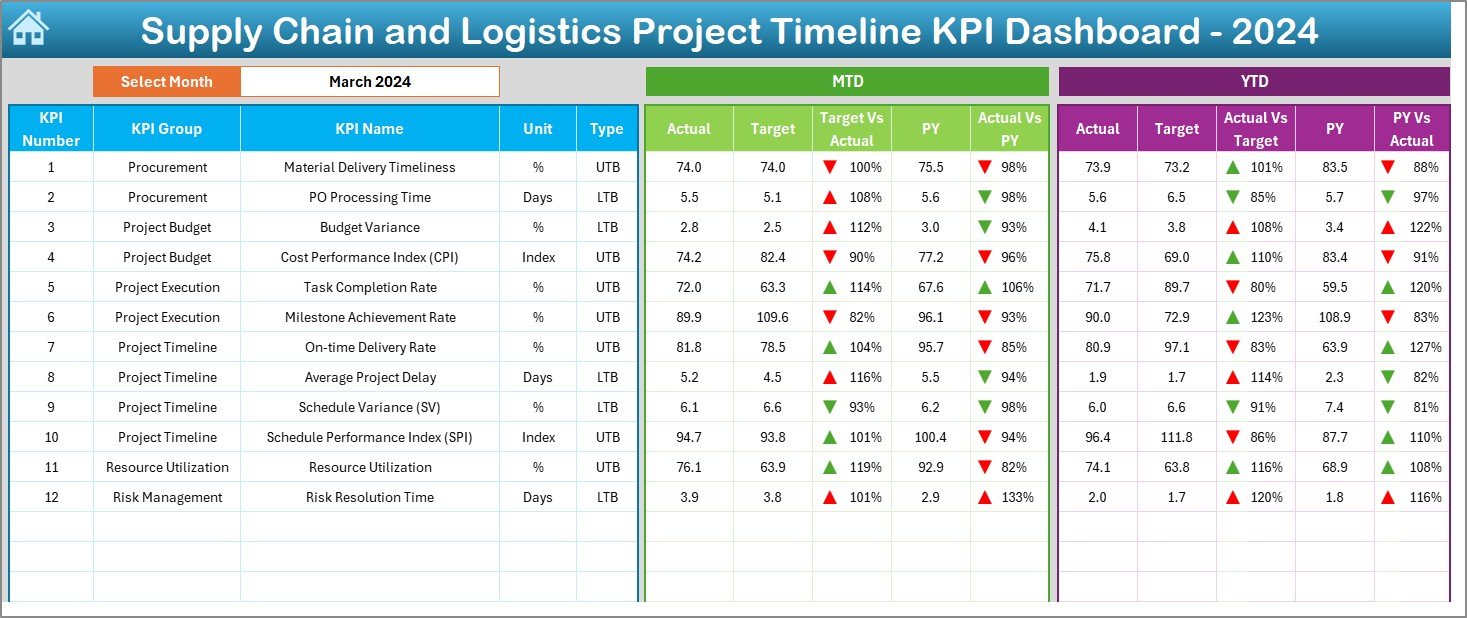
Select any month from the dropdown and instantly view MTD and YTD data across:
-
Actual vs Target
-
Actual vs Previous Year
-
Up/down arrows (conditional formatting) for immediate comparison
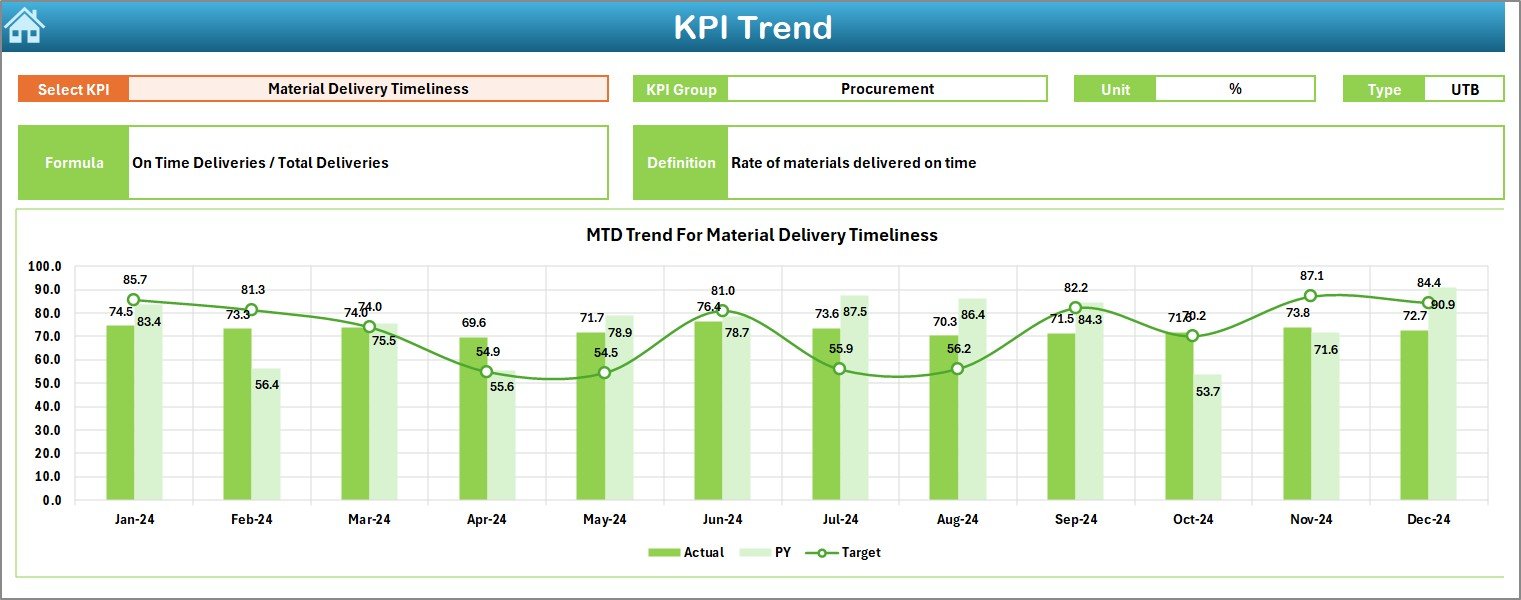
📈 KPI Trend Analysis Sheet
Track individual KPI trends over time with:
-
Auto-filled KPI details
-
MTD and YTD charts
-
Drop-down selector for focused analysis
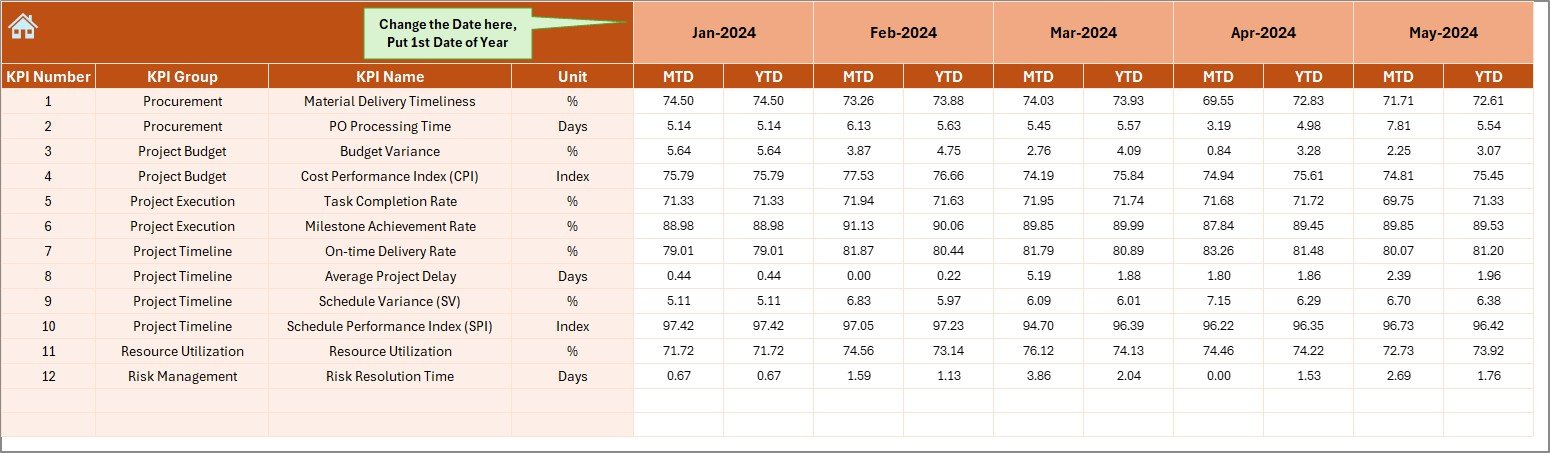
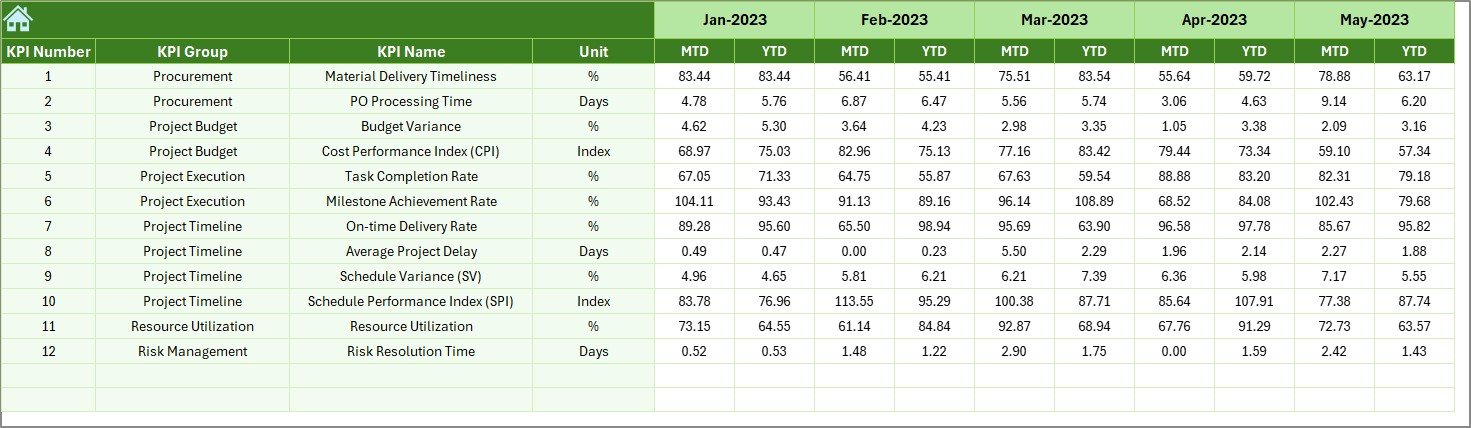
📥 Actual Numbers Input Sheet
Input MTD and YTD actuals month-by-month. Set your fiscal start month and the dashboard updates dynamically.
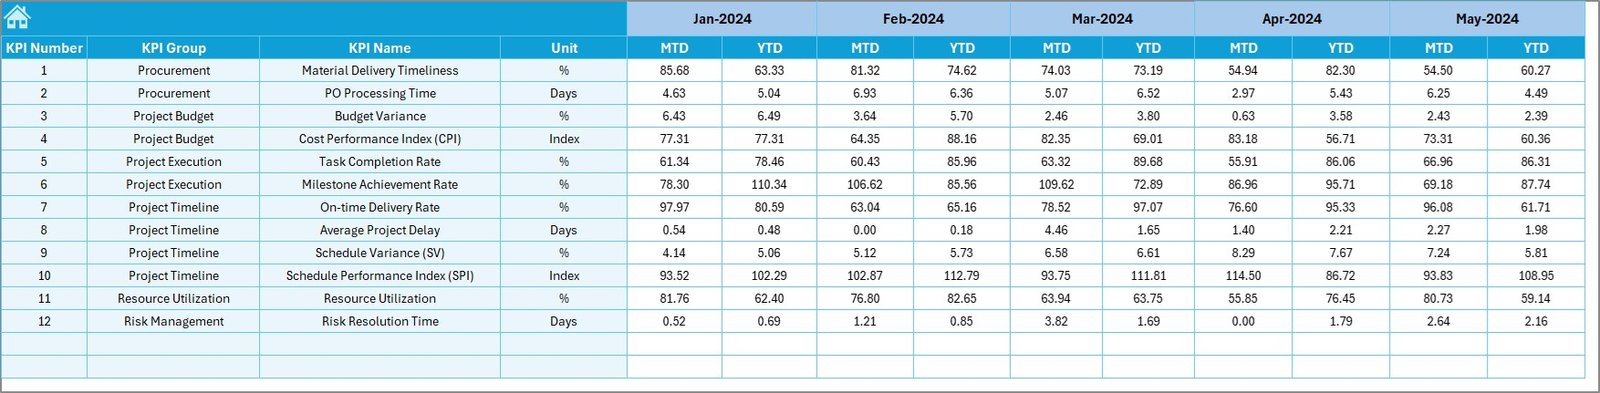
🎯 Target Input Sheet
Define monthly and yearly KPI goals—aligns perfectly with your business benchmarks.
📆 Previous Year Comparison Sheet
Input prior year data for meaningful year-over-year insights.
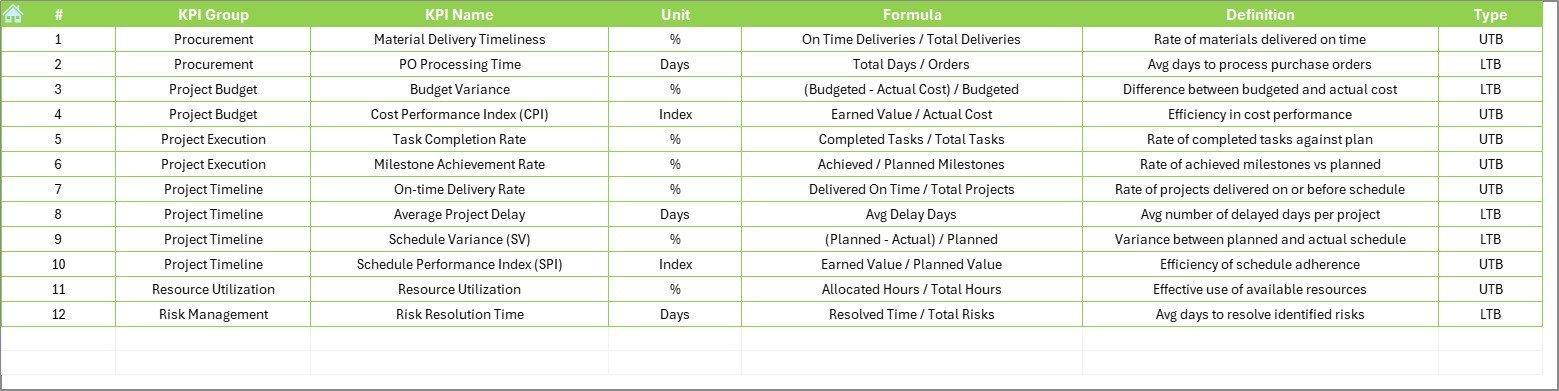
📘 KPI Definition Sheet
Document KPI Name, Group, Unit, Formula, and classification (UTB or LTB). Keep metrics standardized and clear.
🧭 Home Sheet Navigation
Jump across the entire workbook quickly using intuitive buttons—perfect for teams.
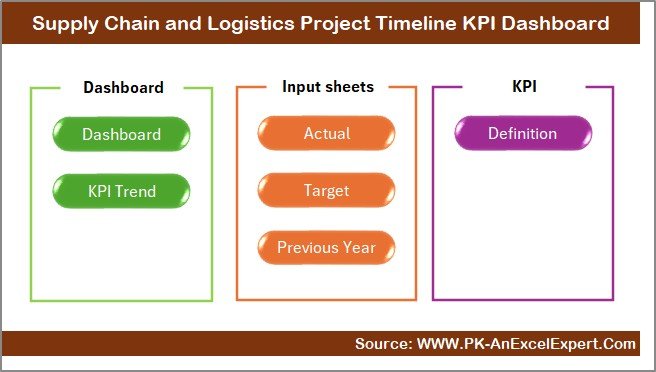
📂 What’s Inside the Excel Template?
🟢 Home Sheet – One-click navigation
📊 Dashboard Sheet – KPI summaries, indicators, and month selection
📈 KPI Trend Sheet – Line charts with full metric breakdown
📥 Actual Numbers Input Sheet – Input real performance numbers
🎯 Target Sheet – Set your KPI targets (MTD/YTD)
📆 Previous Year Data Sheet – Benchmark current data against PY
📘 KPI Definition Sheet – Create your own KPI library
🛠️ How to Use the Dashboard
1️⃣ Open the Template and Enable Editing
No macros or coding—just plug and play.
2️⃣ Enter Your KPI Definitions
List your project-related KPIs, formulas, units, and performance types (UTB or LTB).
3️⃣ Add Actual, Target, and PY Data
Input values into each respective sheet. The dashboard and charts update automatically.
4️⃣ Select a Month on the Dashboard
Use the dropdown to view performance summaries, variances, and visual indicators.
5️⃣ Track KPI Trends
Use the KPI Trend tab to analyze individual performance patterns for quick insights.
👥 Who Can Use This Excel Dashboard?
🚛 Logistics Project Managers – Monitor delivery schedules and timelines
🏭 Manufacturing Leads – Track production milestones
📦 Warehouse Coordinators – Plan capacity and dispatch
🌐 Supply Chain Analysts – Spot trends and reduce cycle times
🏗️ Operations Teams – Ensure project delivery stays on track
🧑💼 Business Owners – Gain visibility across all supply chain operations
🔗 Click here to read the Detailed blog post
📺 Visit our YouTube channel to learn step-by-step video tutorials


Reviews
There are no reviews yet.