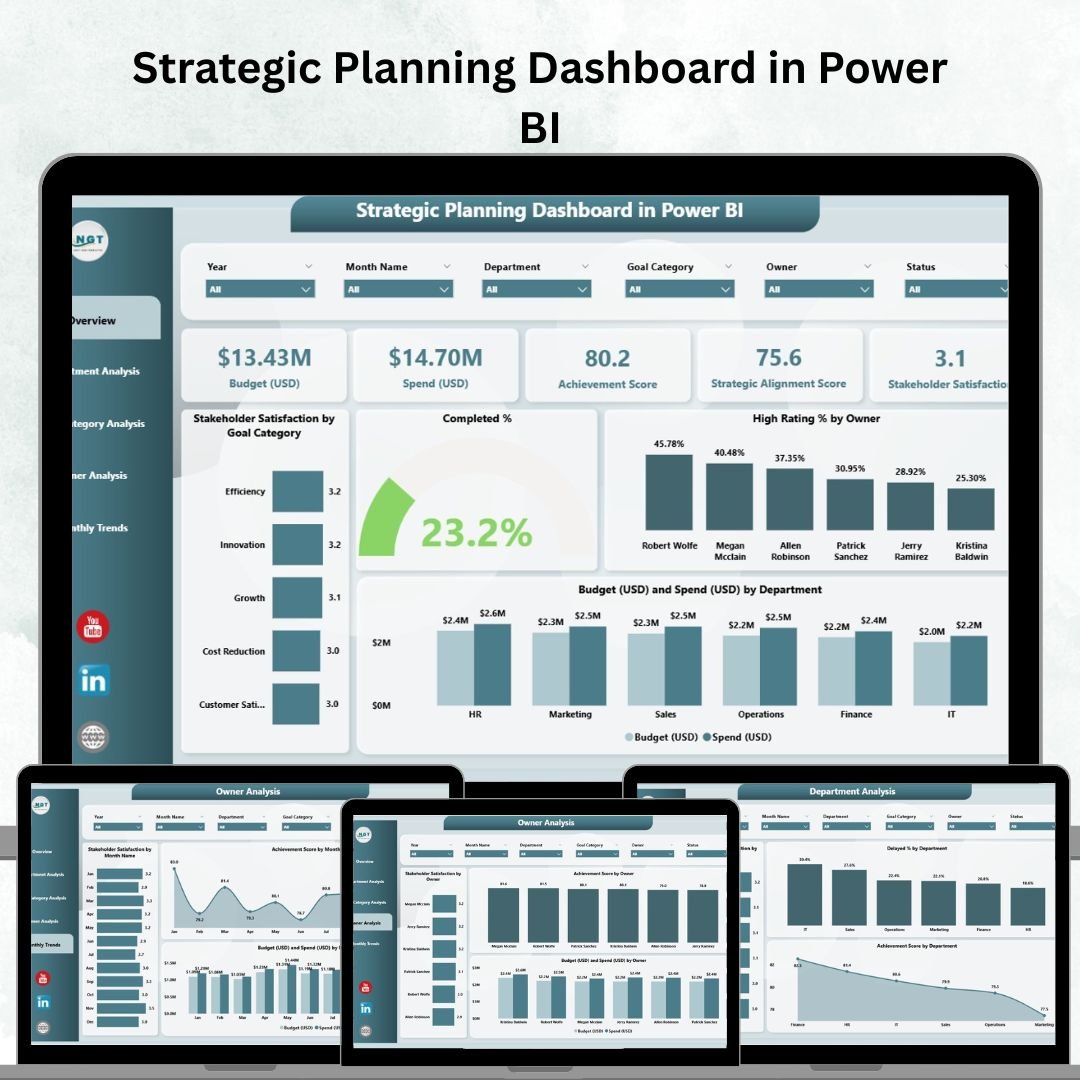
In today’s fast-changing business landscape, success depends not only on setting the right goals but also on consistently tracking and achieving them. Many organizations prepare strategic plans, but without proper monitoring, these plans often remain on paper. The Strategic Planning Dashboard in Power BI solves this challenge by offering a clear, interactive, and real-time way to track performance against organizational goals.
Built in Microsoft Power BI, this dashboard brings together data from multiple departments into one central hub. Instead of juggling spreadsheets and static reports, leaders, managers, and employees can rely on dynamic visuals, slicers, and KPIs that reflect progress in real time. This ensures that strategy isn’t just planned but actively executed.
✨ Key Features of the Strategic Planning Dashboard
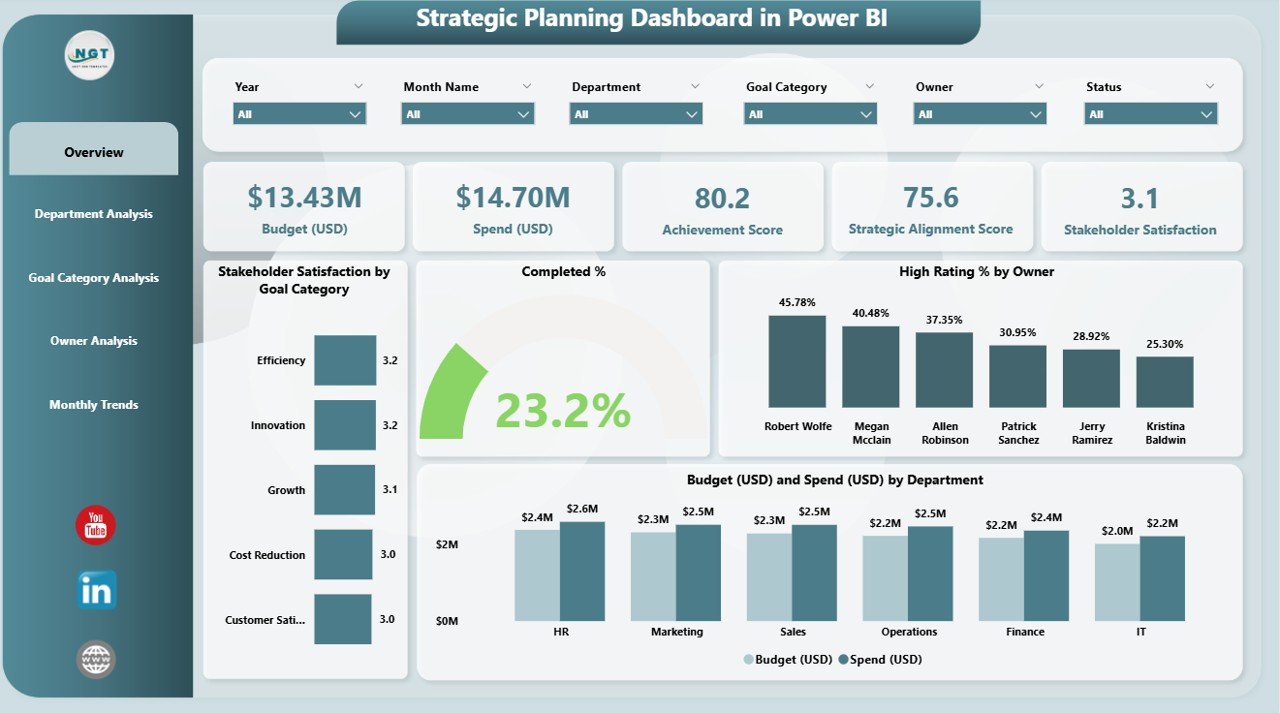
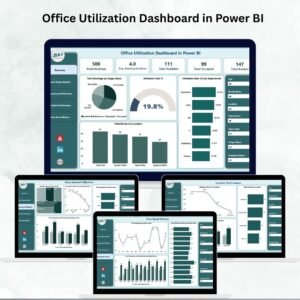
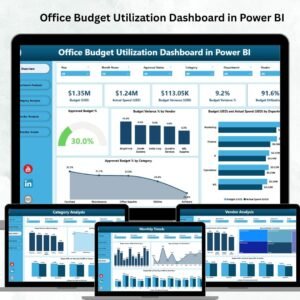
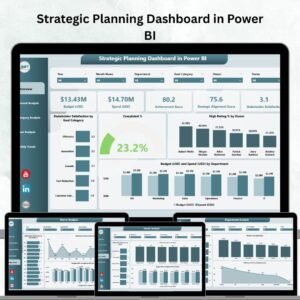
✅ Overview Page – A snapshot of progress with cards showing completion %, satisfaction, and budget vs. spend.
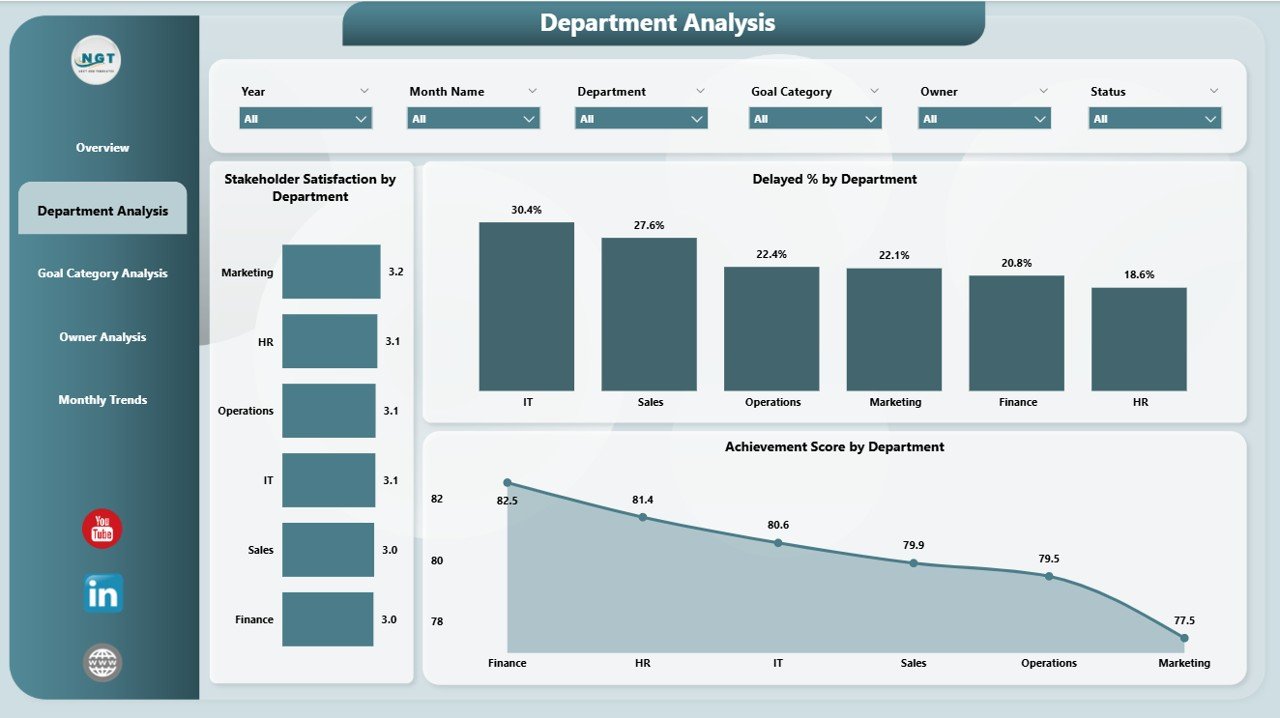
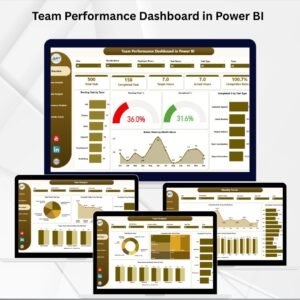
✅ Department Analysis – Drill down into departmental KPIs to see strengths and bottlenecks.
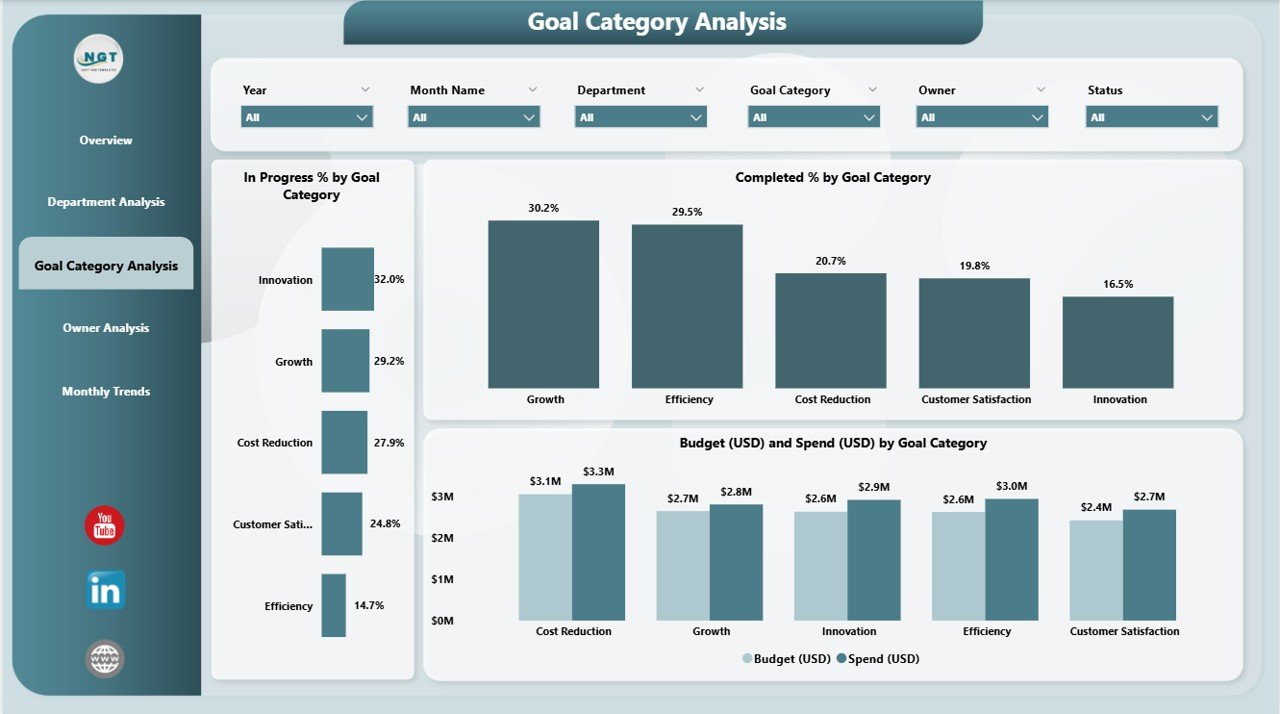
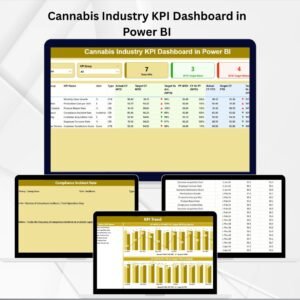
✅ Goal Category Analysis – Track progress across different strategic goals and resource utilization.
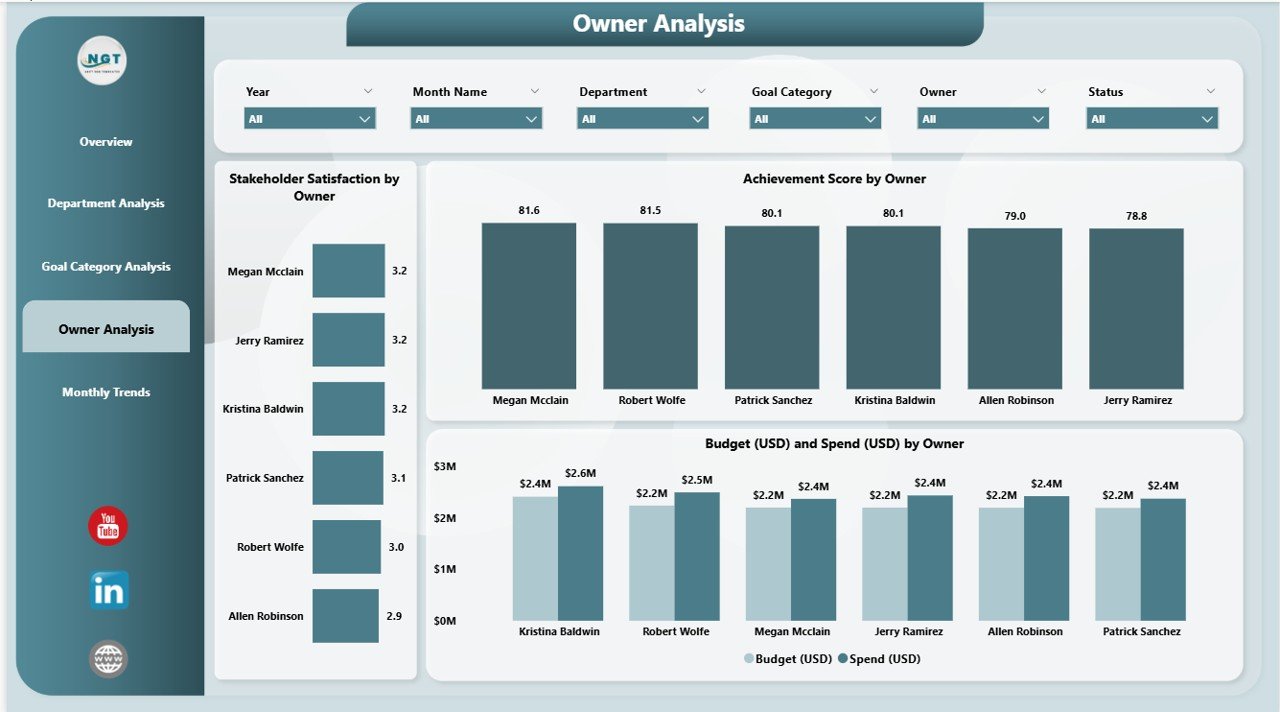
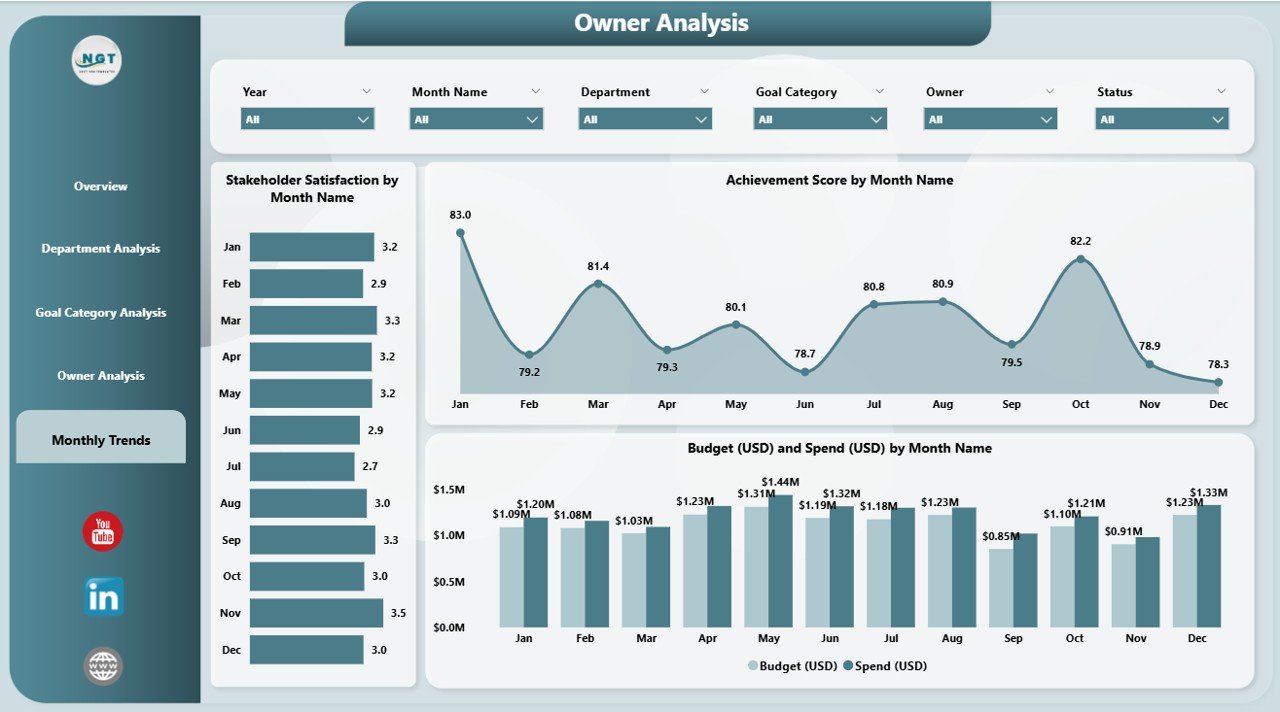
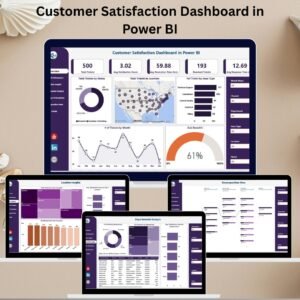
✅ Owner Analysis – Evaluate individual accountability and performance by goal owner.
✅ Monthly Trends – Monitor long-term patterns with satisfaction, achievement, and financial charts.
✅ Interactive Slicers – Filter by department, owner, or goal category instantly.
✅ Real-Time Data Refresh – Connects with Excel, ERP, CRM, or HR tools for live updates.
✅ Customizable Visuals – Adapt KPIs and charts based on your business needs.
📂 What’s Inside the Strategic Planning Dashboard
This professional Power BI solution includes five well-structured pages:
-
Overview Page 📊 – Summary cards + stakeholder satisfaction, completion %, high rating %, and budget vs spend.
-
Department Analysis Page 🏢 – Compare satisfaction, delays, and achievement scores across departments.
-
Goal Category Analysis Page 🎯 – Visualize progress and budget efficiency by goal type.
-
Owner Analysis Page 👤 – Accountability and performance metrics for responsible persons.
-
Monthly Trends Page 📈 – Track satisfaction, achievement, and spending month by month.
Every page is designed to give leaders clarity and employees visibility into how their work contributes to organizational growth.
🛠️ How to Use the Strategic Planning Dashboard
-
Collect Data – Gather KPIs from Excel, ERP, CRM, or HR systems.
-
Connect to Power BI – Import your data sources with a few clicks.
-
Review Overview Page – Get a high-level understanding of progress.
-
Drill Down – Explore Department, Goal Category, and Owner Analysis for detailed insights.
-
Track Trends – Use the Monthly Trends Page to identify recurring patterns.
-
Take Action – Adjust resources, re-allocate budgets, or refine goals based on data.
👥 Who Can Benefit from This Dashboard?
📌 Executives – Align strategy with execution and measure organization-wide success.
📌 Department Heads – Identify strengths and weaknesses at a team level.
📌 Project Managers – Align project milestones with strategic objectives.
📌 Finance Teams – Monitor budget vs. spend in real time.
📌 Employees – Understand how individual contributions connect to company goals.
📌 Small & Large Businesses – Scalable for organizations of any size.


Reviews
There are no reviews yet.