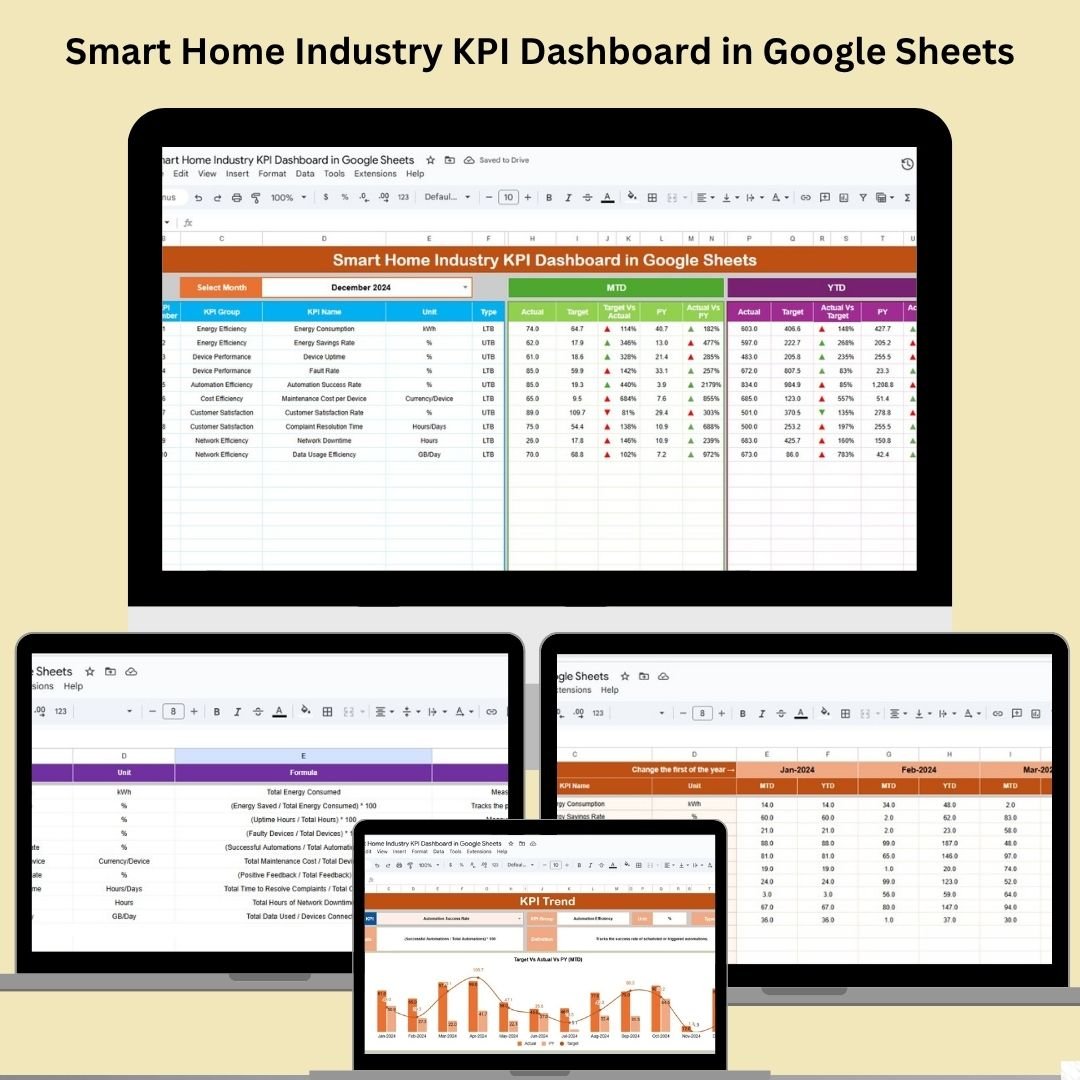
Managing a growing smart home business requires more than just great products—it demands real-time insights and performance visibility across departments. That’s where the Smart Home Industry KPI Dashboard in Google Sheets steps in as your go-to tool for tracking every critical metric in one central place. 🌐📈
Designed specifically for smart home companies, this powerful Google Sheets dashboard helps you track, analyze, and act on key performance indicators (KPIs) related to sales, customer satisfaction, product efficiency, and more—all without needing any expensive software. Whether you’re a startup or a scaling tech firm, this tool gives you instant access to insights that drive better decisions and measurable growth. ⚡
🔑 Key Features of the Smart Home Industry KPI Dashboard in Google Sheets
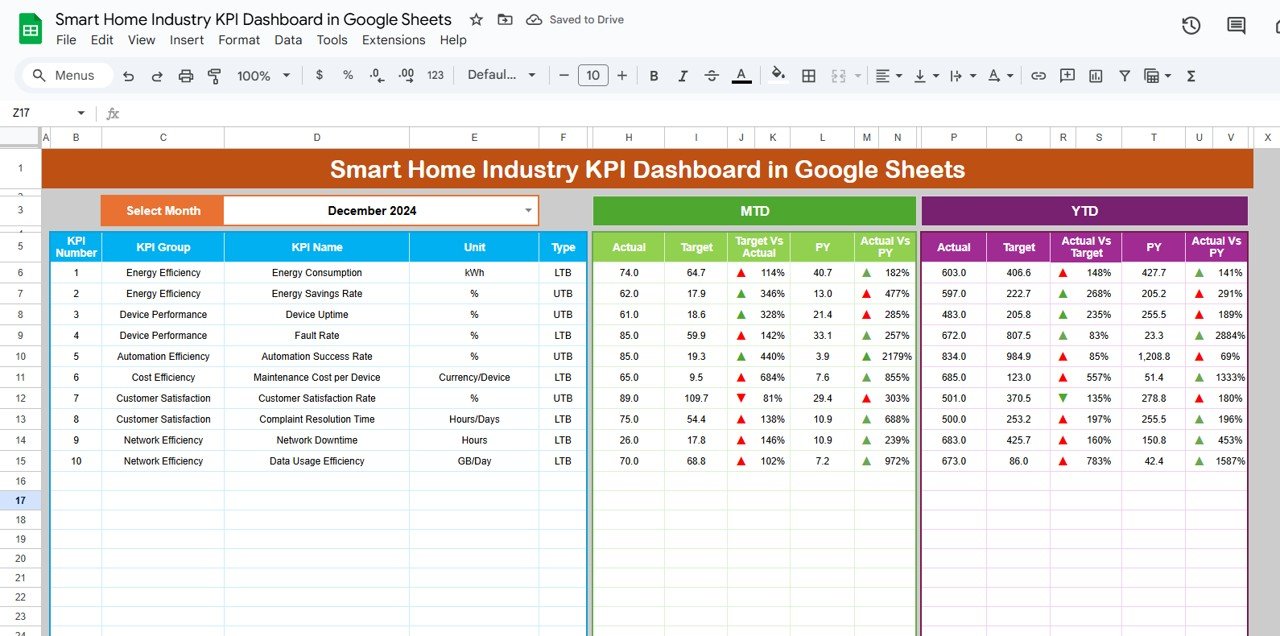
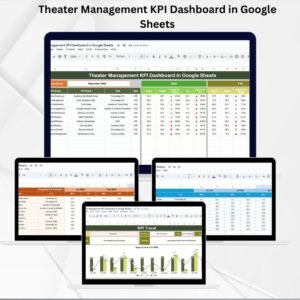
📌 Dynamic Dashboard Sheet
Easily select any month from the dropdown (cell D3) to update all MTD (Month-To-Date) and YTD (Year-To-Date) values. You’ll see:
-
✅ Actuals vs Targets
-
🔄 Previous Year vs Actuals
-
📉 Conditional arrows to show positive/negative trends
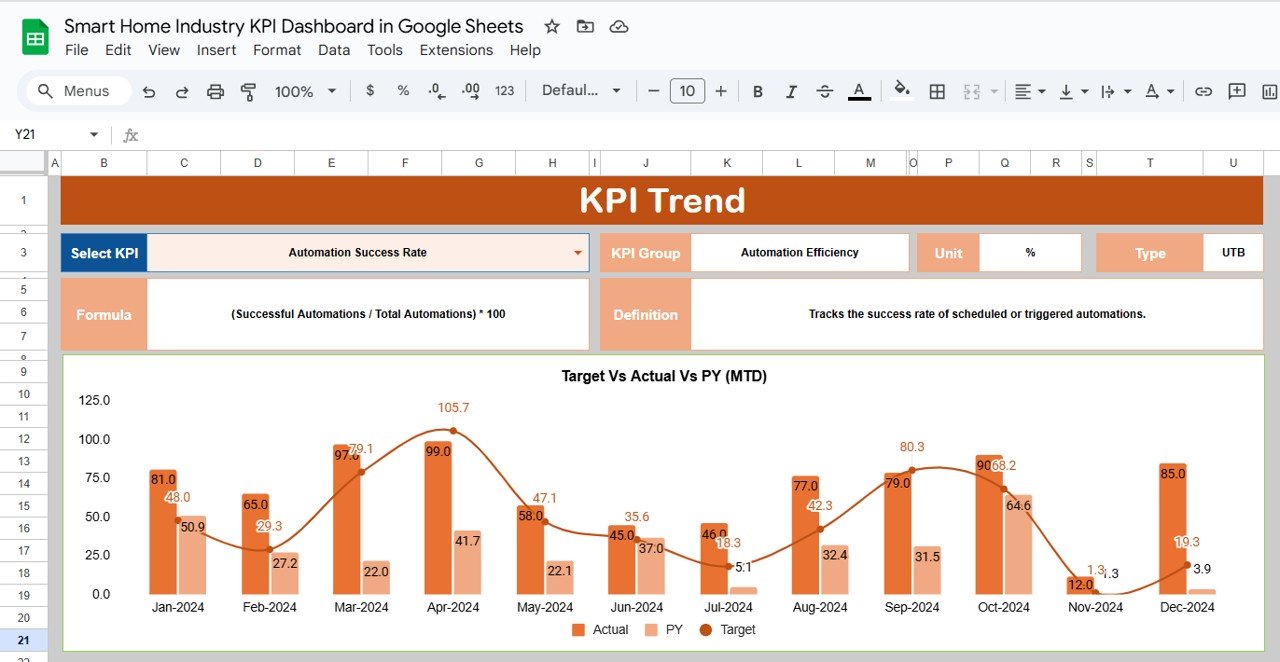
📊 KPI Trend Sheet
Drill down into individual KPIs like Customer Satisfaction or Inventory Turnover. With one click, track monthly trends and understand definitions, formulas, and performance types (Lower the Better or Upper the Better). Great for proactive decision-making! 🧠
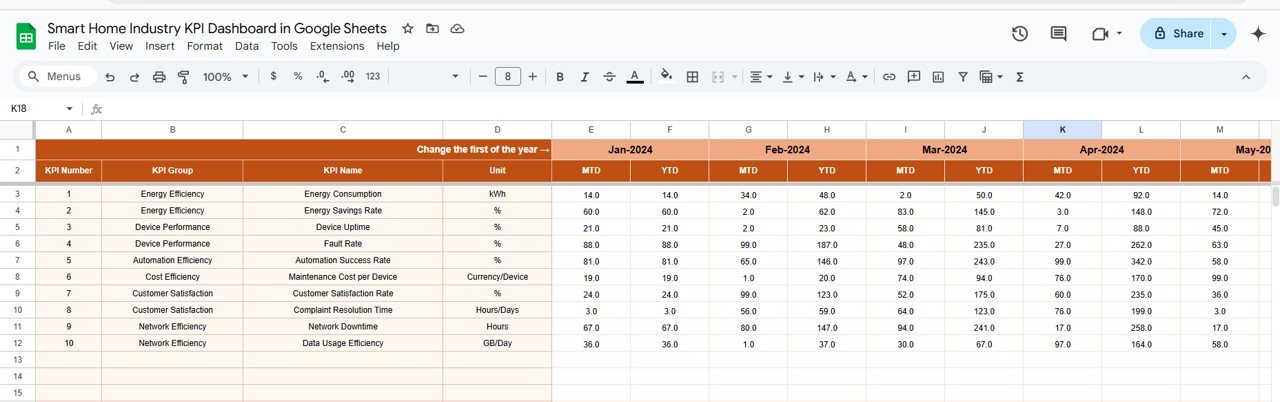
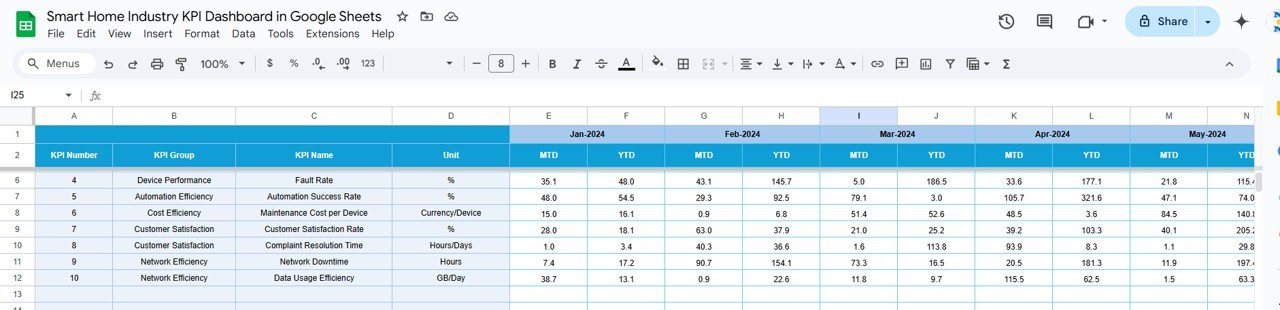
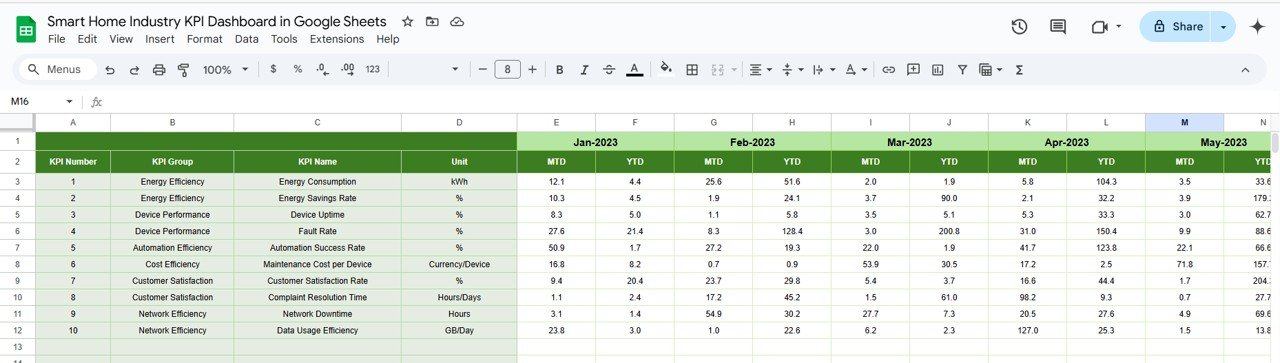
📝 Actual Numbers Sheet
Easily input monthly actual performance values. Change the month using the dropdown in cell E1 to update related dashboards and visual charts.
🎯 Target Sheet Tab
Set clear performance expectations by entering monthly targets for each KPI—track both MTD and YTD effortlessly.
📆 Previous Year Numbers Tab
Enable seamless year-over-year comparisons by entering last year’s data in a structured format.
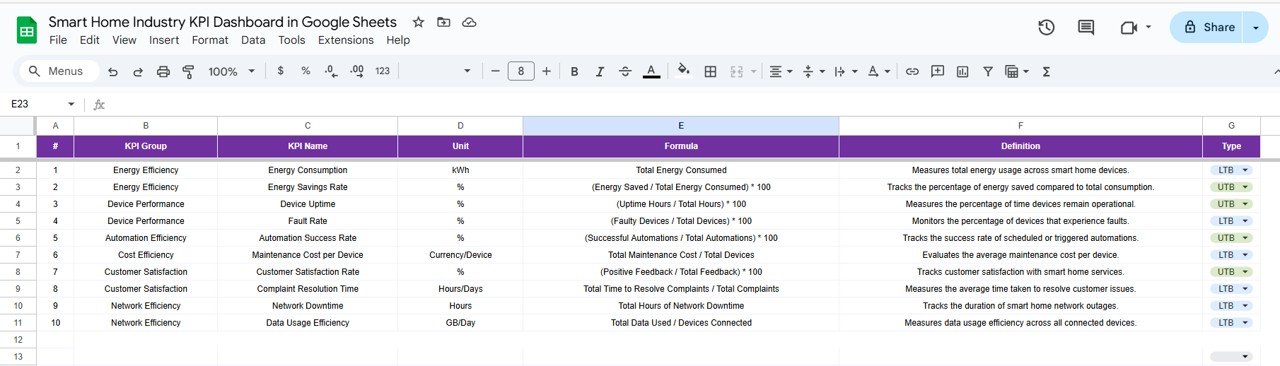
📚 KPI Definition Tab
Keep everyone on the same page with a transparent list of KPI names, groups, units, formulas, and definitions. 💡
📦 What’s Inside the Product
-
✅ Fully Automated Google Sheets Dashboard
-
📉 6 Connected Sheets: Dashboard, KPI Trend, Actuals, Targets, PY Data, KPI Definitions
-
🎯 20+ Pre-built KPIs for Smart Home businesses
-
📊 Conditional Formatting with visual cues
-
🔧 Easy to customize KPIs and formulas
-
☁️ Cloud-based: Access anywhere, anytime
-
🔄 Monthly selector for real-time updates
-
📈 Visual insights without coding or formulas
💡 How to Use the Product
-
Open the Google Sheet and go to the Actual Numbers tab
-
Enter your current month’s performance data
-
Add monthly targets in the Target tab
-
Input prior year values for better benchmarking
-
Select your desired month from the Dashboard tab dropdown
-
Review KPI charts and compare trends in the KPI Trend tab
-
Use insights to take data-driven actions across your teams 🚀
👤 Who Can Benefit from This Dashboard?
🧠 Business Owners – Stay on top of performance and drive strategic actions
📊 Sales & Ops Managers – Track sales, returns, and delivery efficiency
📞 Customer Support Leaders – Monitor satisfaction and issue resolution KPIs
🛠️ Product Teams – Analyze inventory, returns, and product quality
📈 Data Analysts – Visualize trends and discover performance gaps
📱 Startups & Growing Brands – Optimize decisions without needing big-budget tools
🔗 Click here to read the Detailed blog post
Watch the step-by-step video Demo:


Reviews
There are no reviews yet.