
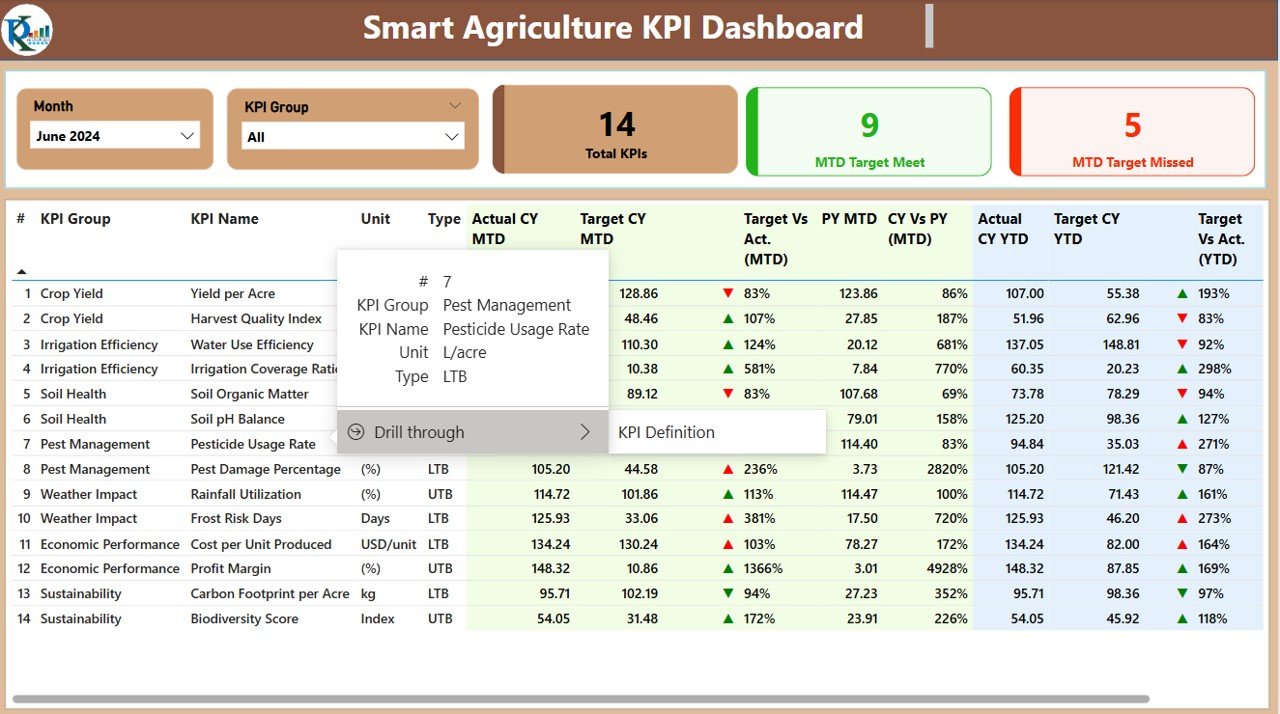


The Smart Agriculture KPI Dashboard in Power BI is a cutting-edge tool designed to help agricultural businesses, farm managers, and agronomists track key performance indicators (KPIs) related to their farming operations. Powered by Power BI, this dashboard integrates data from various sources to provide real-time insights into crop performance, resource usage, weather patterns, and operational efficiency.
This dynamic dashboard is perfect for modernizing agriculture, providing a comprehensive overview of farm management by tracking vital metrics such as crop yields, water usage, soil health, and operational costs. By leveraging data analytics, the Smart Agriculture KPI Dashboard allows you to make informed decisions, improve sustainability, optimize resource usage, and boost profitability.
Key Features of the Smart Agriculture KPI Dashboard in Power BI
🌾 Crop Yield Monitoring
Track the yield of various crops in real-time. Monitor harvest data, evaluate performance, and analyze trends to optimize crop production and improve profitability.
💧 Water Usage Efficiency
Monitor water usage across different crops and farm sections. Analyze water consumption data and implement strategies to reduce waste, conserve resources, and ensure sustainable farming practices.
🌱 Soil Health Metrics
Track soil conditions and fertility levels. Monitor key soil health metrics, including pH, moisture content, and nutrient levels, to ensure optimal growing conditions for your crops.
📊 Operational Efficiency Tracking
Evaluate farm operational metrics such as labor costs, fuel usage, and machinery efficiency. Identify inefficiencies and take corrective actions to optimize farm operations.
🌞 Weather Pattern Insights
Integrate weather data into your farm operations. Analyze seasonal trends and use weather forecasts to plan planting, irrigation, and harvesting schedules more effectively.
📈 Customizable & Scalable Dashboard
Tailor the dashboard to your specific agricultural operations. Add customized KPIs, adjust data sources, and modify visuals to reflect your farm’s unique requirements.
Why You’ll Love the Smart Agriculture KPI Dashboard in Power BI

✅ Optimize Crop Production
Track crop yields and identify areas for improvement. Use data-driven insights to optimize planting strategies and increase crop production efficiency.
✅ Enhance Resource Management
Monitor water usage, soil health, and other key resources to reduce waste, conserve resources, and improve the sustainability of your farm.
✅ Improve Operational Efficiency
Track farm operations, including labor, equipment, and fuel usage, to reduce costs and improve operational efficiency.
✅ Make Data-Driven Decisions
Leverage the insights from the dashboard to make informed decisions, plan effectively, and boost productivity across all areas of your agricultural operations.
✅ Scalable & Adaptable
Whether you’re managing a small farm or a large agricultural enterprise, the Smart Agriculture KPI Dashboard can be scaled and customized to meet the needs of your operations.
What’s Inside the Smart Agriculture KPI Dashboard in Power BI?
-
Crop Yield Monitoring: Track crop production and evaluate trends for each crop.
-
Water Usage Efficiency: Monitor and analyze water consumption for more sustainable farming practices.
-
Soil Health Metrics: Track key soil health metrics to optimize growing conditions.
-
Operational Efficiency: Monitor labor, fuel, and machinery efficiency for cost reduction.
-
Weather Pattern Insights: Analyze weather data to optimize planting and harvesting schedules.
-
Customizable Features: Tailor the dashboard to suit your farm’s specific needs.
How to Use the Smart Agriculture KPI Dashboard in Power BI
1️⃣ Download the Template: Access the Smart Agriculture KPI Dashboard in Power BI instantly.
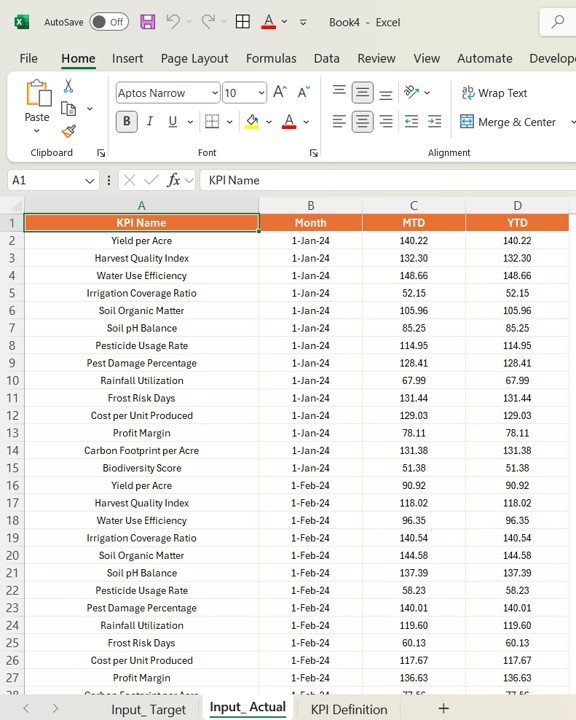
2️⃣ Integrate Your Data Sources: Connect your farm data sources, including crop yields, water usage, and soil health, to the dashboard.
3️⃣ Track & Monitor KPIs: Keep track of crop performance, resource usage, and operational efficiency in real-time.
4️⃣ Analyze Data & Trends: Use time-based analysis to monitor performance and identify trends over different periods.
5️⃣ Optimize Farming Operations: Leverage data-driven insights to improve farming strategies, optimize resource use, and increase profitability.
Who Can Benefit from the Smart Agriculture KPI Dashboard in Power BI?
🔹 Farm Managers & Agricultural Businesses
🔹 Agronomists & Soil Scientists
🔹 Agricultural Consultants
🔹 Crop Production & Harvesting Teams
🔹 Irrigation & Resource Management Teams
🔹 Technology Providers for Agriculture
🔹 Sustainability-focused Agricultural Enterprises
Transform your agricultural operations with the Smart Agriculture KPI Dashboard in Power BI. Track essential KPIs, optimize resource usage, and improve productivity, all while making data-driven decisions to ensure a sustainable and profitable farming future.
Click here to read the Detailed blog post
Visit our YouTube channel to learn step-by-step video tutorials
Youtube.com/@PKAnExcelExpert


Reviews
There are no reviews yet.