In today’s competitive business world, relying on guesswork for revenue decisions is a recipe for missed opportunities. Our Revenue Analysis Dashboard in Power BI is designed to give you instant, accurate, and visually engaging insights into your business performance. Whether you want to track sales, monitor profit margins, evaluate targets, or compare performance across regions, this dashboard delivers the clarity you need to make winning decisions — fast!
✨ Key Features of Revenue Analysis Dashboard in Power BI
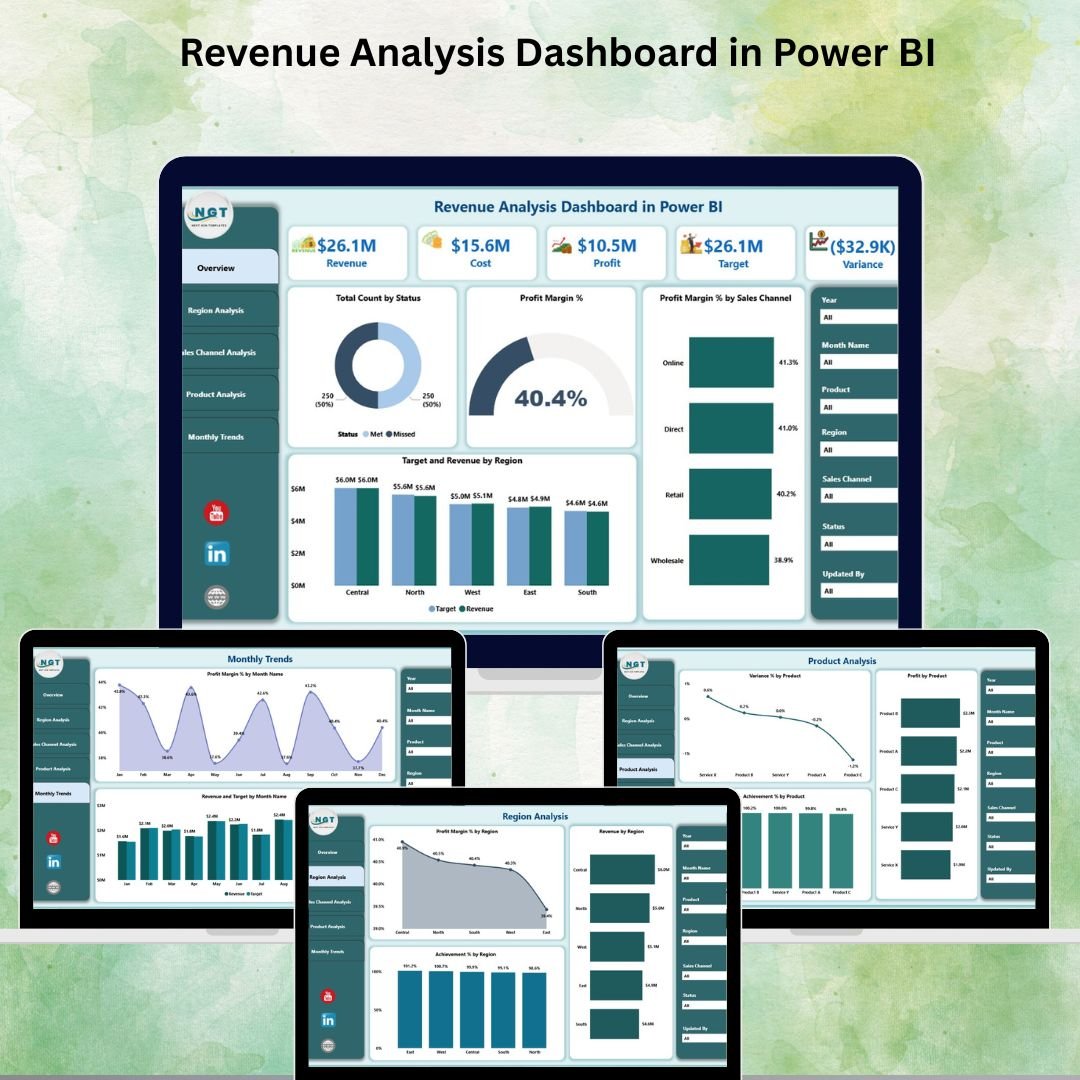
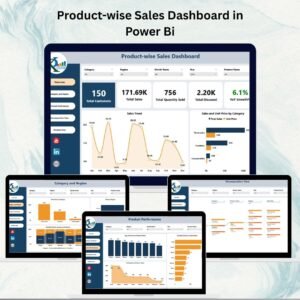
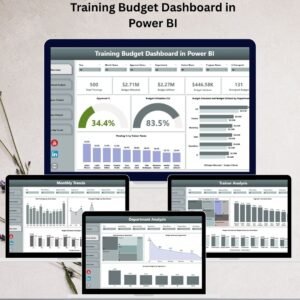
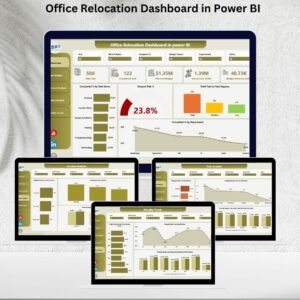
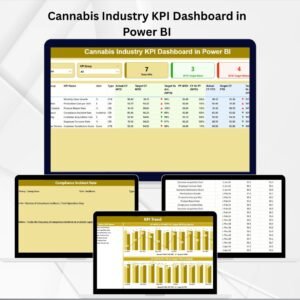
1️⃣ Overview Page – Your Command Center
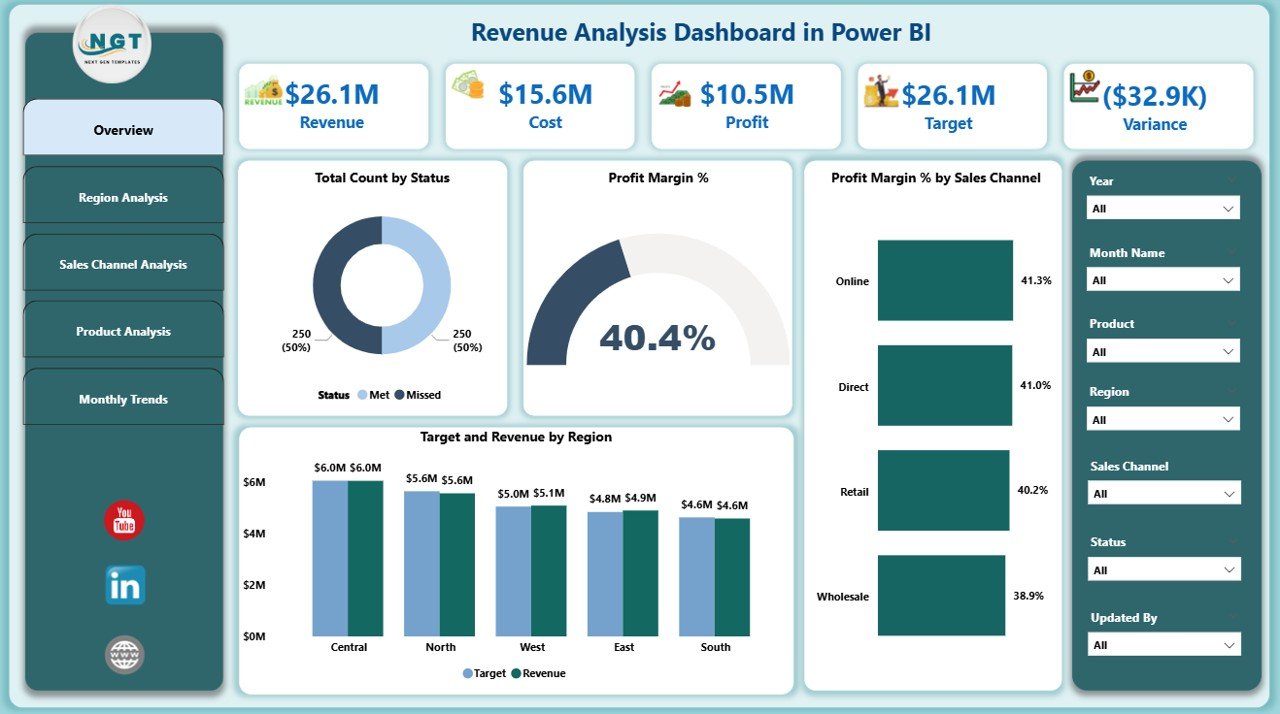
Get the complete picture of your revenue performance at a glance. With 7 interactive slicers for filtering data and 5 KPI cards for essential metrics like Total Revenue, Profit Margin %, Target Achievement %, Number of Orders, and Average Order Value, you can drill down to exactly what matters. The 4 charts — including Target vs Revenue by Region and Profit Margin % by Sales Channel — make decision-making seamless.
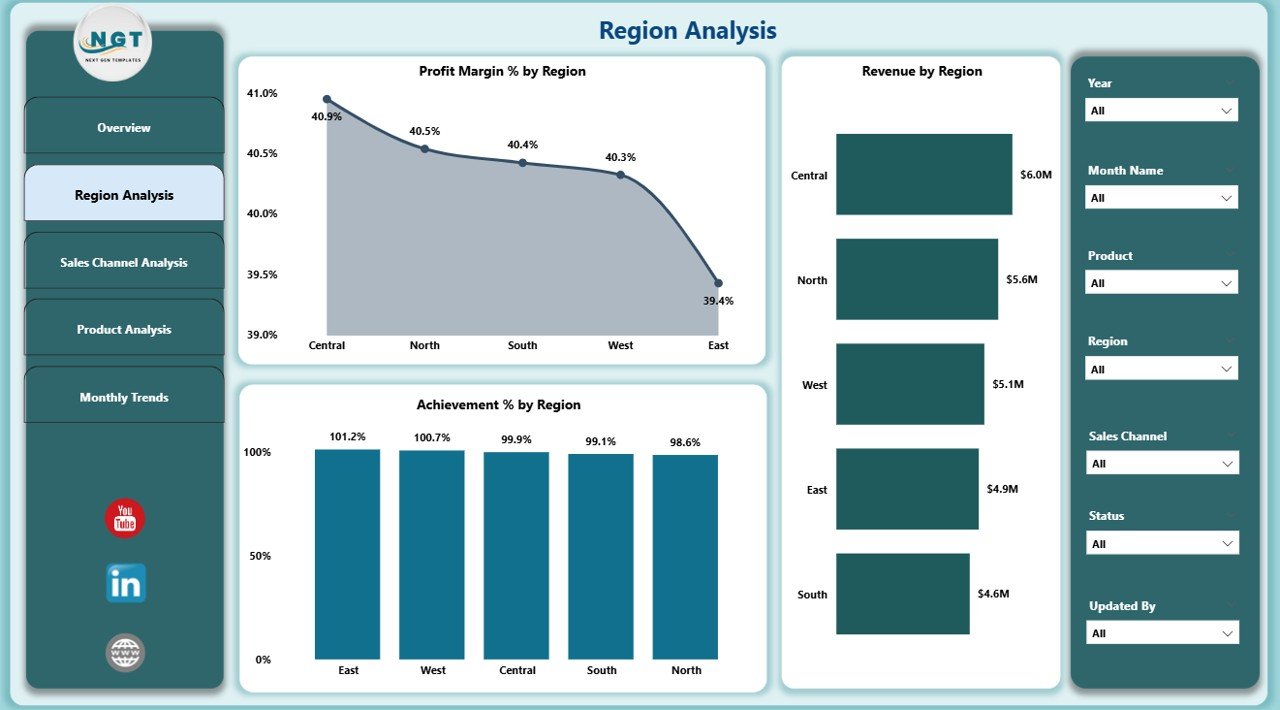
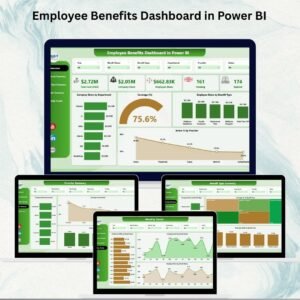
2️⃣ Region Analysis – Location-Based Insights
Identify your top-performing and underperforming regions in seconds. With Profit Margin %, Revenue, and Achievement % by Region, you can channel resources effectively and focus on high-impact areas.
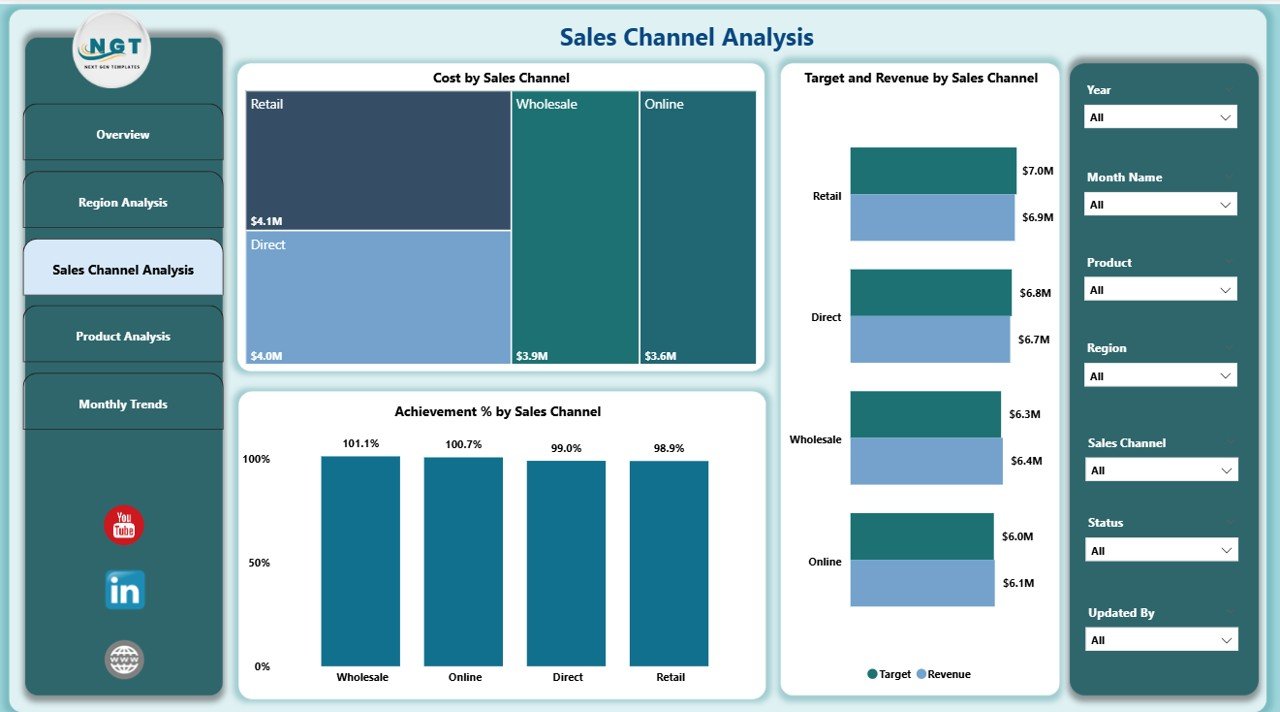
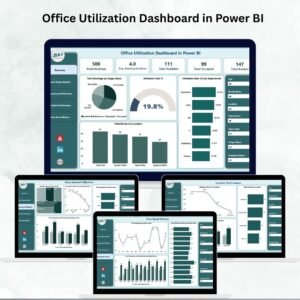
3️⃣ Sales Channel Analysis – Maximize Your ROI
See exactly which channels — online, retail, or wholesale — are driving the most revenue. Compare costs, targets, and achievements to refine your strategy for maximum profitability.
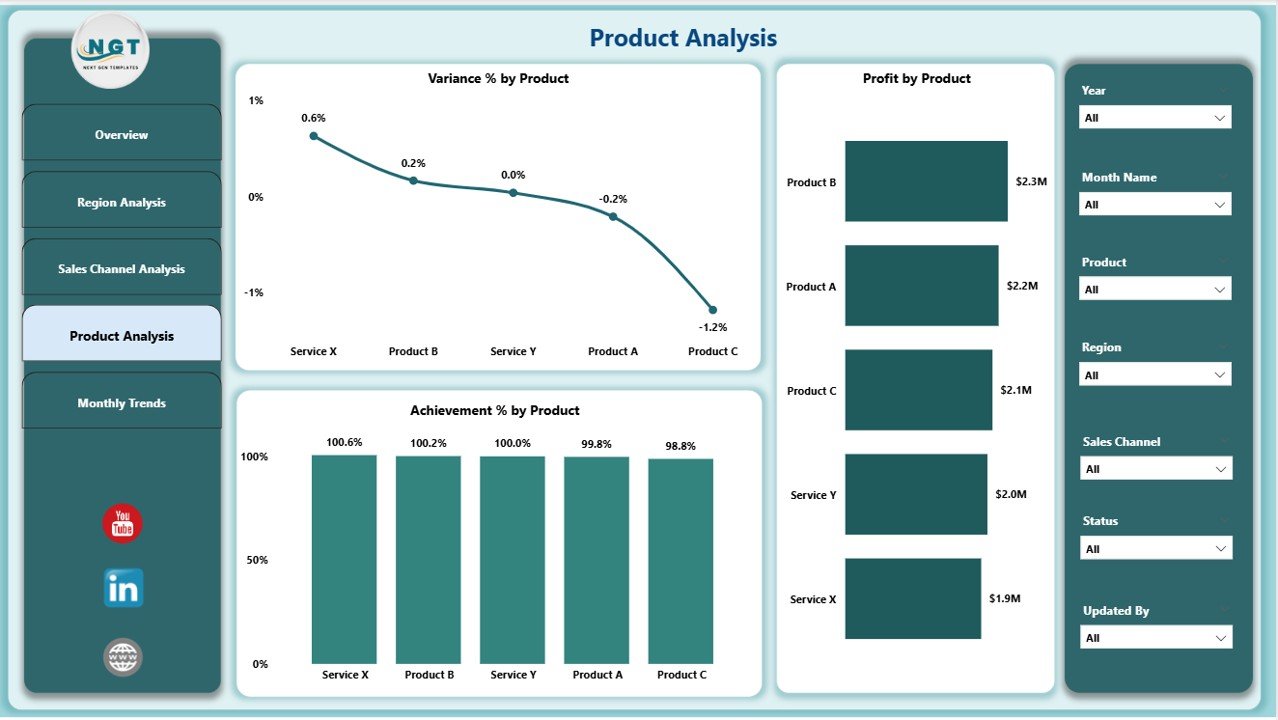
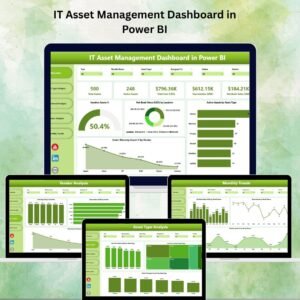
4️⃣ Product Analysis – Track What Sells Best
Analyze product-level performance with Variance %, Profit, and Achievement % by Product. Discover your best-sellers and identify products that need attention to boost revenue.
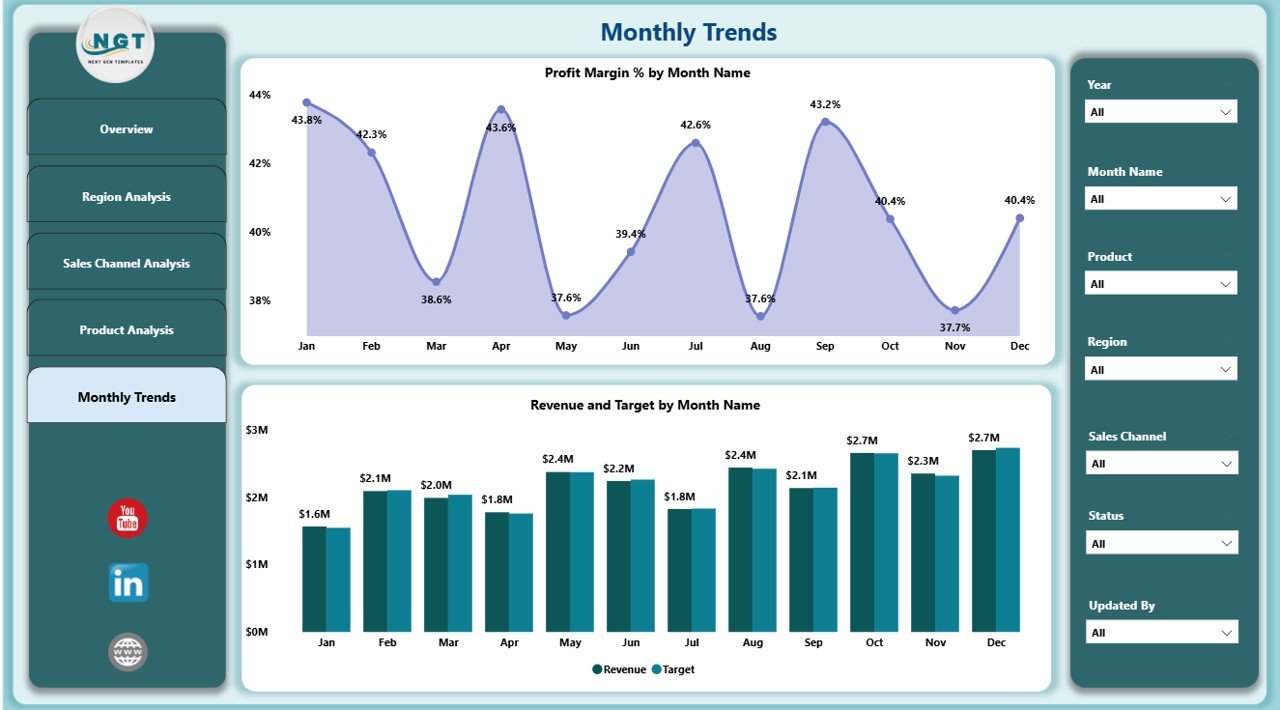
5️⃣ Monthly Trends – Spot Patterns Early
Visualize revenue trends over time with Profit Margin % by Month and Revenue vs Target by Month. This helps you prepare for seasonal demand, slow periods, and peak opportunities.
📦 What’s Inside the Revenue Analysis Dashboard
When you purchase, you get:
-
Power BI (.pbix) file with 5 fully designed analysis pages
-
Pre-connected demo dataset for instant exploration
-
Interactive slicers for custom filtering
-
Professionally formatted visuals for easy reading
-
Editable layout so you can add your own company data
-
Step-by-step guide for connecting to your own data sources
🛠 How to Use the Revenue Analysis Dashboard
-
Open the .pbix File – Download and open in Microsoft Power BI Desktop.
-
Connect Your Data – Link to Excel, SQL, cloud apps, or other sources.
-
Apply Filters – Use slicers to focus on specific dates, products, or regions.
-
Drill Down for Insights – Click visuals to explore deeper layers of data.
-
Share with Your Team – Publish to Power BI Service for real-time collaboration.
👤 Who Can Benefit from This Dashboard
✅ Business Owners & CEOs – Monitor financial health without waiting for reports.
✅ Sales Managers – Track performance against sales targets in real time.
✅ Marketing Teams – Analyze revenue impact from campaigns and channels.
✅ Product Managers – Evaluate product profitability and trends.
✅ Finance Teams – Optimize budgets by identifying high- and low-performing segments.


Reviews
There are no reviews yet.