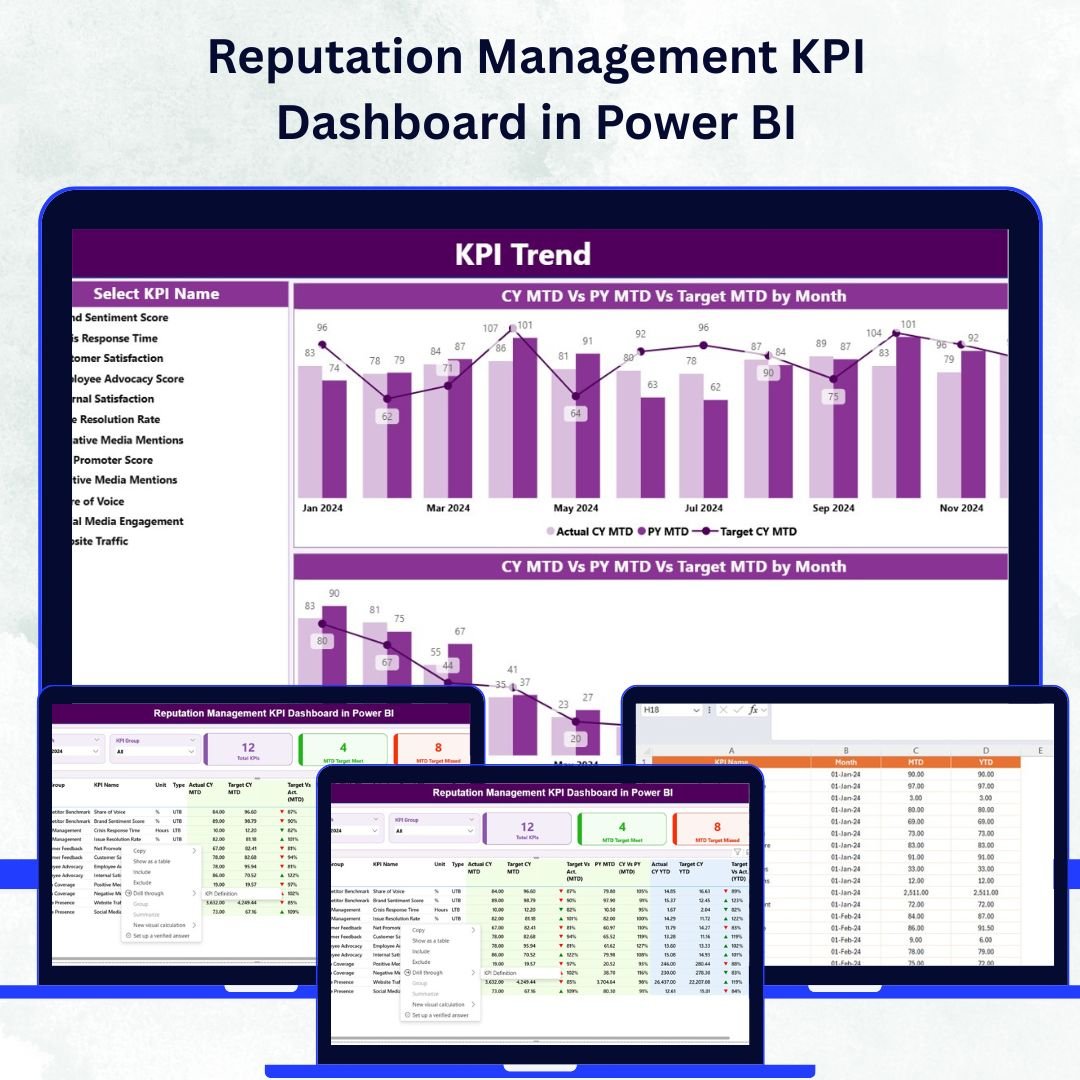
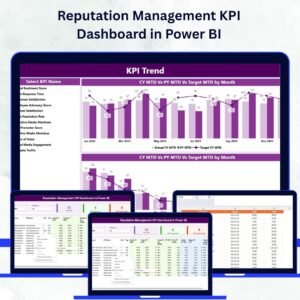
In today’s digital-first era, a brand’s reputation is its most valuable asset. Every review, comment, or social mention can shape public trust and influence purchasing decisions. The Reputation Management KPI Dashboard in Power BI is a powerful, data-driven tool designed to help businesses monitor, analyze, and enhance their brand image through insightful metrics and interactive visuals.
With this dynamic dashboard, you can easily track customer sentiment, feedback quality, and online engagement across different periods — all within an intuitive Power BI interface. Whether you’re managing one brand or several, this tool helps you turn data into strategy and reputation into measurable success.Reputation Management KPI Dashboard in Power BI
✨ Key Features of Reputation Management KPI Dashboard in Power BI
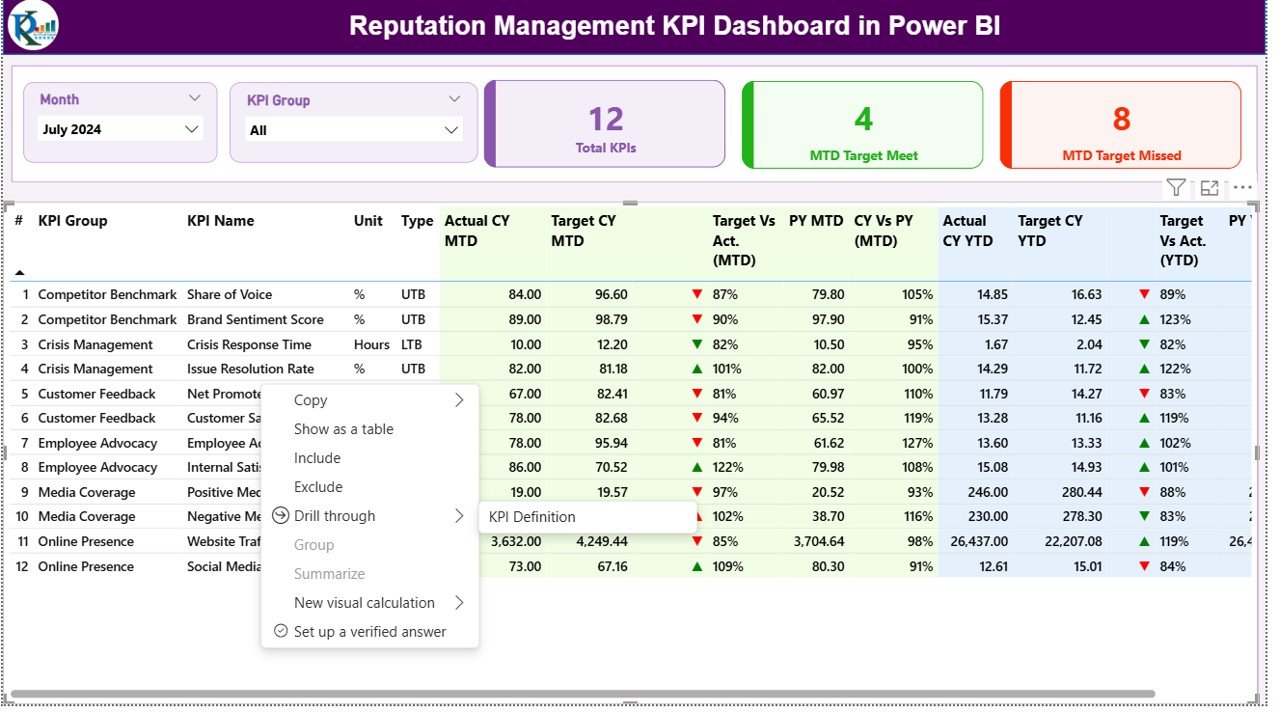
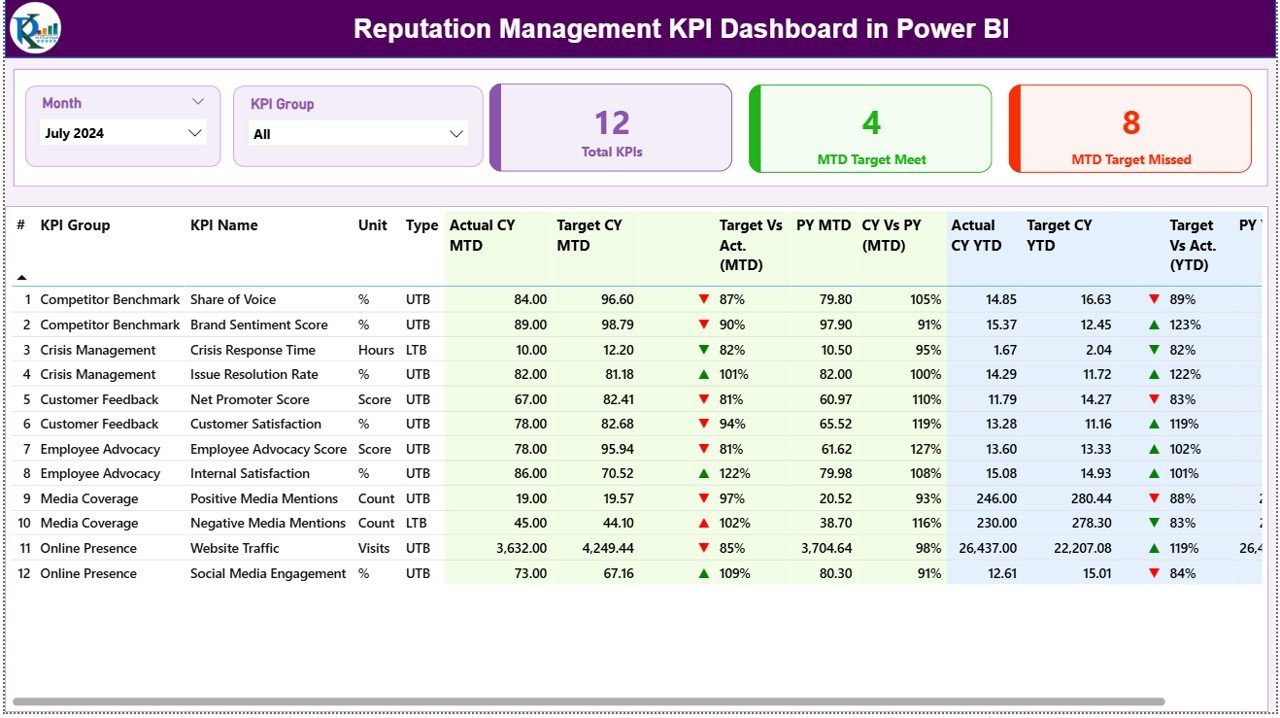
✅ Comprehensive Summary Page:
View your brand’s overall reputation performance at a glance. The Summary Page includes slicers for month and KPI groups, making it easy to filter and analyze the metrics that matter most.
✅ Insightful KPI Cards & Tables:
Get instant visibility into Total KPIs, Month-to-Date (MTD) Target Met or Missed counts, and detailed performance tables showing comparisons between actual, target, and previous-year data.
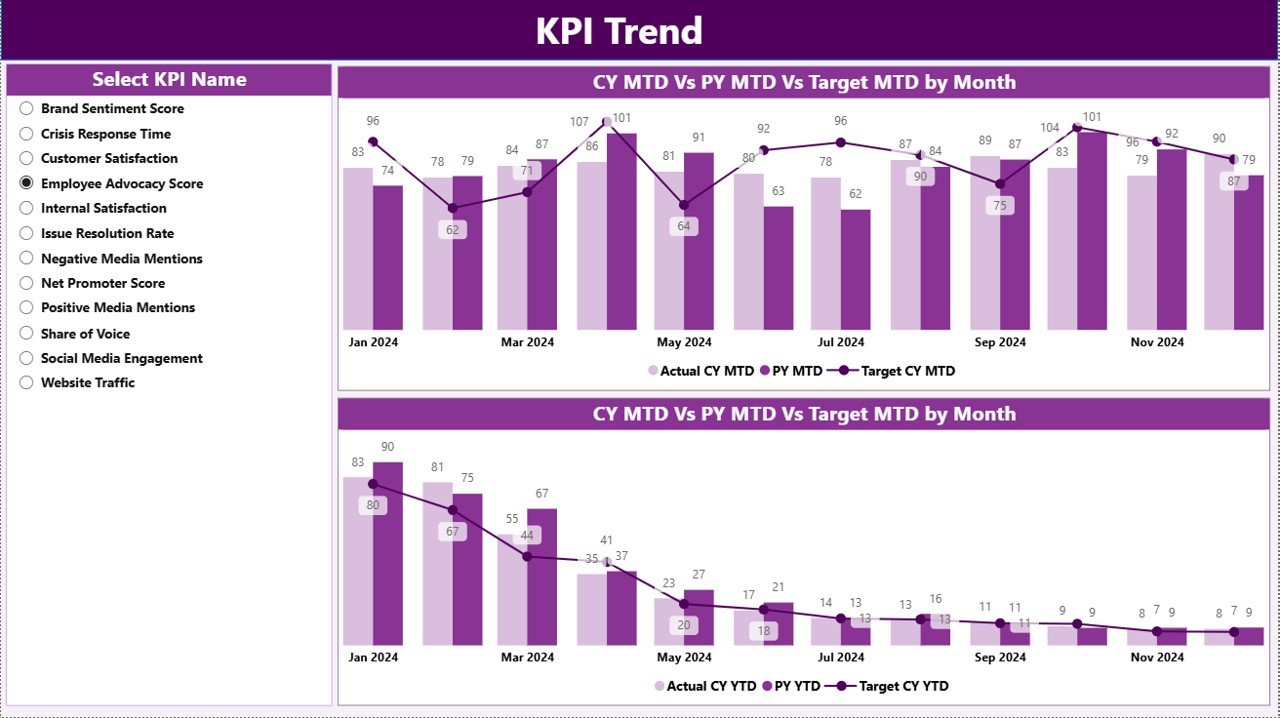
✅ Trend Analysis Page:
Visualize MTD and YTD KPI trends using sleek combo charts. Spot seasonal shifts, growth patterns, and performance dips with ease.
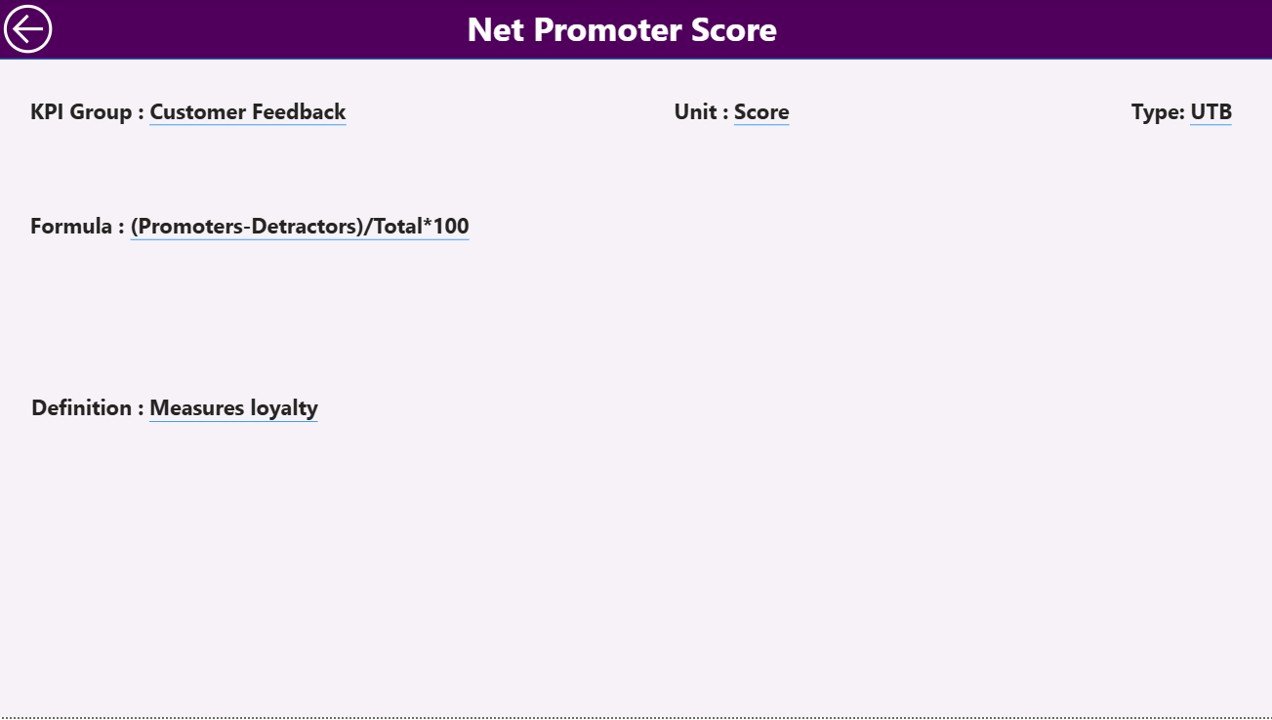
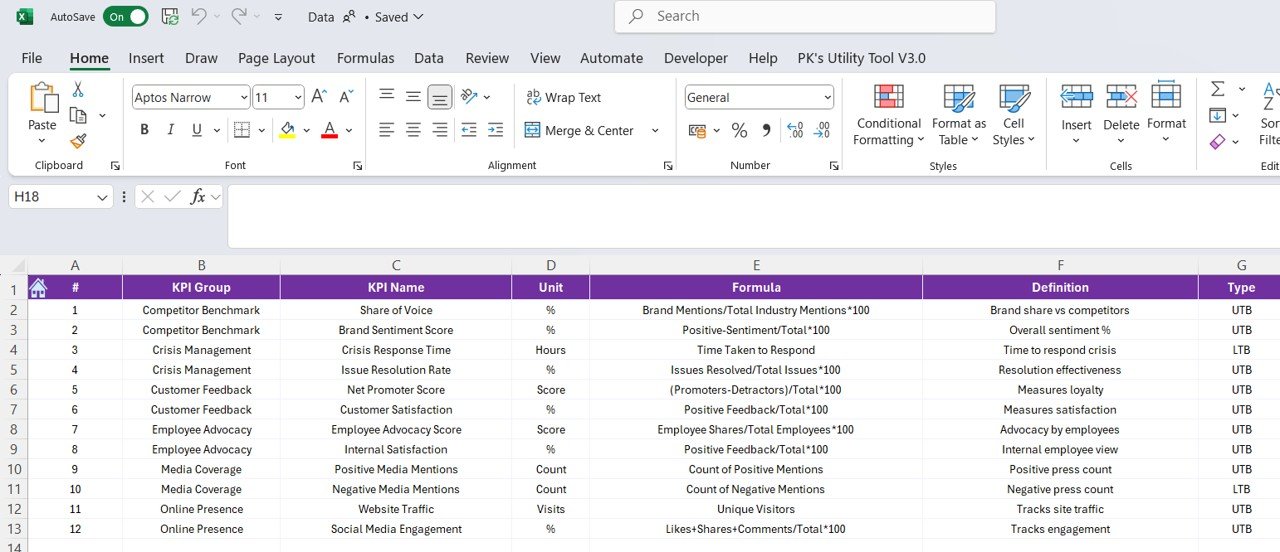
✅ Drill-Through KPI Definition Page:
Right-click any KPI to access its detailed definition, formula, and type (UTB or LTB). This ensures full clarity and consistency across teams.
✅ Seamless Excel Integration:
Update your Excel sheets — Actual, Target, and Definition — and let Power BI automatically refresh all visuals. No coding required, just plug and play.Reputation Management KPI Dashboard in Power BI
✅ Data Transparency:
Ensure every team member understands performance logic, KPI purpose, and benchmarks with a standardized definition structure.
📦 What’s Inside the Reputation Management KPI Dashboard
🧮 Summary Page: The central hub for key metrics with slicers and performance cards.
📈 KPI Trend Page: Displays both MTD and YTD trends for selected KPIs.
📘 KPI Definition Page: Drill-through screen that explains KPI meaning and calculation logic.
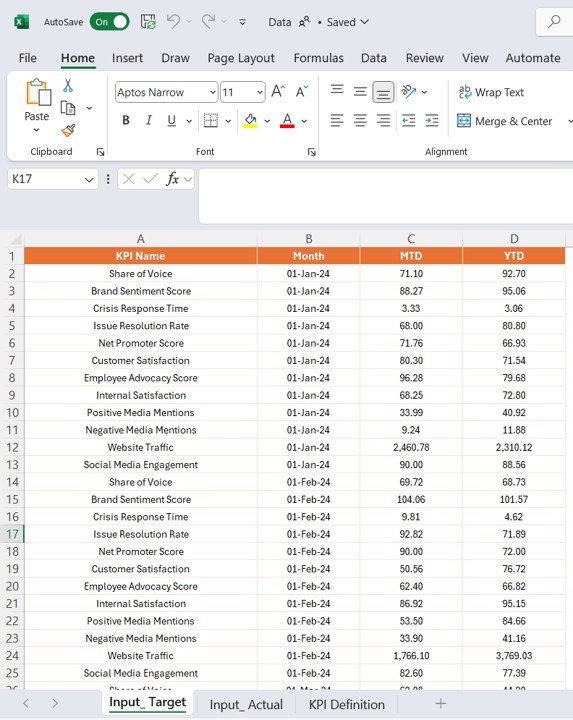
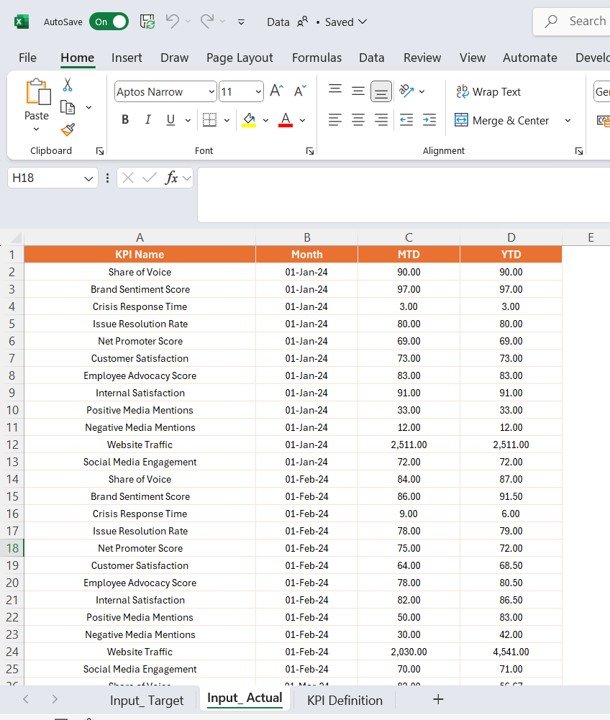
📊 Excel Source File: Prestructured with three sheets — Actual, Target, and KPI Definition.
🎯 Interactive Visuals: Color-coded arrows (▲▼) instantly show progress and areas of concern.
🔗 Automation Ready: Power BI refresh ensures your insights are always up-to-date.Reputation Management KPI Dashboard in Power BI
This structured layout ensures your brand managers and executives can effortlessly analyze reputation data in real time.
🛠️ How to Use the Reputation Management KPI Dashboard
1️⃣ Prepare Your Excel Data:
Enter your Actual and Target values in the provided Excel sheets.
2️⃣ Load the Data into Power BI:
Import the Excel file and refresh the dashboard visuals automatically.
3️⃣ Use Slicers for Dynamic Analysis:
Filter results by month or KPI group to get targeted insights.
4️⃣ Drill Through for KPI Details:
Right-click any KPI to explore formulas, definitions, and performance type.
5️⃣ Monitor & Update Monthly:
Regularly refresh data to ensure real-time tracking of reputation trends.
6️⃣ Share with Teams:
Publish the report to Power BI Service or Microsoft Teams for collaborative insights.
👥 Who Can Benefit from This Reputation Management KPI Dashboard
🏢 Marketing Teams:
Track sentiment trends, brand engagement, and campaign feedback efficiently.
💬 Customer Service Managers:
Analyze response time, service quality, and satisfaction scores to improve client experience.
📊 Business Analysts:
Use trend charts and tables to identify data-driven improvement opportunities.
📈 Senior Executives:
Monitor overall brand health, reputation growth, and risk areas across departments.
🌐 Digital Marketing Agencies:
Manage multiple clients’ reputation metrics in one centralized Power BI environment.
This tool is perfect for anyone serious about maintaining a trustworthy brand image and driving customer loyalty through measurable data insights.


Reviews
There are no reviews yet.