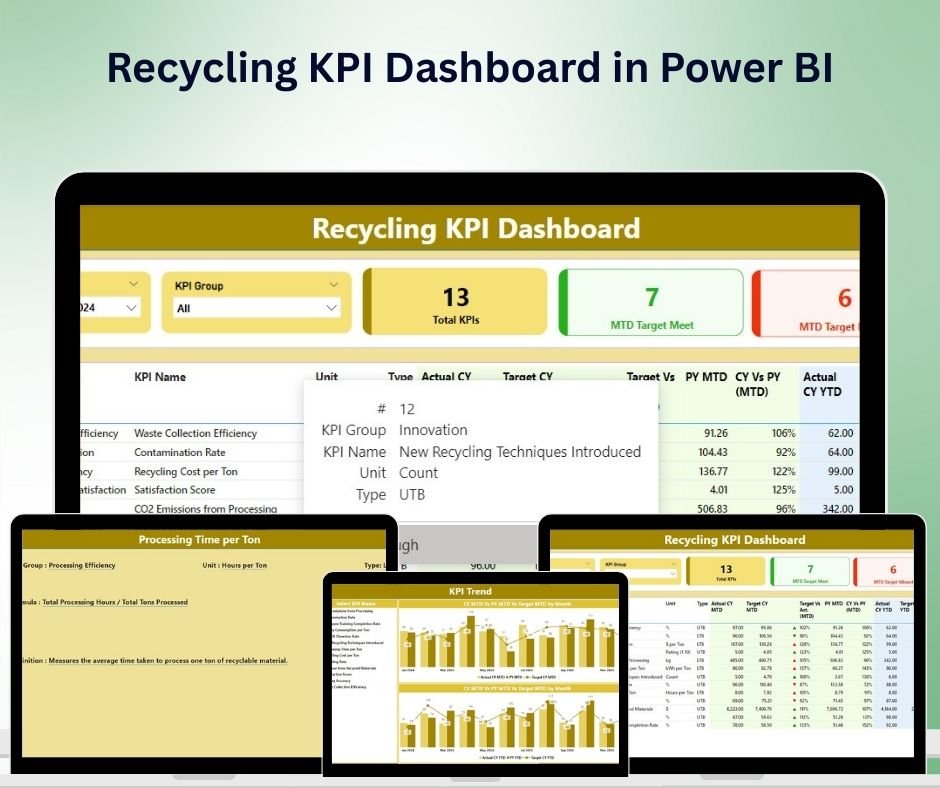

The Recycling KPI Dashboard in Power BI is an innovative and interactive tool designed for waste management and recycling organizations. Whether you are managing a small community recycling program or overseeing a large-scale recycling facility, this Power BI dashboard provides essential insights into the effectiveness of your recycling efforts. It allows you to track key performance indicators (KPIs) related to waste collection, recycling rates, operational efficiency, financial performance, and environmental impact.
With customizable features and real-time reporting, this dashboard enables you to optimize your recycling operations, improve waste diversion strategies, and increase the overall success of your recycling initiatives.

Key Features of the Recycling KPI Dashboard in Power BI:
♻️ Recycling Rate Tracking
Monitor recycling rates for various materials, such as plastics, paper, metals, and organics, to ensure that your program is achieving optimal recycling outcomes.
💰 Revenue and Cost Analysis
Track revenue from recycled materials, waste disposal fees, and government subsidies, while also monitoring operational costs to ensure financial sustainability.
📊 Waste Collection and Diversion Metrics
Track waste collection volumes, diversion rates, and tonnage metrics to measure your program’s effectiveness in diverting waste from landfills.
🌱 Environmental Impact Monitoring
Track key environmental indicators such as carbon footprint reduction and energy savings to assess the environmental impact of your recycling program.
🔧 Operational Efficiency Tracking
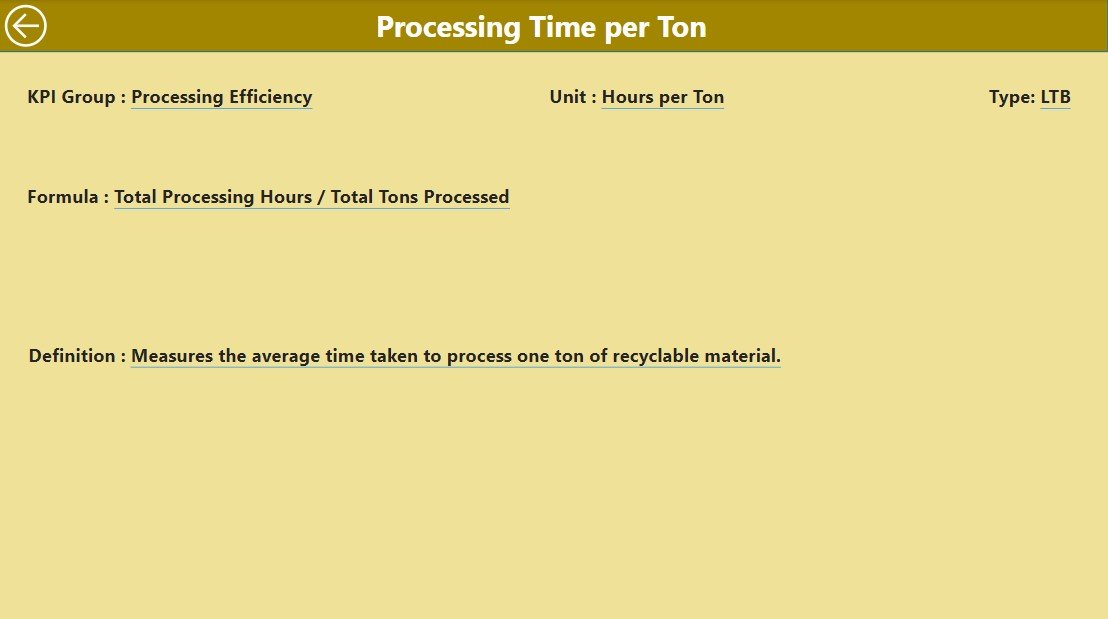
Monitor operational efficiency metrics, including collection frequency, sorting accuracy, and processing time, to identify areas for improvement in your recycling operations.
🚀 Why You’ll Love the Recycling KPI Dashboard in Power BI:
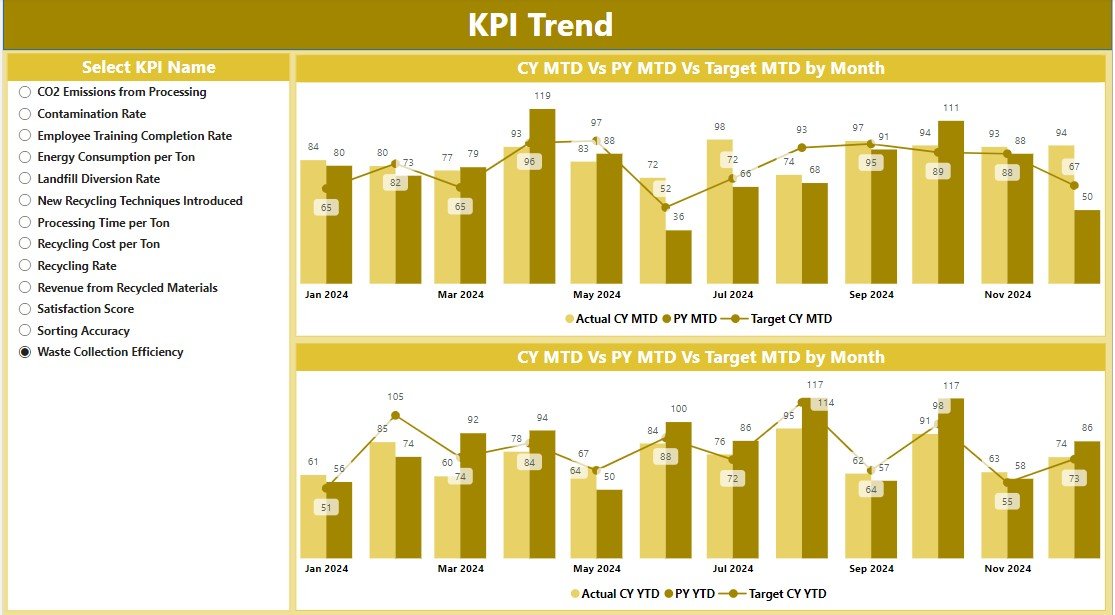
✅ Monitor Recycling Rates – Track the recycling rates for different materials to ensure your program is maximizing waste diversion.
✅ Evaluate Financial Health – Monitor revenue from recycling programs and analyze operational costs to ensure financial viability and sustainability.
✅ Track Waste Collection Efficiency – Measure waste collection volumes, diversion rates, and tonnage to evaluate program effectiveness.
✅ Assess Environmental Impact – Monitor key environmental metrics to measure the positive impact of your recycling program on the environment.
✅ Fully Customizable and Interactive – Tailor the dashboard to suit your specific recycling program needs, with real-time data visualizations and interactive reports.
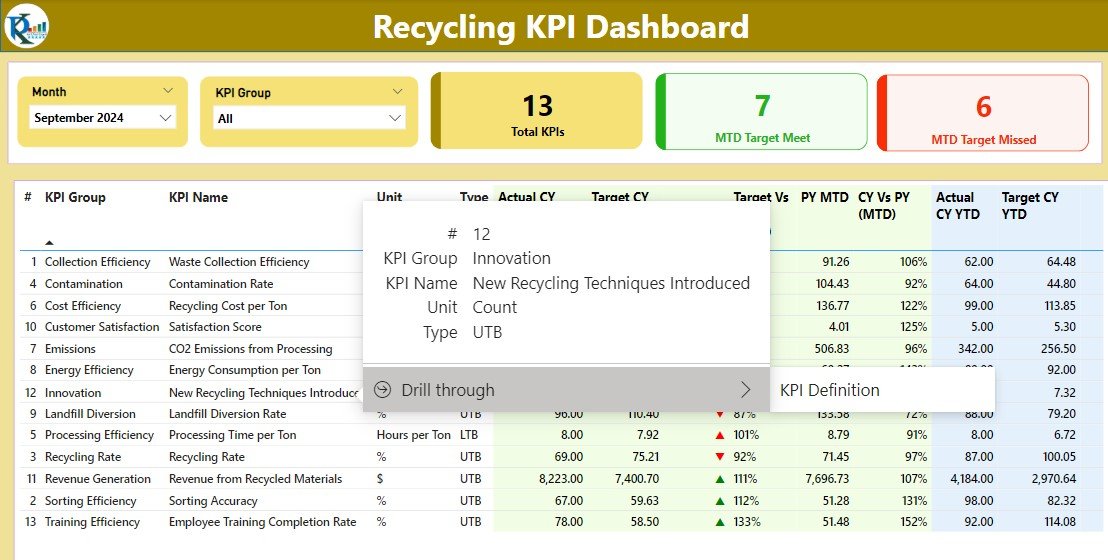
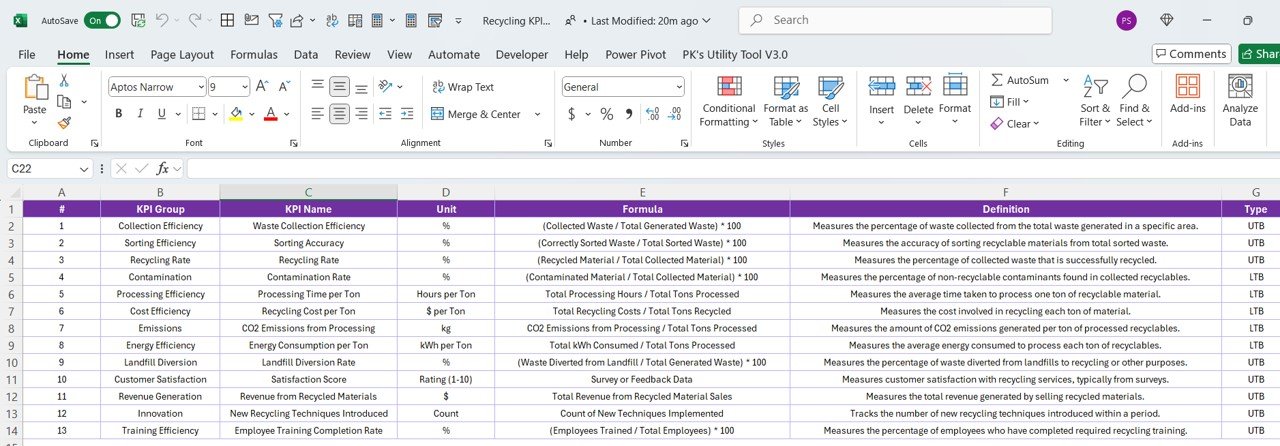
What’s Inside the Recycling KPI Dashboard in Power BI:
-
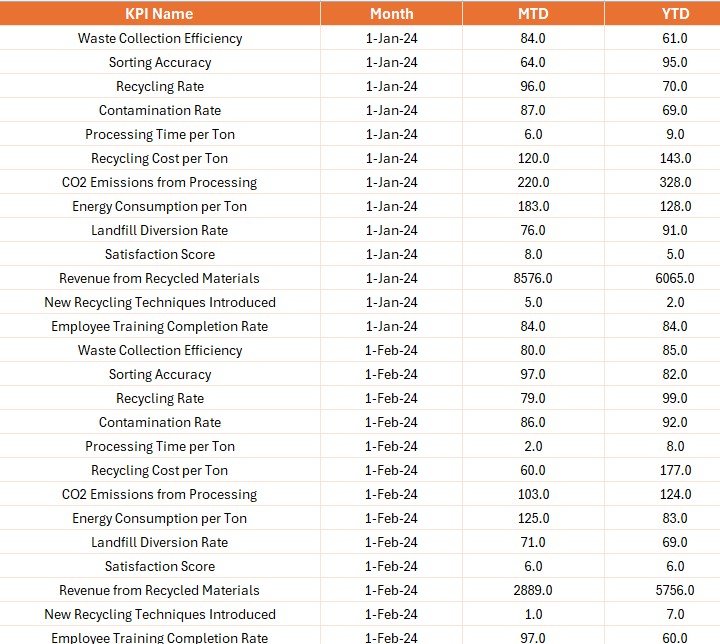
Recycling Rates: Track the recycling rates for different materials such as plastic, paper, glass, and metals to measure the effectiveness of your recycling efforts.
-
Revenue and Costs: Monitor revenue from recycled materials, disposal fees, and government incentives, and track operational costs to ensure financial sustainability.
-
Waste Collection and Diversion Metrics: Track the volume of waste collected, diversion rates, and tonnage of materials recycled to assess program performance.
-
Environmental Impact: Track reductions in carbon footprint, energy saved, and other key environmental benefits to demonstrate the positive impact of your recycling program.
-
Operational Efficiency: Monitor metrics such as collection frequency, sorting accuracy, and processing times to ensure operational efficiency and identify areas for improvement.
-
Custom Reports: Generate detailed reports on waste collection, recycling rates, financials, and environmental impact for strategic decision-making and performance optimization.
How to Use the Recycling KPI Dashboard in Power BI:
1️⃣ Download the Power BI Template – Instantly access your Power BI file upon purchase.
2️⃣ Input Your Data – Add data on waste collection, recycling rates, revenue, and operational metrics to start tracking key performance indicators.
3️⃣ Track Recycling Rates – Use the dashboard to monitor the effectiveness of your recycling efforts for different materials.
4️⃣ Analyze Financial Performance – Track revenue and costs to ensure that your recycling program is financially sustainable.
5️⃣ Generate Reports – Create custom reports to track waste diversion, environmental impact, and operational efficiency, and make data-driven decisions to improve your program.
Who Can Benefit from the Recycling KPI Dashboard in Power BI:
-
Recycling Program Managers
-
Waste Management Organizations
-
Environmental NGOs
-
Government Agencies Handling Recycling Initiatives
-
Financial Analysts in Environmental Services
-
Municipal Waste Management Services
-
Corporate Sustainability Departments
-
Sustainability Consultants
-
Non-Profit Organizations Focused on Recycling
-
Recycling Facility Operators
The Recycling KPI Dashboard in Power BI is the perfect tool to help you optimize your recycling operations, measure success, and demonstrate the positive impact of your recycling program. With real-time insights into key performance metrics such as recycling rates, financial performance, and environmental impact, this dashboard ensures that your recycling efforts are both effective and sustainable.
Click here to read the Detailed blog post
https://www.pk-anexcelexpert.com/recycling-kpi-dashboard-in-power-bi/
Visit our YouTube channel to learn step-by-step video tutorials
Youtube.com/@PKAnExcelExpert


Reviews
There are no reviews yet.