In the fast-paced world of real-estate development, data is everything. From project budgets and timelines to occupancy rates and ROI, decisions depend on accurate, real-time insights. But managing multiple spreadsheets and reports manually can slow you down — leading to missed deadlines and costly mistakes.
That’s where the Real Estate Development KPI Dashboard in Power BI transforms how you work 🏢📊.
This ready-to-use dashboard gives developers, investors, and project managers a unified visual platform to monitor performance across every stage — planning, construction, and sales. Built in Power BI and powered by Excel data, it connects, cleans, and visualizes information automatically — turning raw figures into interactive insights you can trust.
Whether you manage one property or a portfolio of developments, this dashboard ensures every metric is measurable, transparent, and actionable.
⚙️ Key Features of the Real Estate Development KPI Dashboard in Power BI
📊 3 Interactive Pages – Summary, KPI Trend & KPI Definition.
🎯 Dynamic Slicers – Filter by Month and KPI Group instantly.
📈 MTD & YTD Tracking – View Month-to-Date and Year-to-Date performance.
🟢 Visual Cards & Color Indicators – See targets met or missed at a glance.
🔍 Drill-Through Insights – Access formulas and definitions for every KPI.
💡 Excel Data Integration – Simple to update and refresh with one click.
🏗️ Real-Estate Specific KPIs – Cost variance, completion rate, ROI, sales performance, and occupancy.
⚙️ Customizable Structure – Add new KPIs or visuals to match your project needs.
💰 Scalable & Shareable – Works for small developers and large investment groups alike.
📦 What’s Inside the Dashboard Template
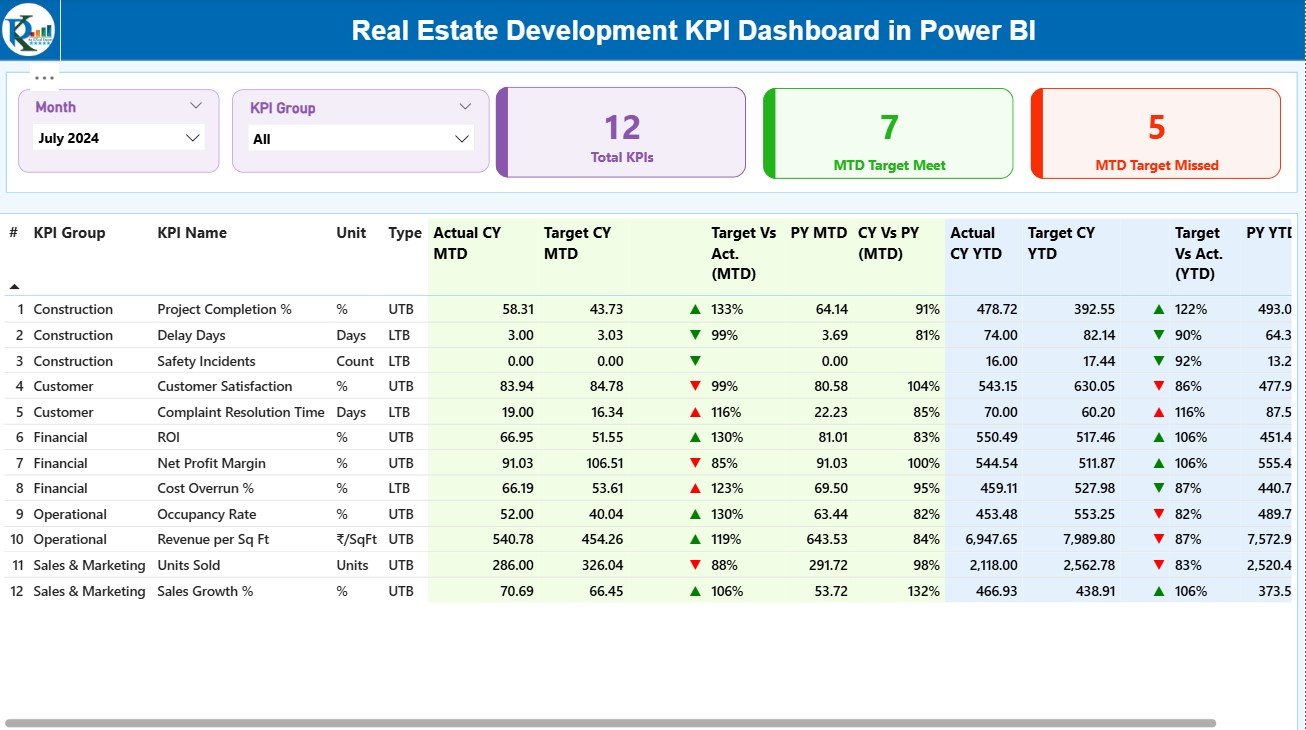
1️⃣ Summary Page – Your Performance Command Center
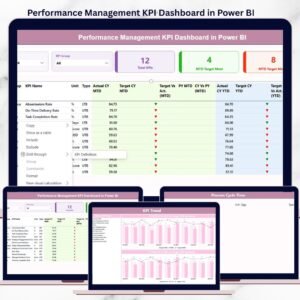
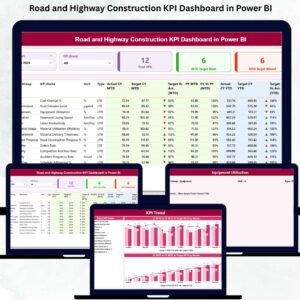
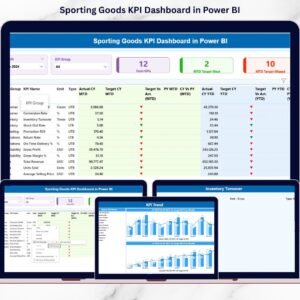
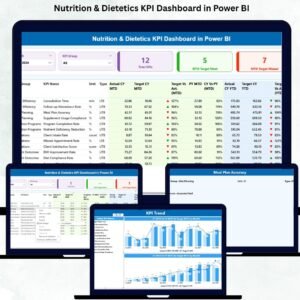
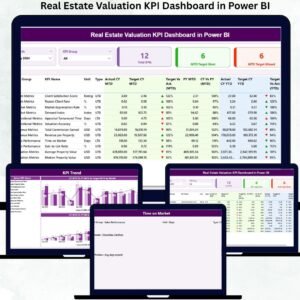
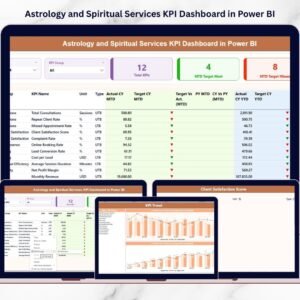
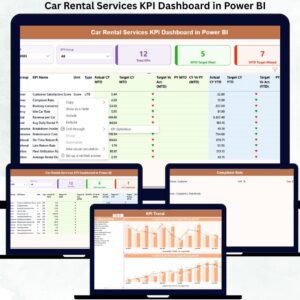
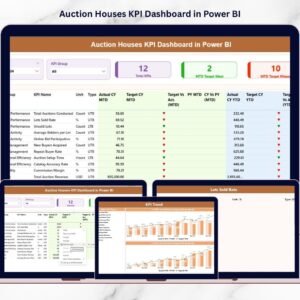
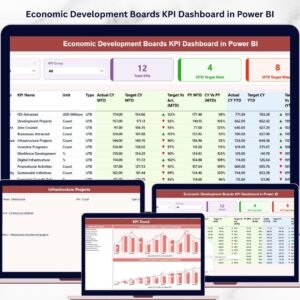
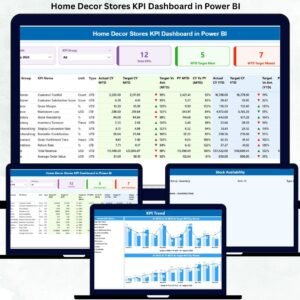
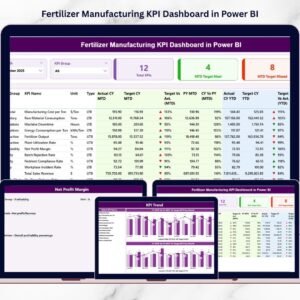
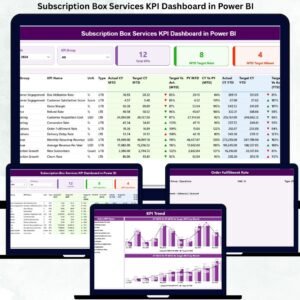
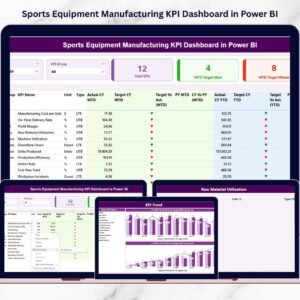
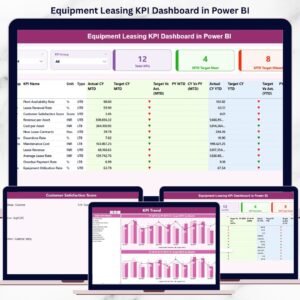
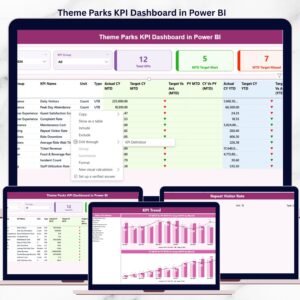
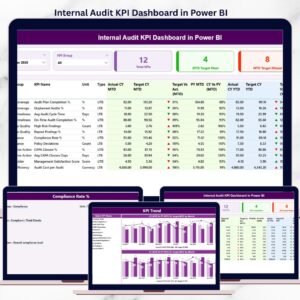
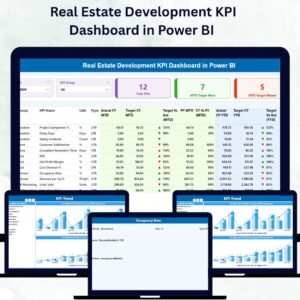
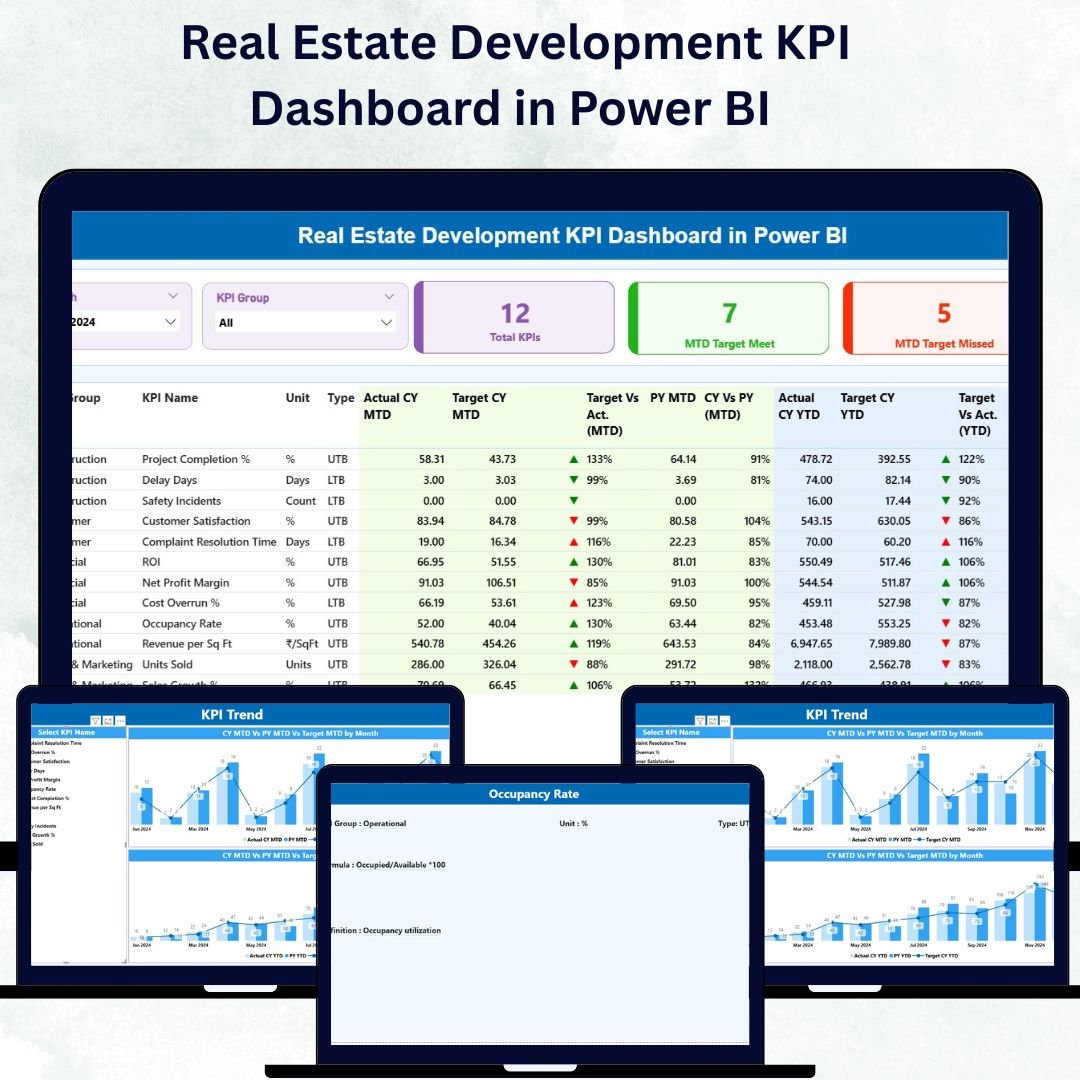
This main page consolidates every key indicator into one dashboard.
Month & KPI Group Slicers: Filter data by time and category.
Top 3 Cards: Total KPIs Tracked | MTD Targets Met | MTD Targets Missed.
Comprehensive KPI Table: Shows Actual, Target, and Previous Year numbers for both MTD and YTD along with arrows and color signals for quick interpretation.
It’s your all-in-one dashboard for construction progress, sales growth, and budget efficiency.
2️⃣ KPI Trend Page – Visualize Performance Over Time
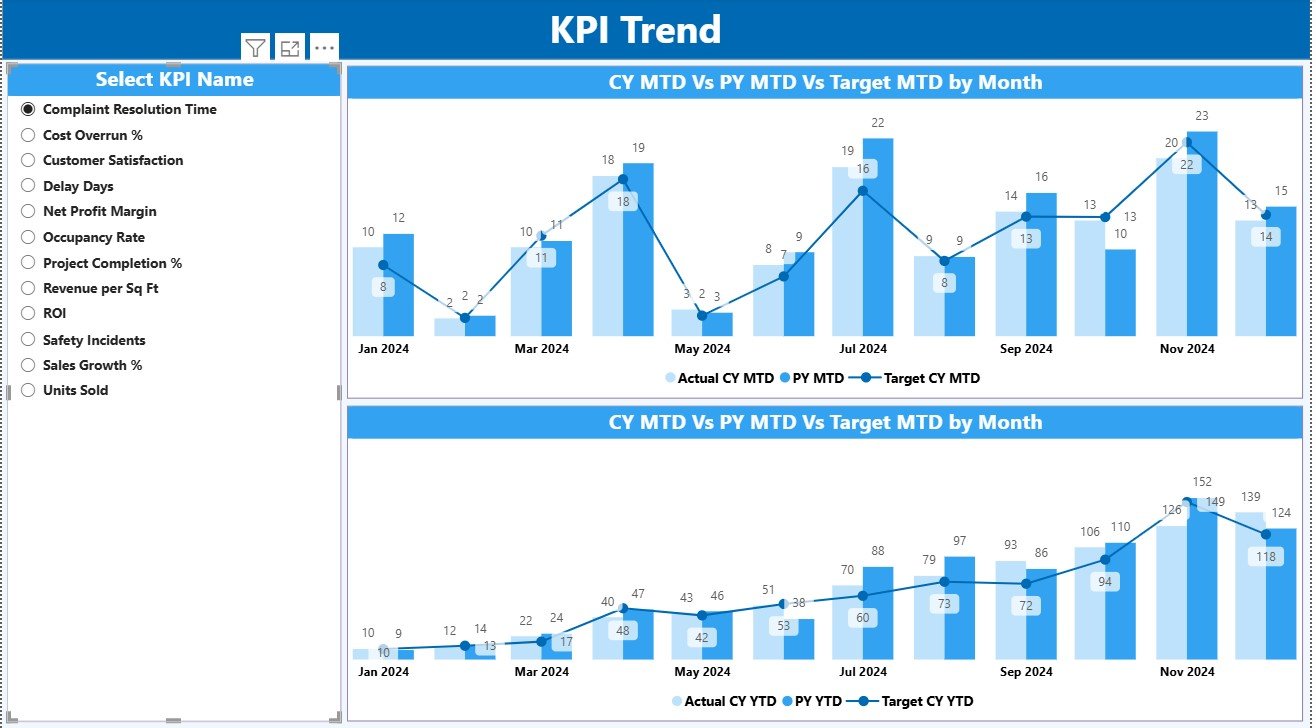
Analyze short-term and long-term movements with ease.
Select any KPI from the slicer.
Two combo charts display Actual vs Target vs Previous Year for MTD and YTD.
Instantly see which KPIs are rising or falling.
Perfect for tracking cost trends, project timelines, and return ratios 📈.
3️⃣ KPI Definition Page – Your Reference Library
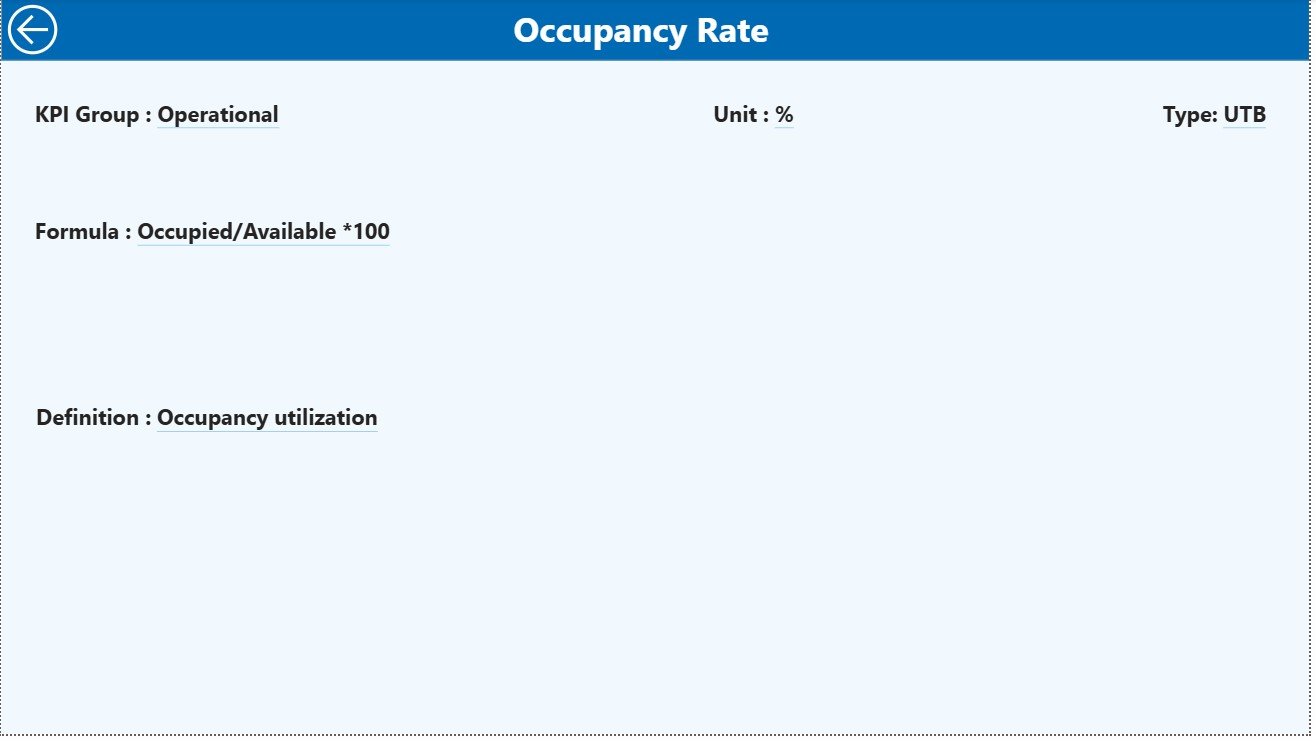
Access detailed definitions, formulas, and calculation logic for each KPI.
A built-in Back Button brings you to the Summary Page for seamless navigation.
This ensures clarity and standardization for teams across finance, sales, and construction.
💡 Why Real-Estate Developers Need This Dashboard
🏢 Centralized Control: View financial, operational, and sales KPIs together.
📊 Visual Decision-Making: Understand complex data through color and charts.
🧱 Project Accountability: Monitor progress and performance at each milestone.
💰 Improved Profitability: Identify delays and cost overruns early.
📆 Faster Reporting: No more manual spreadsheets — everything updates automatically.
🌟 Advantages of the Real Estate Development KPI Dashboard in Power BI
✅ Real-Time Performance Tracking – MTD and YTD metrics update instantly.
✅ Clear Visualization – Charts simplify multi-layered data.
✅ Enhanced Accuracy – Eliminate human errors through automated formulas.
✅ Data Integration – Pull from Excel, SQL, or SharePoint seamlessly.
✅ Customization – Add new KPIs or visuals as projects evolve.
✅ Drill-Through Transparency – Know exactly how each metric is calculated.
✅ Scalability – Track multiple projects across locations with ease.
🧭 How to Use the Dashboard
1️⃣ Prepare Your Data: Enter Actuals, Targets, and KPI Definitions in Excel.
2️⃣ Load Into Power BI: Connect and refresh data with a single click.
3️⃣ Explore the Summary Page: Analyze KPI performance with filters.
4️⃣ Dive Into Trends: Use the KPI Trend page to see month-by-month progress.
5️⃣ Drill Through: Check definitions and formulas for clarity and consistency.
👥 Who Can Benefit from This Dashboard
Real Estate Developers 🏗️
Construction Project Managers 📋
Property Investors 🏢
Sales and Marketing Teams 💼
Financial Analysts & Planners 📊
Whether you’re managing residential, commercial, or mixed-use projects, this dashboard simplifies tracking, ensures accountability, and enhances transparency.
🧠 Conclusion
The Real Estate Development KPI Dashboard in Power BI revolutionizes how real-estate professionals monitor, analyze, and report performance.
By combining Power BI’s visualization power with Excel’s data flexibility, you gain real-time insight into your projects — from foundation to completion.
Stay ahead of delays, improve cash-flow visibility, and deliver stronger ROI with this all-in-one performance-tracking system.
Start using it today and transform your real-estate operations with the power of analytics 🏠💡.