


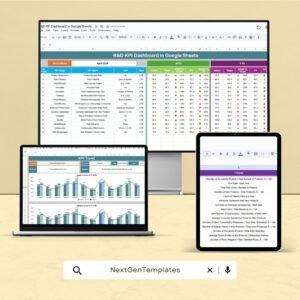
The R&D KPI Dashboard in Google Sheets is a powerful tool designed to help research and development teams effectively monitor and analyze their key performance indicators (KPIs). This dashboard consolidates important project data, providing real-time insights to ensure strategic decision-making and efficient management. It is tailored for organizations that wish to streamline their R&D operations, track project progress, manage resources, and ensure financial health across their innovation efforts.
This dashboard offers an easy-to-use interface, real-time updates, and customizable features, making it an indispensable asset for teams looking to optimize their research and development processes.

Key Features of the R&D KPI Dashboard in Google Sheets
📊 Comprehensive Performance Tracking
-
Project Progress Monitoring: Track ongoing R&D projects, milestones achieved, and upcoming deadlines to keep the team aligned with goals.
-
Resource Allocation Analysis: Monitor how resources are distributed across projects and adjust as necessary to ensure optimal utilization.
-
Budget Compliance: Ensure all R&D projects stay within allocated budgets by tracking expenses and comparing them against project forecasts.
📈 Interactive Data Visualization
-
Dynamic Charts and Graphs: Use customizable charts like Gantt charts, progress bars, and line graphs to represent project data and progress visually.
-
Real-Time Updates: Get updated insights in real-time as data is entered, ensuring you always have the most current view of project performance.
🖥 User-Friendly Interface
-
Customizable Layouts: Adjust the dashboard’s layout to highlight specific KPIs that align with your unique R&D objectives and business goals.
-
Collaborative Features: Share the dashboard with team members and stakeholders, ensuring transparency and collaborative decision-making.
🔒 Data Integrity and Security
-
Cloud-Based Accessibility: With Google Sheets, you can access the dashboard from anywhere, ensuring that project updates are available when needed.
-
Permission Settings: Manage access levels to sensitive project data, ensuring confidentiality and security.
Benefits of Using the R&D KPI Dashboard in Google Sheets
✅ Enhanced Decision-Making
Real-time data and visualizations allow R&D teams to identify potential issues quickly and make informed decisions, improving project outcomes.
✅ Improved Operational Efficiency
Automated tracking and data entry reduce manual efforts, enabling teams to focus on innovation and strategic planning rather than administrative tasks.
✅ Financial Optimization
Continuous monitoring of financial metrics, including budgets and expenditures, helps R&D teams manage costs effectively and optimize the use of resources.
✅ Strategic Planning
Access to comprehensive data empowers R&D teams to develop more effective strategies, allocate resources efficiently, and drive successful innovation.
Conclusion
The R&D KPI Dashboard in Google Sheets is an invaluable tool for R&D teams looking to streamline their operations, enhance financial performance, and improve strategic decision-making. With its real-time data updates, customizable features, and user-friendly design, this dashboard helps organizations optimize their R&D processes and ensure the success of innovation projects.
Click here to read the Detailed blog post
R&D KPI Dashboard in Google Sheets
Visit our YouTube channel to learn step-by-step video tutorials
YouTube.com/@PKAnExcelExpert


Reviews
There are no reviews yet.