
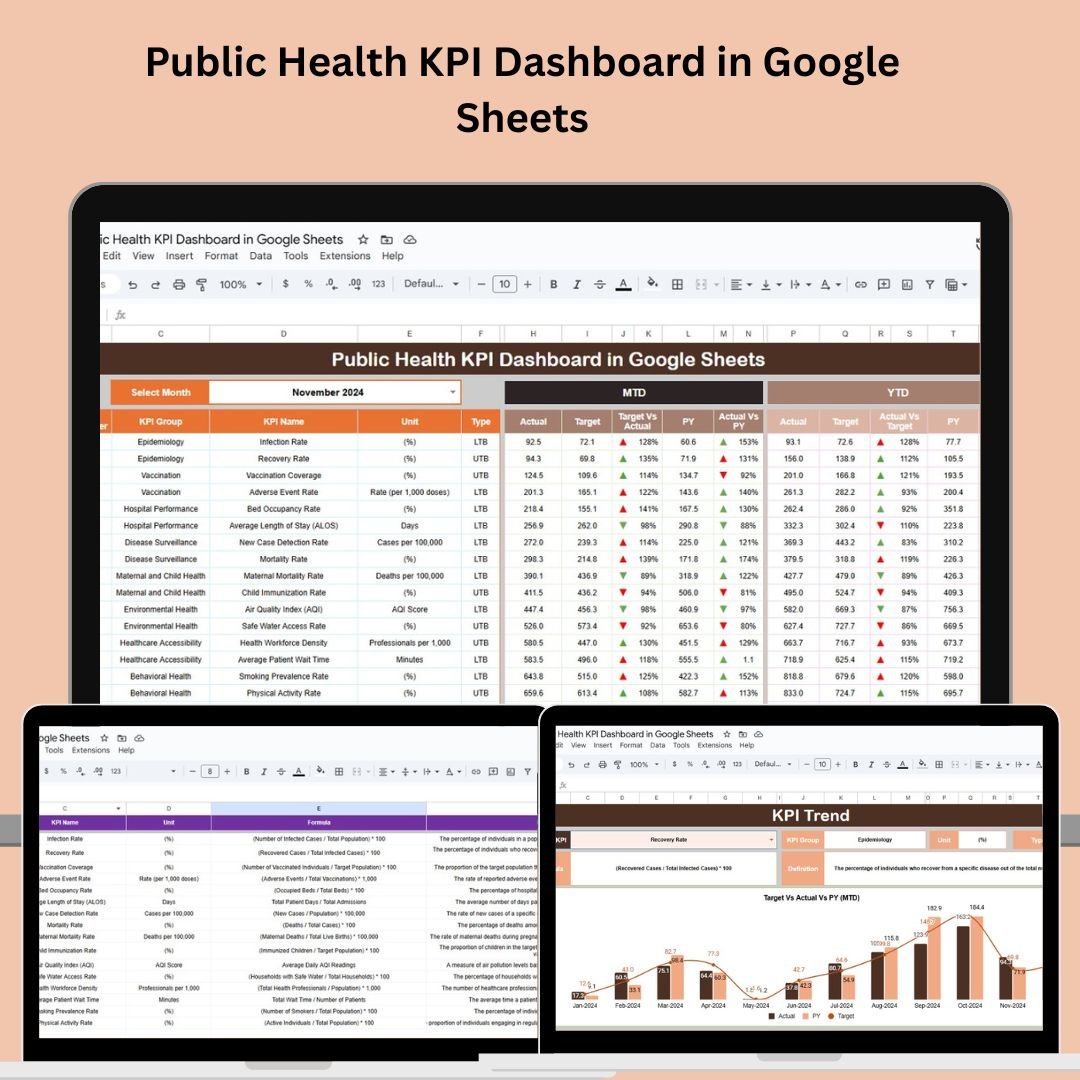
 Boost your Public Health Programs with our easy-to-use Google Sheets Dashboard! Track key health metrics like vaccination rates, disease prevalence, and healthcare access.
  Step-by-step tutorials on our YouTube channel!
Key Features of the Public Health KPI Dashboard in Google Sheets
The Public Health KPI Dashboard in Google Sheets is a powerful, ready-to-use tool designed to streamline the tracking of essential public health metrics. It helps organizations monitor the success of their health programs in real-time, ensuring that they are on track to meet their goals. 

Some of the key features include:
-
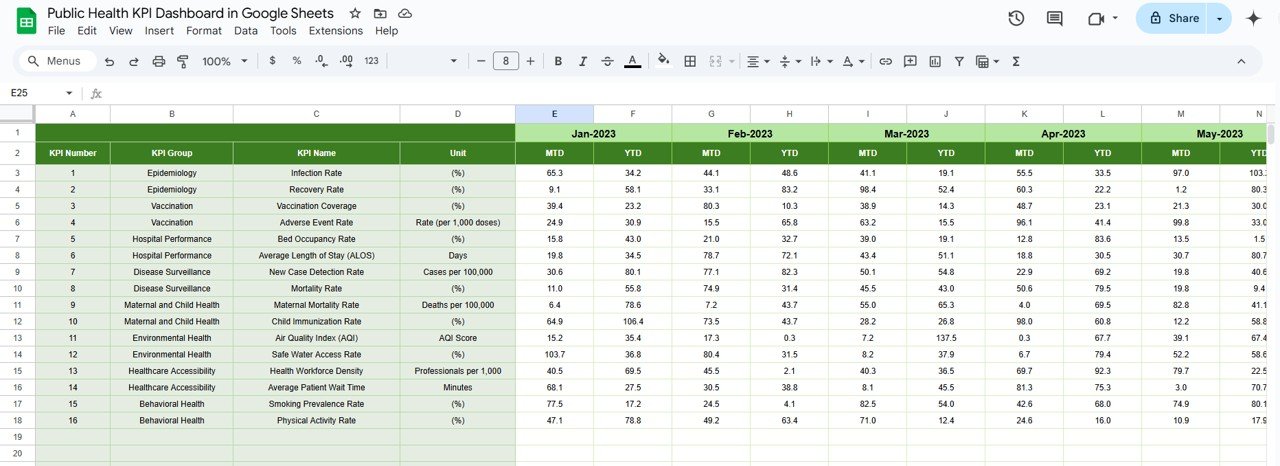
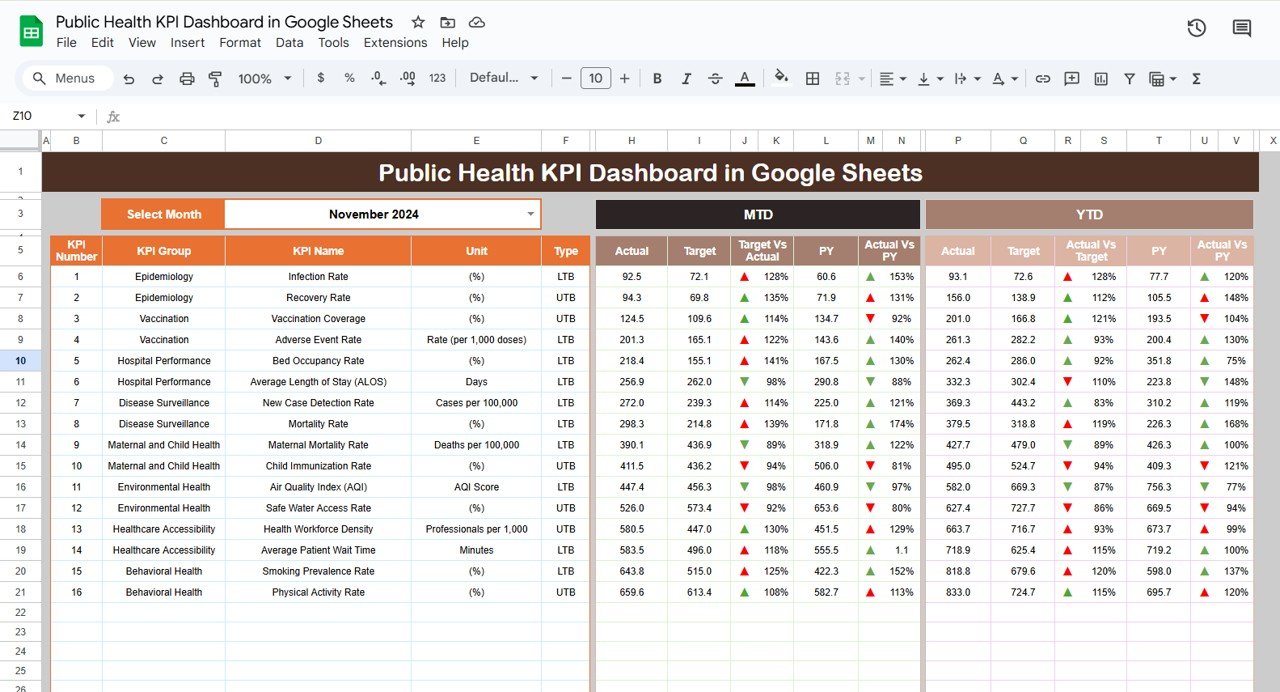
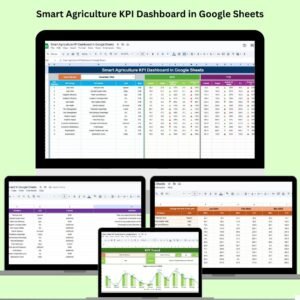
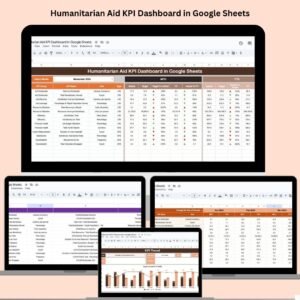
Dashboard Sheet Tab: This is your one-stop interface for tracking all KPIs. It provides an easy-to-read overview of key performance metrics, including Monthly-to-Date (MTD) and Year-to-Date (YTD) data.

-
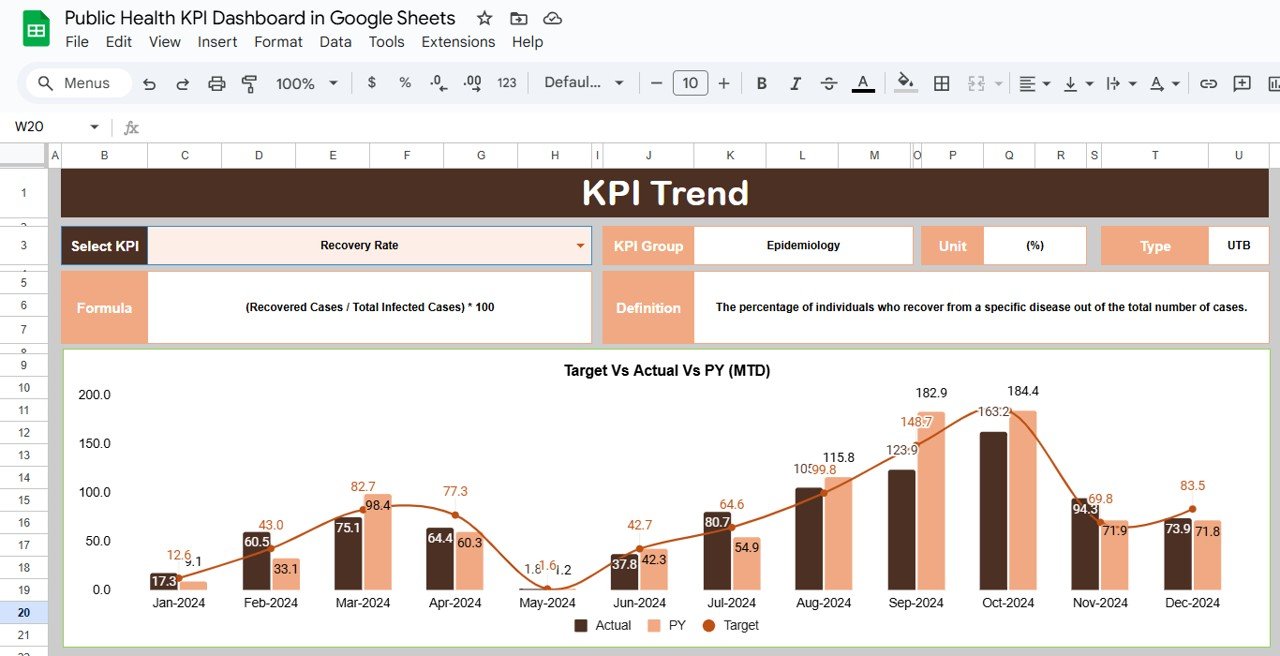
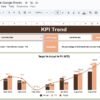
KPI Trend Sheet Tab: Allows users to track individual KPIs over time. With selectable dropdown options for specific KPIs, this sheet helps monitor trends and performance across different metrics.

-
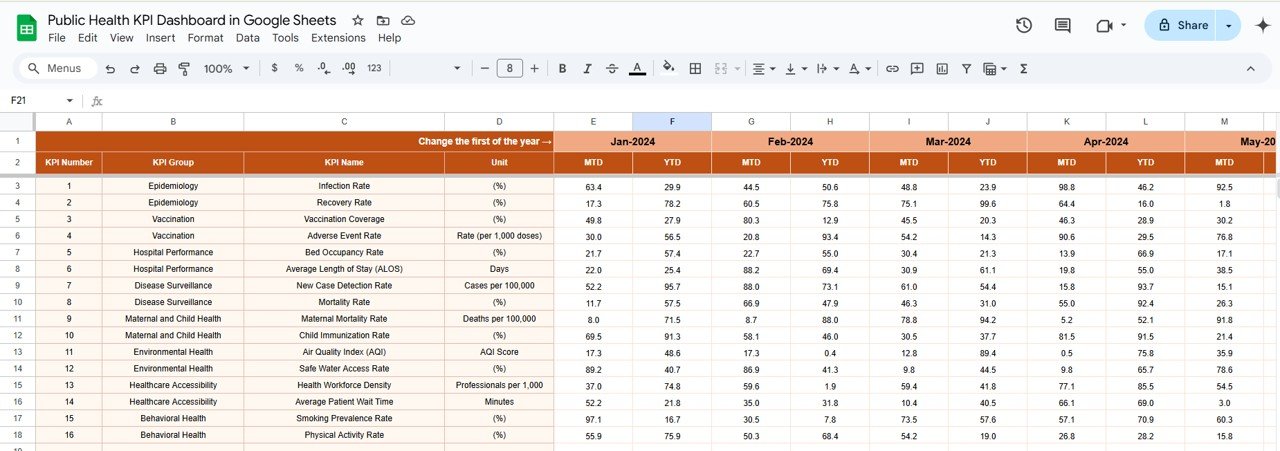
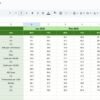
Actual Numbers Sheet Tab: Users can input actual data for each KPI, providing a real-time look at performance. It’s easy to adjust monthly figures, so your team can stay up-to-date.

-
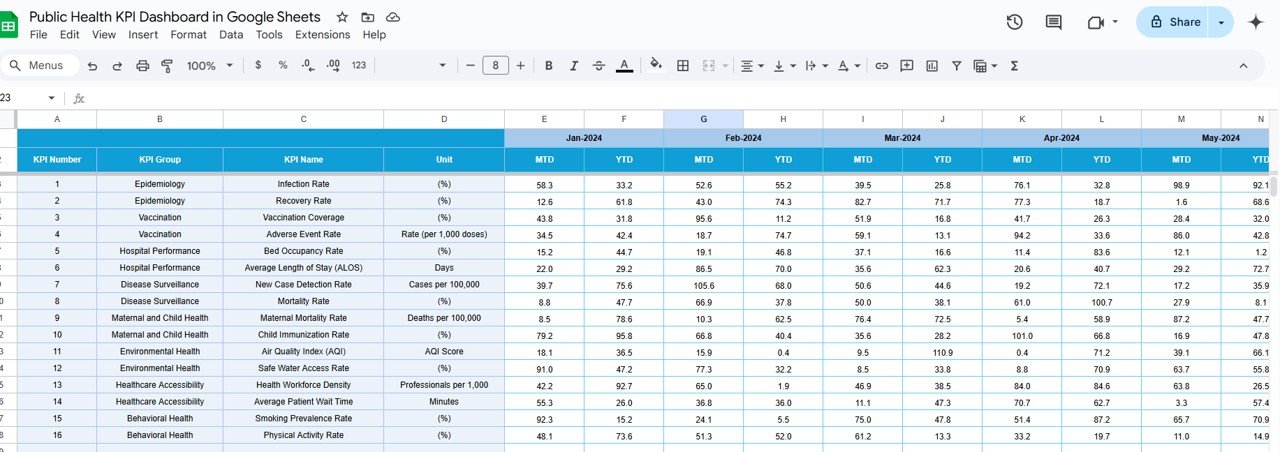
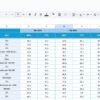
Target Sheet Tab: This tab allows the input of target values for both MTD and YTD, ensuring your organization’s goals are always within reach.

-
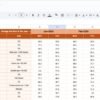
Previous Year Numbers Sheet Tab: This feature helps compare current performance with previous year data, giving context to your success and areas for improvement.

-
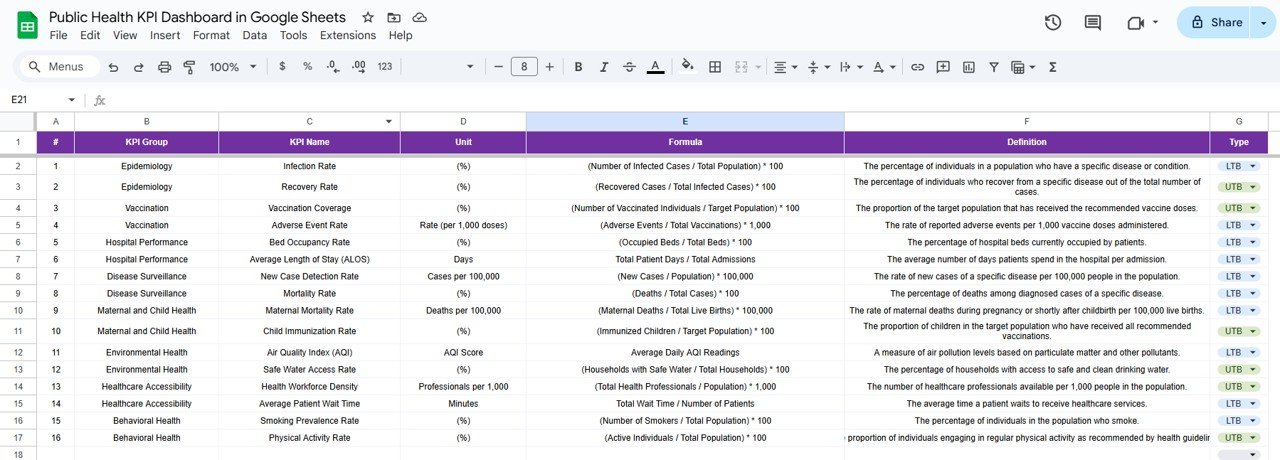
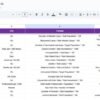
KPI Definition Sheet Tab: Contains definitions for every KPI in the dashboard, so your team can stay aligned on what each metric means.

What’s Inside the Public Health KPI Dashboard
The Public Health KPI Dashboard template includes several built-in tools designed for easy data management. These tools help ensure seamless data tracking and insightful analysis:
-
Interactive Features: With a dropdown feature for month selection, you can instantly update your dashboard’s performance data without any hassle.
-
Real-Time Monitoring: The dashboard automatically displays MTD and YTD data, highlighting both successes and areas that need attention through conditional formatting and up/down arrows.


-
Customizable and Flexible: Tailor the dashboard to fit your specific public health programs. From disease prevalence to healthcare access, this template adapts to your needs.

-
Cloud-Based Collaboration: Since it’s built on Google Sheets, your team can access and update the dashboard from anywhere. Perfect for remote collaboration!


How to Use the Public Health KPI Dashboard
Using the Public Health KPI Dashboard in Google Sheets is straightforward:
-
Input Data: Begin by entering your Actual Numbers in the provided sheet. You can update the numbers for different months to get real-time insights.
-
Set Targets: In the Target Sheet, input your health program’s goals, ensuring that the dashboard can track progress toward these objectives.
-
Select Your KPIs: The KPI Trend Sheet allows you to monitor the performance of each individual metric over time, making it easy to assess how well you’re doing against your targets.
-
Analyze Trends: Use the historical data comparison feature in the Previous Year Numbers tab to gauge improvements and identify long-term trends.

-
Collaborate: Thanks to Google Sheets’ cloud-based nature, you can easily share the dashboard with other stakeholders and team members for collaborative decision-making.
Who Can Benefit from This Public Health KPI Dashboard
The Public Health KPI Dashboard is perfect for:
-
Government Health Departments: Track public health initiatives, assess the effectiveness of health programs, and make data-driven decisions.

-
Non-Profit Health Organizations: Measure progress on health initiatives, identify gaps, and adjust strategies to maximize impact.

-
Hospital Management Teams: Manage hospital-specific KPIs, such as patient outcomes and vaccination rates, to improve hospital efficiency.
-
Health Policy Makers: Use data to shape policies that improve public health across various regions.
This tool is also highly beneficial for researchers, consultants, and public health analysts who need to monitor and report on key health metrics. 
Click here to read the Detailed Blog Post
Watch the step-by-step video Demo:


Reviews
There are no reviews yet.