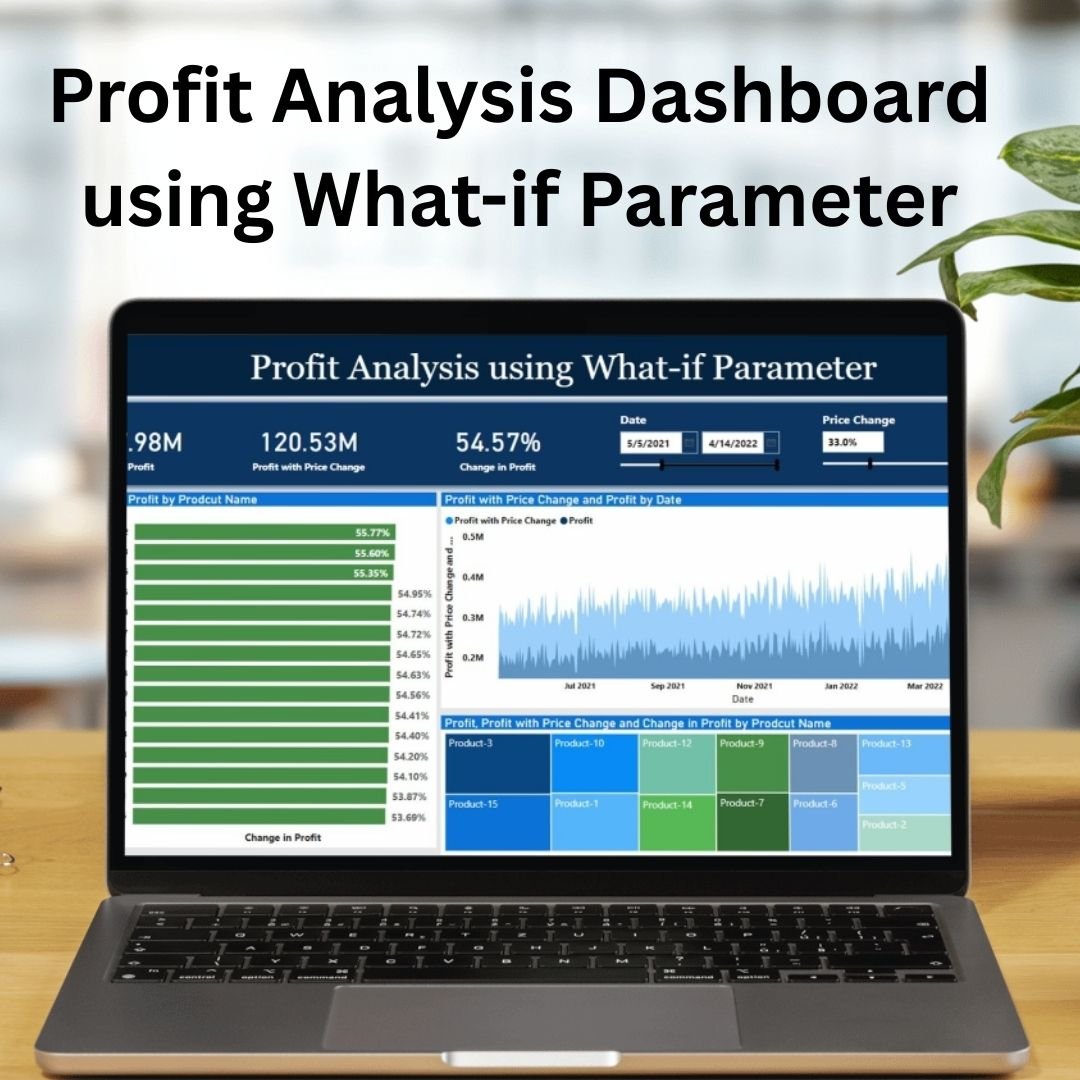
The Profit Analysis Dashboard Using What-If Parameter in Power BI is a powerful tool that helps businesses visualize and analyze their profit margins in a dynamic and interactive way. Using the innovative What-If parameter functionality in Power BI, this dashboard allows you to explore different profit scenarios based on variables such as sales volume, cost, and pricing changes. This makes it ideal for financial analysts, business owners, and managers who want to optimize their profit margins and make data-driven decisions.
With its interactive charts and dynamic filters, the Profit Analysis Dashboard provides a comprehensive view of your business’s profitability. It allows you to experiment with different “what-if” scenarios to understand how changes in key metrics can impact your bottom line, helping you make more informed decisions and forecasts.
Key Features of the Profit Analysis Dashboard Using What-If Parameter in Power BI
📌 Interactive What-If Parameters
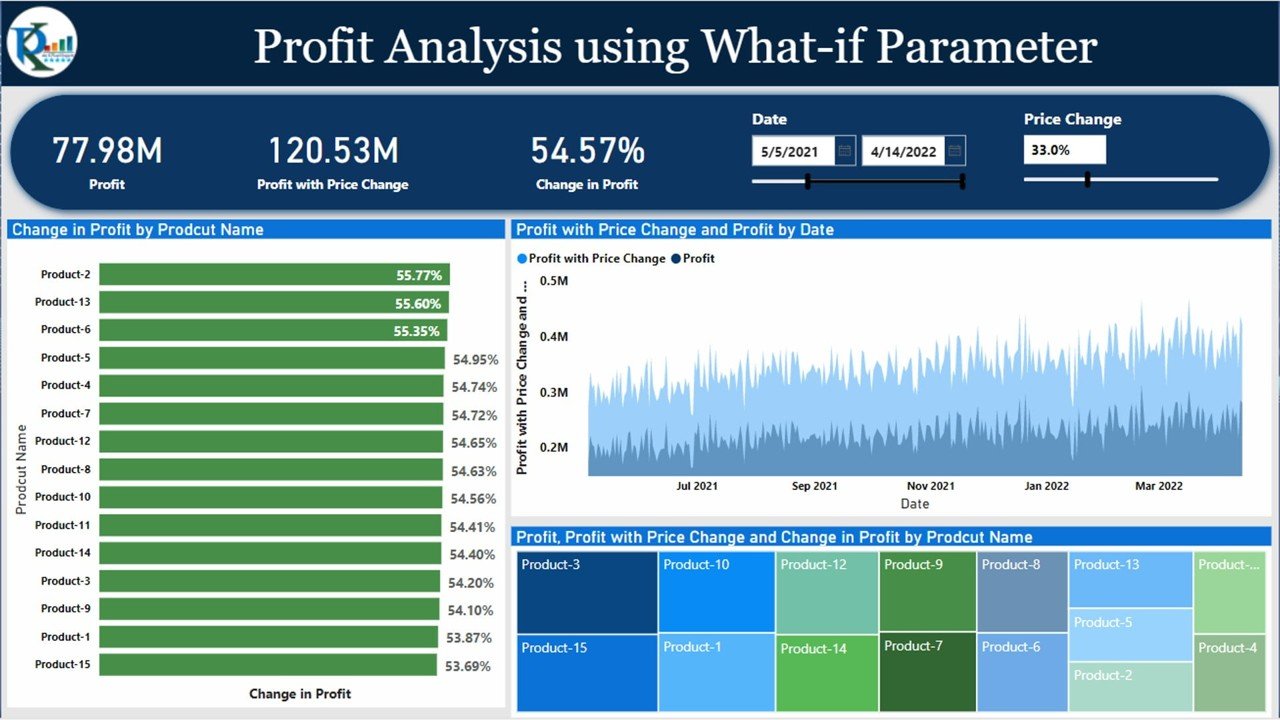
This dashboard leverages Power BI’s What-If parameters, enabling you to simulate different business scenarios and assess their impact on profitability. For example, you can adjust cost percentages, sales volumes, or prices and see how these changes affect your profit margin instantly.
🛠 Dynamic Profitability Insights
Gain real-time insights into profitability through visual charts, such as bar graphs and line charts, that adjust dynamically based on the parameters you input. You can explore different profit scenarios based on a variety of business inputs and instantly visualize the outcomes.
💡 Comprehensive Financial Metrics
Track key financial metrics such as sales revenue, cost of goods sold (COGS), gross profit, operating expenses, and net profit. This comprehensive set of KPIs gives you a clear view of your business’s financial health.
🔢 Scenario-Based Forecasting
With the What-If parameter feature, you can model different scenarios and make data-driven forecasts. This feature helps you to test multiple variables simultaneously and understand how changes in one or more parameters can influence profit outcomes.
🚀 Customizable Filters and Visualizations
The dashboard includes customizable filters that allow you to focus on specific data sets or time periods. You can drill down into sales data by region, product, or other dimensions, enabling you to identify key trends and insights more effectively.
📊 Real-Time Data Updates
As you adjust the What-If parameters, the dashboard automatically updates in real time. This allows you to make adjustments on the fly, so you can explore different scenarios quickly and efficiently without having to manually refresh the data.
⚙ User-Friendly Interface
The Profit Analysis Dashboard is designed with a user-friendly interface, making it easy to navigate through the data and find the insights you need. Its intuitive design ensures that both beginners and advanced users can make the most of the dashboard’s features.
🚀 Why You’ll Love the Profit Analysis Dashboard Using What-If Parameter in Power BI
✅ Interactive Scenario Modeling – Use What-If parameters to simulate different profit scenarios and forecast potential outcomes. ✅ Real-Time Insights – Gain up-to-date insights as you modify the parameters and visualize profit changes. ✅ Comprehensive Profit Metrics – Monitor critical financial KPIs to understand your business’s profitability. ✅ Customizable Filters – Focus on specific data points or timeframes to refine your analysis. ✅ User-Friendly Design – Easy-to-use interface ensures that you can quickly access the information you need.
📂 What’s Inside the Profit Analysis Dashboard Using What-If Parameter in Power BI?
- What-If Parameters: Simulate changes in cost, sales volume, or price to see their impact on profitability.
- Dynamic Financial Metrics: Real-time calculations of sales revenue, COGS, gross profit, and net profit.
- Customizable Visualizations: Charts and graphs that adjust as you update your parameters.
- Comprehensive Scenario Forecasting: Explore different scenarios based on adjusted inputs.
- Real-Time Updates: The dashboard automatically refreshes as you modify the input parameters.
🔍 How to Use the Profit Analysis Dashboard Using What-If Parameter in Power BI
1️⃣ Download the Template – Instant access to the Power BI file upon purchase. 2️⃣ Set Up Parameters – Input your What-If parameters such as cost percentage, sales volume, or pricing. 3️⃣ Visualize and Analyze – Watch the dashboard dynamically update as you adjust the parameters. 4️⃣ Make Forecasts – Test different scenarios to forecast how changes will impact your profits. 5️⃣ Present and Share – Use the dashboard in meetings or reports to present detailed profit analysis and insights.
🎯 Who Can Benefit from the Profit Analysis Dashboard Using What-If Parameter in Power BI? 🔹 Financial Analysts
🔹 Business Owners
🔹 Sales and Marketing Managers
🔹 Product Managers
🔹 Anyone involved in financial forecasting, budgeting, or profit optimization
Make better financial decisions and optimize your profits with the Profit Analysis Dashboard Using What-If Parameter in Power BI. This interactive and dynamic tool gives you the flexibility to test multiple scenarios and understand their impact on your bottom line.
Click here to read the Detailed blog post
https://www.pk-anexcelexpert.com/profit-analysis-dashboard-using-what-if-parameter-in-power-bi/


Reviews
There are no reviews yet.