



The Hospital Operations KPI Dashboard in Power BI is a comprehensive tool designed for healthcare administrators, hospital managers, and operations teams looking to streamline and optimize their hospital operations. This Power BI-based dashboard helps you monitor key performance indicators (KPIs) such as bed occupancy, patient wait times, staff productivity, emergency response times, and overall hospital performance, providing valuable insights to improve healthcare services and operational efficiency.
With interactive visualizations, real-time data tracking, and customizable reports, this dashboard helps healthcare professionals make data-driven decisions to improve patient care, optimize resource allocation, and ensure operational excellence across the hospital.
Key Features of the Hospital Operations KPI Dashboard in Power BI:
🏥 Bed Occupancy Rate
Track the bed occupancy rate across different departments and units, helping you monitor hospital capacity and optimize bed usage to avoid overcrowding or underutilization.
📈 Patient Wait Time Monitoring
Monitor patient wait times for consultations, procedures, and emergency care, ensuring that patient flow is efficient and wait times are minimized.
🩺 Staff Productivity Tracking
Track healthcare staff productivity and workload, monitoring the performance of medical professionals and support staff to ensure optimal resource utilization.
🚑 Emergency Response Time
Measure the response times of the emergency department to ensure timely medical care for patients in critical conditions.
💡 Patient Satisfaction and Care Quality
Monitor patient satisfaction scores and feedback, assessing the quality of care provided and identifying areas for improvement.
🚀 Why You’ll Love the Hospital Operations KPI Dashboard in Power BI:

✅ Track Hospital Efficiency – Monitor bed occupancy, patient wait times, and staff productivity to ensure your hospital operates efficiently and meets patient demands.
✅ Improve Patient Care – Track emergency response times, patient satisfaction, and care quality to enhance the overall patient experience and outcomes.
✅ Optimize Resource Allocation – Use real-time data to manage hospital resources effectively, optimizing staff schedules, bed usage, and medical equipment.
✅ Measure Operational Excellence – Track key metrics to ensure that your hospital is running smoothly, improving patient care, and achieving operational excellence.
✅ Customizable and Interactive – This Power BI dashboard is highly customizable and interactive, allowing you to tailor it to your hospital’s unique operations and KPIs.
✅ Data-Driven Decisions – Make informed decisions about hospital operations, resource management, and patient care based on real-time data.
What’s Inside the Hospital Operations KPI Dashboard in Power BI:
Bed Occupancy Rate: Track the occupancy rate of beds in various hospital departments to optimize capacity management and improve patient flow.
Patient Wait Time: Monitor patient wait times for appointments, consultations, and emergency care to minimize delays and improve the patient experience.
Staff Productivity: Track the performance and productivity of healthcare professionals, ensuring that staff resources are used effectively, and that patient care remains a priority.
Emergency Response Time: Measure how quickly the emergency department responds to critical situations, ensuring that patients receive timely care in emergencies.
Patient Satisfaction: Track patient satisfaction levels, feedback, and complaints to improve hospital services and patient care.
Custom Reports: Generate detailed, customizable reports for hospital management or stakeholders, providing insights into hospital performance, efficiency, and patient outcomes.
How to Use the Hospital Operations KPI Dashboard in Power BI:
1️⃣ Download the Template – Instantly access your Power BI file upon purchase.
2️⃣ Input Hospital Data – Enter data on bed occupancy, patient wait times, staff productivity, emergency response times, and patient satisfaction into the dashboard.
3️⃣ Track Key Metrics – Use the dashboard to track KPIs in real-time, monitoring hospital performance and efficiency across different departments.
4️⃣ Analyze Trends – Use interactive charts to analyze long-term trends in hospital operations and identify areas for improvement.
5️⃣ Generate Custom Reports – Create custom reports that summarize hospital operations performance for stakeholders, hospital boards, or management.
Who Can Benefit from the Hospital Operations KPI Dashboard in Power BI:
Hospital Administrators
Healthcare Operations Managers
Healthcare Data Analysts
Medical Directors
Emergency Department Managers
HR Managers for Healthcare
Patient Care Coordinators
Healthcare Consultants
Healthcare Executives and Stakeholders
The Hospital Operations KPI Dashboard in Power BI is the ideal solution for hospital administrators and operations teams looking to optimize hospital performance, improve patient care, and ensure efficient use of resources. By tracking key metrics, you can make informed decisions to improve healthcare services, enhance patient outcomes, and boost operational efficiency.
Click here to read the Detailed blog post
https://www.pk-anexcelexpert.com/hospital-operations-kpi-dashboard-in-power-bi/
Visit our YouTube channel to learn step-by-step video tutorials
Youtube.com/@PKAnExcelExpert
Compatibility and Requirements
- Works in Power BI Desktop, which is free to download from Microsoft. You open the Power BI file you receive after purchase.
- Microsoft explains how to install it in Get Power BI Desktop.
Frequently Asked Questions
What does the dashboard track?
It tracks bed occupancy rate, patient wait time, staff productivity, emergency response time and patient satisfaction.
Can I track bed occupancy by department?
Yes. The Bed Occupancy Rate view covers different departments and units, so you can see where capacity is tight and where beds sit unused.
Does it cover emergency care?
Yes. It measures emergency department response times, and patient wait times for consultations, procedures and emergency care.
Can I create reports for hospital management?
Yes. The Custom Reports feature produces detailed reports on hospital performance, efficiency and patient outcomes that you can share with management or stakeholders.
Is there an Excel or Google Sheets version?
Yes. See the Hospital Operations KPI Dashboard in Excel and the Hospital Operations KPI Dashboard in Google Sheets.
Related Hospital and Operations Templates
- Hospital Operations KPI Dashboard in Excel: the same hospital KPIs in Excel
- Hospital Operations KPI Dashboard in Google Sheets: the Google Sheets edition
- Hospitals KPI Dashboard in Power BI: another hospital KPI view in Power BI
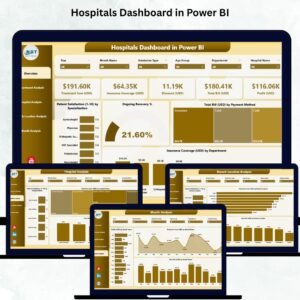
- Hospitals Dashboard in Power BI: a wider hospital dashboard in Power BI
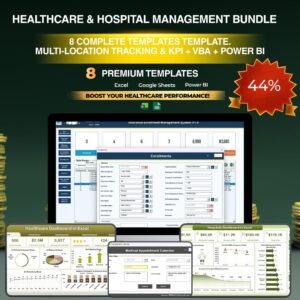
- Healthcare & Hospital Management Bundle: 8 healthcare templates in one download
Browse all Power BI KPI dashboards.


























Reviews
There are no reviews yet.