
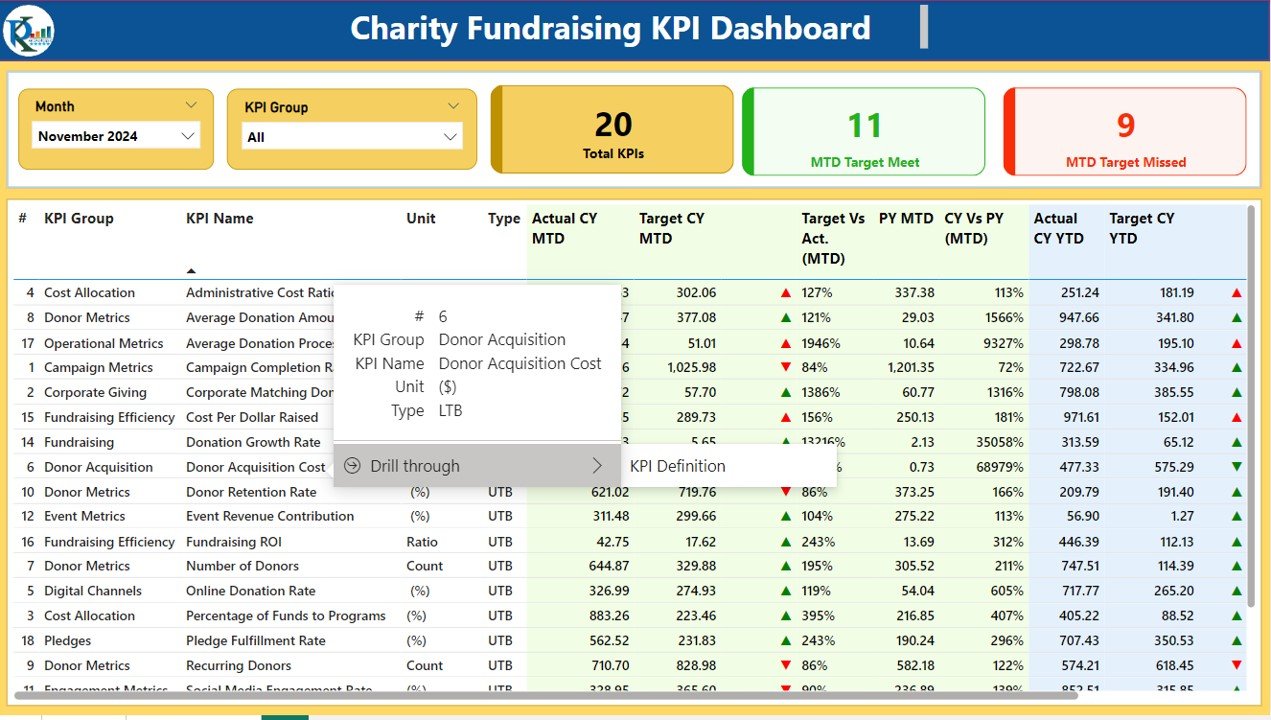
The Charity Fundraising KPI Dashboard in Power BI is an essential tool for non-profits, fundraisers, and charity organizations that want to optimize their fundraising campaigns and monitor their performance. This Power BI-based dashboard enables you to track key performance indicators (KPIs) such as donation amounts, donor engagement, fundraising event performance, and campaign progress, providing valuable insights into your fundraising efforts.
With customizable charts, real-time tracking, and detailed reports, this dashboard helps you manage fundraising campaigns efficiently, assess donor behavior, and ensure that your charity organization is meeting its fundraising goals.
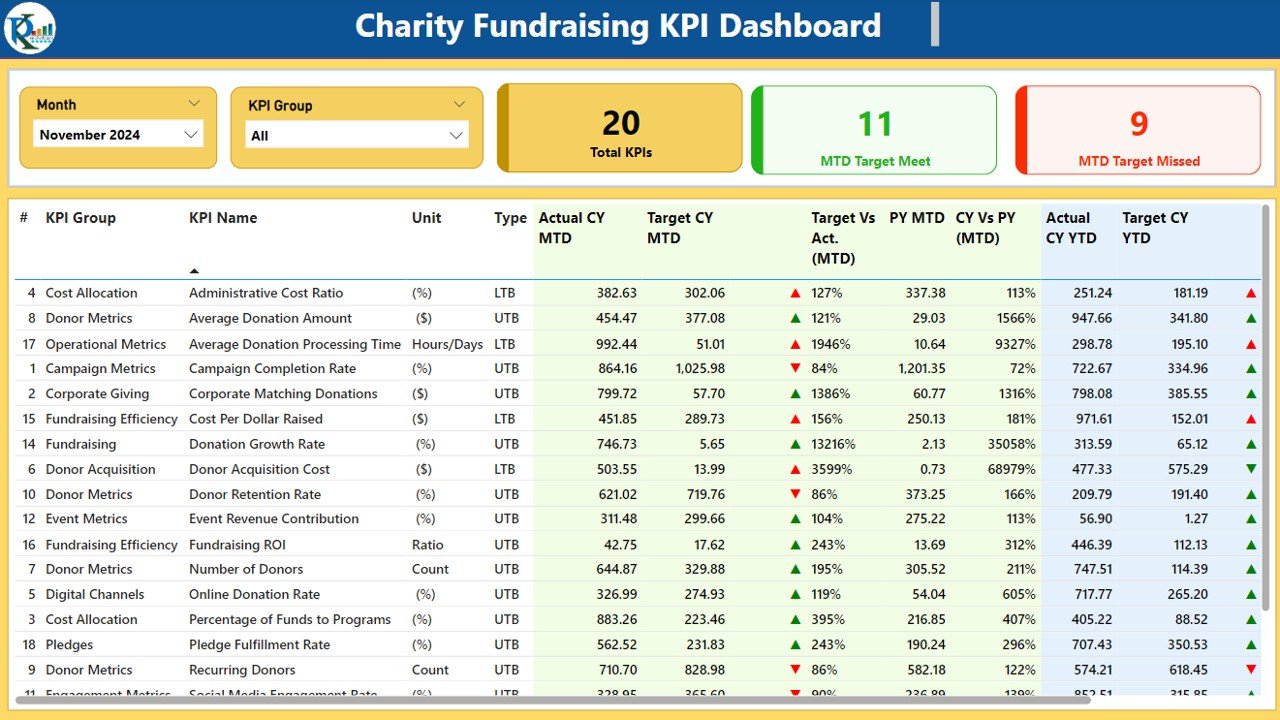
Key Features of the Charity Fundraising KPI Dashboard in Power BI:
💸 Donation Tracking
Monitor the total donations raised, track donations per campaign or event, and measure the success of your fundraising efforts in real-time.
🎯 Donor Engagement
Track donor participation, retention, and engagement rates to better understand your donor base and develop targeted fundraising strategies.
📅 Fundraising Event Performance
Monitor the performance of fundraising events such as galas, auctions, and online campaigns, measuring attendance, donations, and overall success.
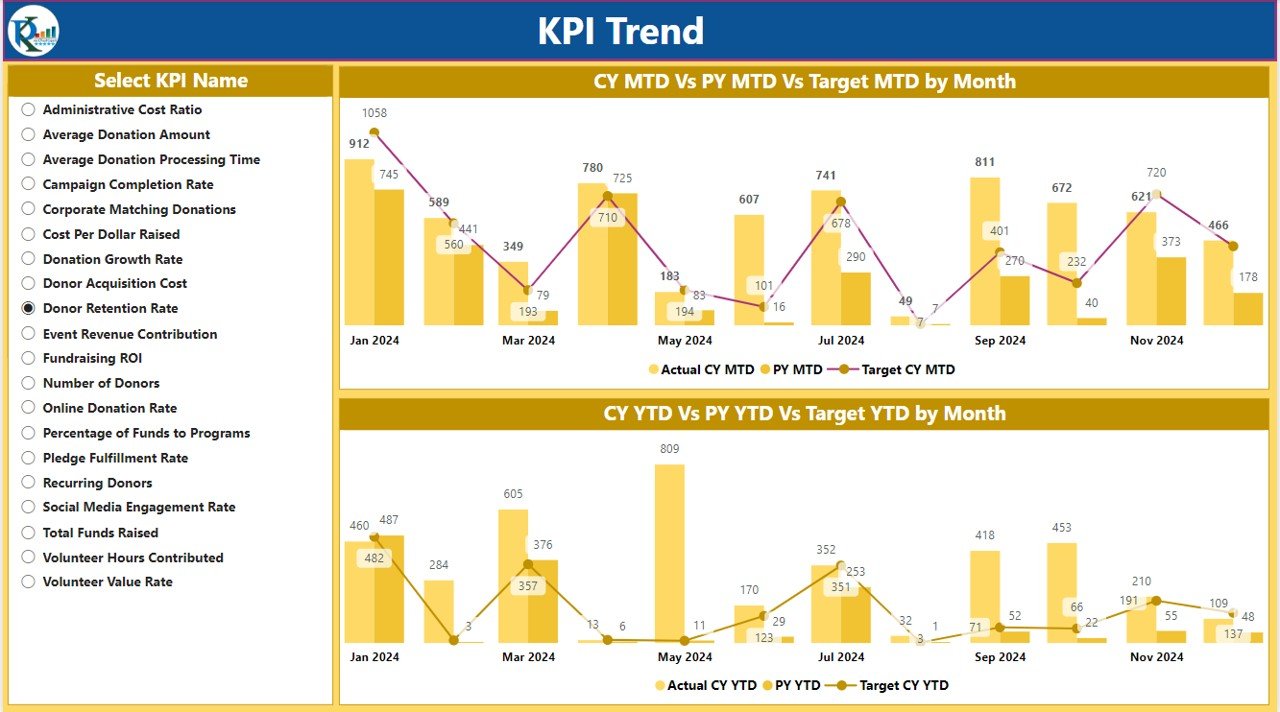
📊 Campaign Progress and Targets
Track the progress of your fundraising campaigns, compare actual results to targets, and adjust strategies accordingly to meet your financial goals.
📈 Donor Demographics and Insights
Analyze donor demographics such as age, location, and donation frequency to better tailor your outreach efforts and increase donor contributions.
🚀 Why You’ll Love the Charity Fundraising KPI Dashboard in Power BI:
✅ Track Donations and Revenue – Monitor total donations, individual campaign performance, and revenue in real-time to ensure financial goals are being met.
✅ Improve Donor Engagement – Measure donor retention, participation rates, and engagement to ensure ongoing support and improve long-term relationships.
✅ Evaluate Fundraising Event Performance – Track the performance of individual fundraising events to determine which initiatives are the most successful.
✅ Monitor Campaign Progress – Track the progress of fundraising campaigns against set targets, ensuring that you can make timely adjustments to reach your goals.
✅ Analyze Donor Demographics – Gain valuable insights into your donor base, including demographics and giving patterns, to refine your outreach and targeting strategies.
✅ Customizable and Interactive – This Power BI dashboard is fully customizable, allowing you to tailor it to your charity’s specific fundraising efforts and goals.
What’s Inside the Charity Fundraising KPI Dashboard in Power BI:
- Donation Tracking: Monitor donation amounts, track donations per campaign, and analyze donor trends over time to measure fundraising success.
- Donor Engagement: Track donor participation, engagement, and retention, and identify high-value donors to focus your efforts on long-term relationships.
- Fundraising Event Performance: Measure the success of events, including attendance rates, total donations raised, and overall ROI of fundraising events.
- Campaign Progress: Track fundraising campaign performance and progress against targets to ensure you are on track to meet financial goals.
- Donor Demographics: Analyze donor information such as age, location, and donation frequency to identify patterns and improve outreach efforts.
- Custom Reports: Generate detailed and customizable reports on fundraising progress, donor engagement, and campaign performance to share with stakeholders or management.
How to Use the Charity Fundraising KPI Dashboard in Power BI:
1️⃣ Download the Template – Instantly access your Power BI file upon purchase.
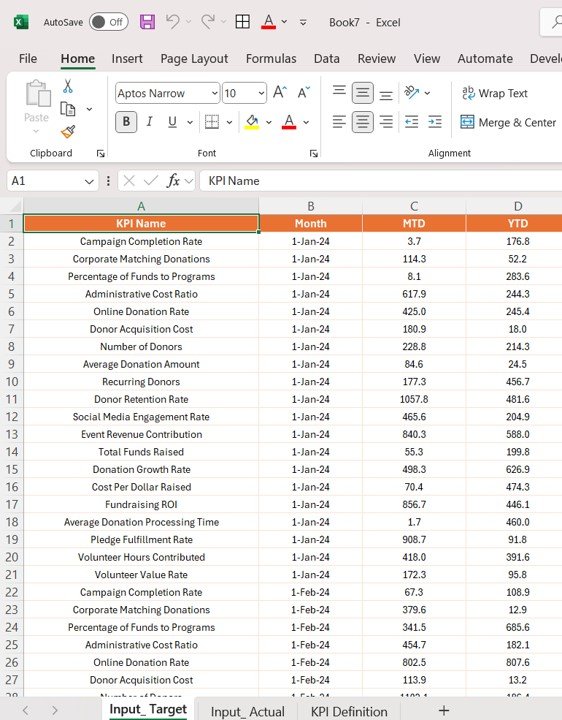
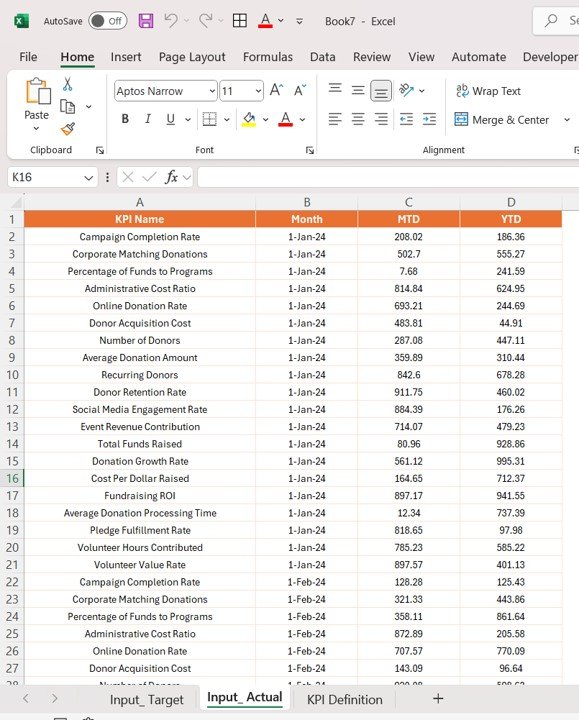
2️⃣ Input Fundraising Data – Enter data on donations, fundraising events, donor engagement, and campaign progress into the dashboard.
3️⃣ Track Key Metrics – Use the dashboard to monitor KPIs such as donation amounts, donor participation, event performance, and campaign progress in real-time.
4️⃣ Analyze Donor Data – Use charts and graphs to analyze donor demographics, giving behavior, and engagement patterns to enhance your fundraising strategies.
5️⃣ Generate Custom Reports – Create customized reports for donors, stakeholders, or management, providing a comprehensive overview of fundraising performance.
Who Can Benefit from the Charity Fundraising KPI Dashboard in Power BI:
- Non-Profit Organizations
- Fundraising Managers
- Charity Event Coordinators
- Donor Engagement Teams
- Marketing and Outreach Teams
- Data Analysts in Charity and Non-Profit Sectors
- Board Members and Stakeholders
The Charity Fundraising KPI Dashboard in Power BI is the ultimate solution for non-profits and charity organizations looking to streamline their fundraising efforts. By tracking key performance indicators, analyzing donor behavior, and optimizing fundraising events, this dashboard helps ensure that your organization reaches its goals and maximizes support for its cause.
Click here to read the Detailed blog post
https://www.pk-anexcelexpert.com/charity-fundraising-kpi-dashboard-in-power-bi/
Visit our YouTube channel to learn step-by-step video tutorials
Youtube.com/@PKAnExcelExpert


Reviews
There are no reviews yet.