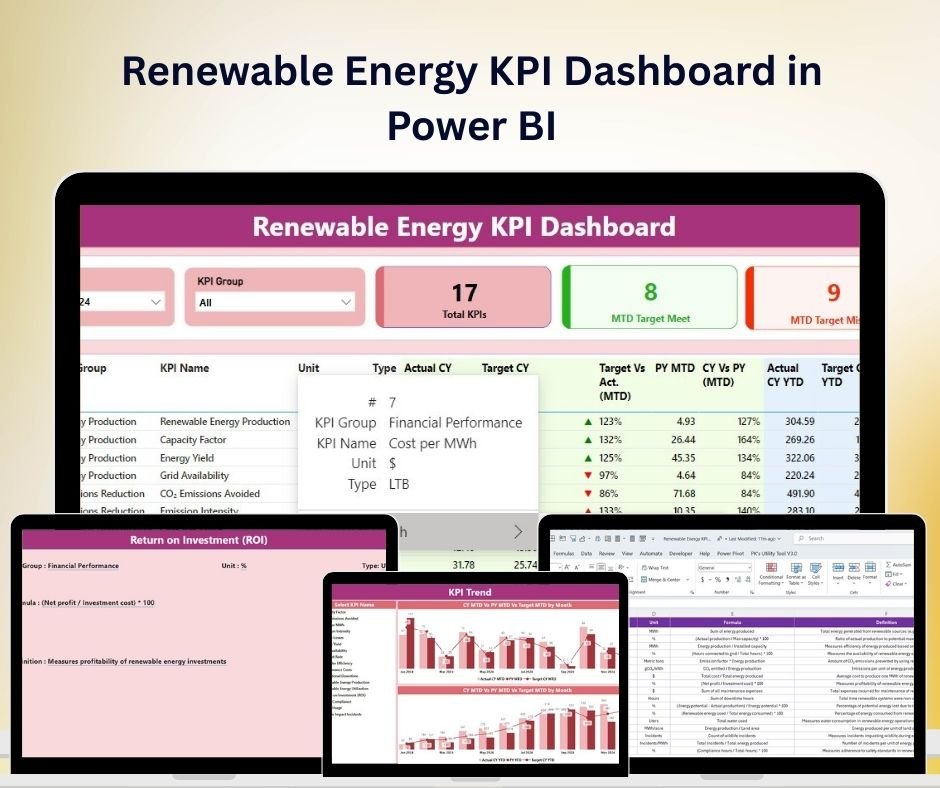
The Renewable Energy KPI Dashboard in Power BI is a comprehensive tool designed for energy companies, project managers, and analysts involved in the renewable energy sector. Whether you’re managing solar, wind, hydroelectric, or other renewable energy projects, this Power BI-based dashboard provides real-time insights into key performance indicators (KPIs) such as energy production, consumption efficiency, cost savings, carbon footprint reduction, and more.
With interactive features and customizable capabilities, this dashboard allows you to monitor energy generation, track operational efficiency, and assess the financial and environmental impact of your renewable energy initiatives, enabling you to make data-driven decisions for sustainable growth.
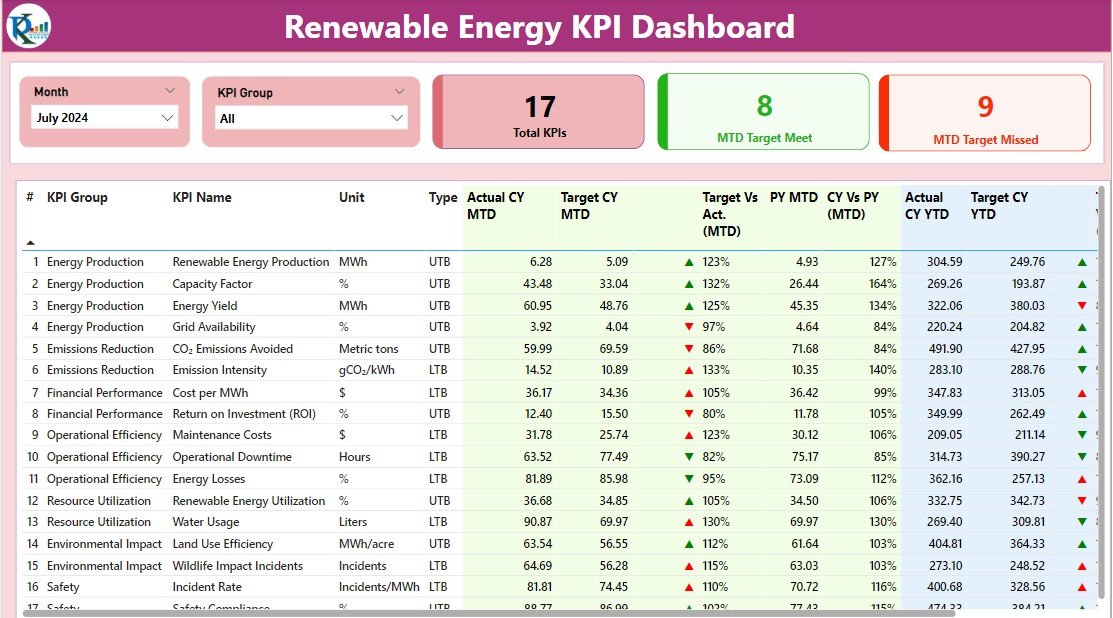
Key Features of the Renewable Energy KPI Dashboard in Power BI:
🔋 Energy Production Monitoring
Track the total energy produced from renewable sources such as solar panels, wind turbines, and hydroelectric systems to evaluate performance against set targets.
💰 Cost and Revenue Tracking
Monitor the operational costs, maintenance expenses, and revenue generated from the sale of renewable energy to assess the financial sustainability of your projects.
🌍 Environmental Impact and Carbon Reduction
Measure the carbon emissions saved by producing renewable energy compared to conventional energy sources, contributing to sustainability goals and carbon reduction.
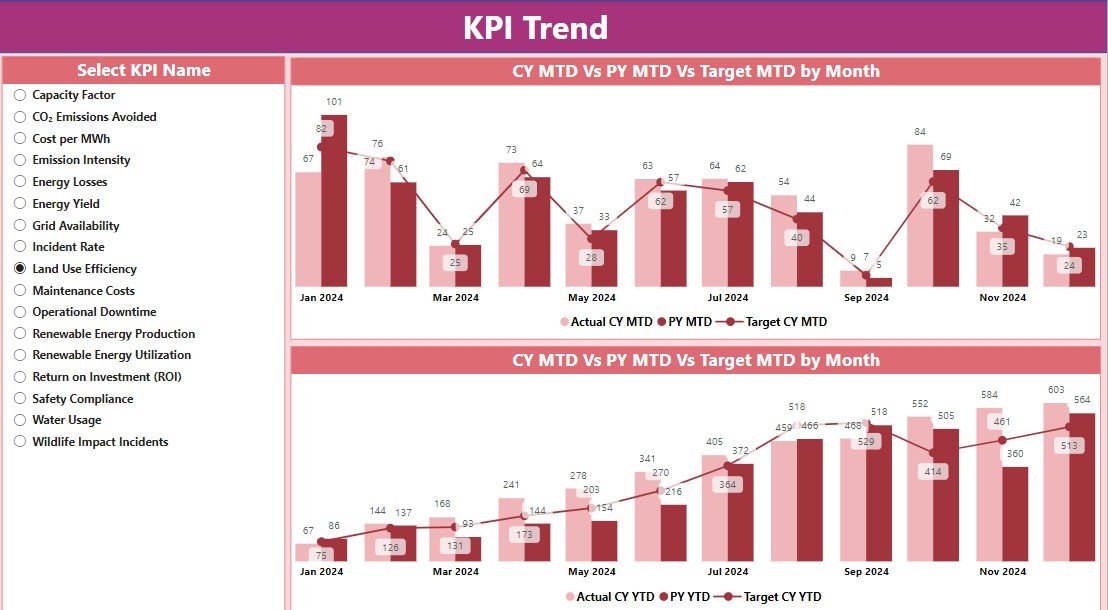
📊 Energy Efficiency Metrics
Track the efficiency of energy conversion and distribution to identify opportunities for optimization and improvement in energy management.
📅 Maintenance and Downtime Tracking
Monitor equipment maintenance schedules, downtime, and performance issues to ensure that your renewable energy systems remain operational and efficient.
🚀 Why You’ll Love the Renewable Energy KPI Dashboard in Power BI:
✅ Track Energy Production – Monitor energy production from renewable sources such as wind, solar, and hydro to assess project performance and growth.
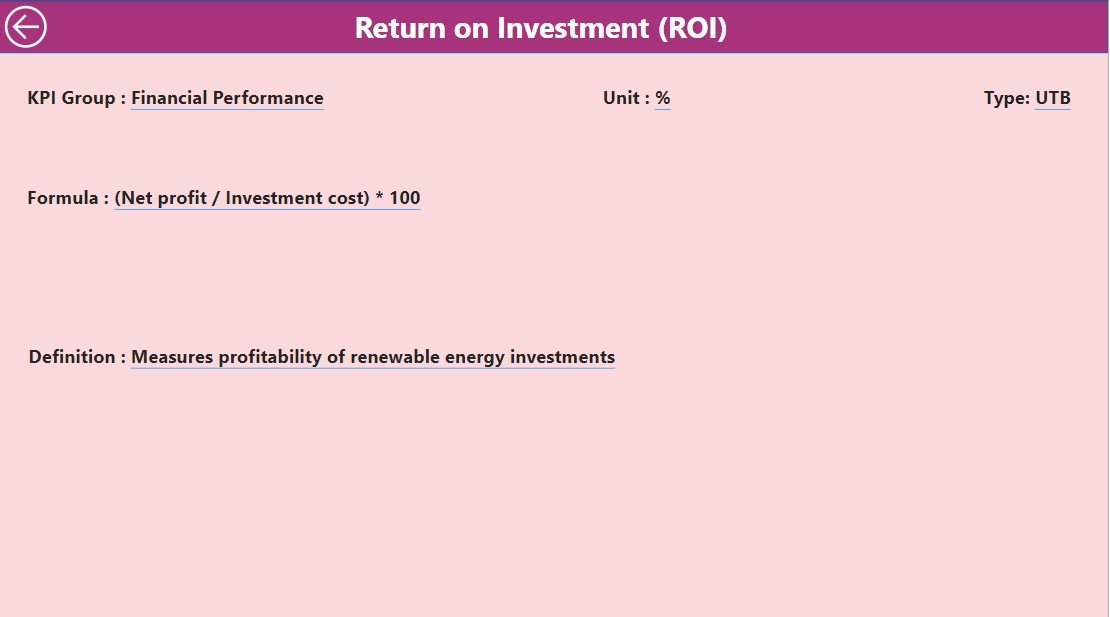
✅ Evaluate Financial Performance – Track revenue, expenses, and profitability from renewable energy projects to ensure long-term sustainability.
✅ Measure Environmental Impact – Track carbon emissions saved by renewable energy systems to assess the positive environmental impact of your projects.
✅ Optimize Energy Efficiency – Monitor energy conversion and distribution efficiency to identify areas for improvement and optimize system performance.
✅ Ensure Equipment Reliability – Track maintenance schedules and downtime to keep renewable energy systems running at peak performance.
✅ Fully Customizable and Interactive – Tailor the dashboard to meet the specific needs of your renewable energy projects, with interactive features for real-time insights and data analysis.
What’s Inside the Renewable Energy KPI Dashboard in Power BI:
-
Energy Production Tracking: Track the total energy generated by renewable sources like solar, wind, and hydroelectric systems to ensure optimal performance.
-
Revenue and Cost Analysis: Monitor the revenue from energy sales and track operational and maintenance costs to assess project profitability.
-
Environmental Impact Metrics: Measure carbon savings and environmental impact by comparing renewable energy production to traditional energy sources.
-
Energy Efficiency Metrics: Track energy efficiency for conversion and distribution, ensuring optimal system performance and reducing energy loss.
-
Maintenance and Downtime: Monitor scheduled maintenance, equipment performance, and downtime to minimize system interruptions and ensure reliable energy production.
-
Custom Reports: Generate detailed reports summarizing energy production, financial performance, efficiency, and environmental impact for better decision-making.
How to Use the Renewable Energy KPI Dashboard in Power BI:
1️⃣ Download the Template – Instantly access your Power BI file upon purchase.
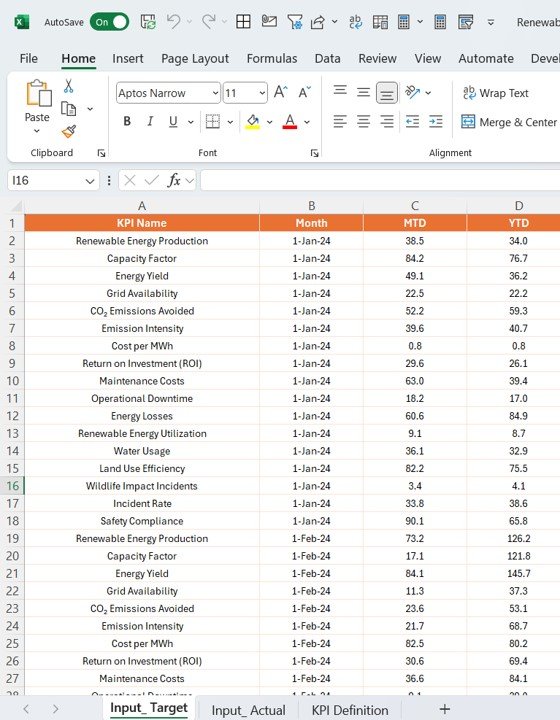
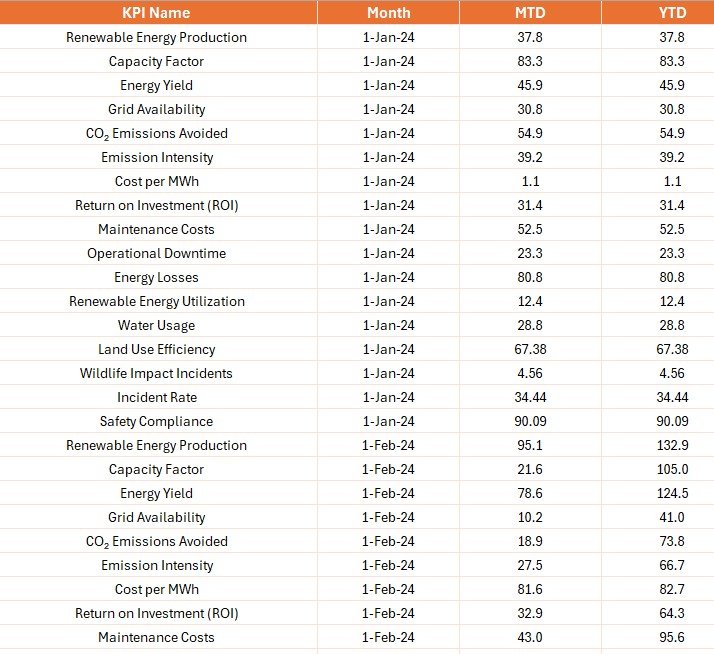
2️⃣ Input Energy and Financial Data – Enter data such as energy production figures, cost, revenue, and maintenance schedules to begin tracking KPIs.
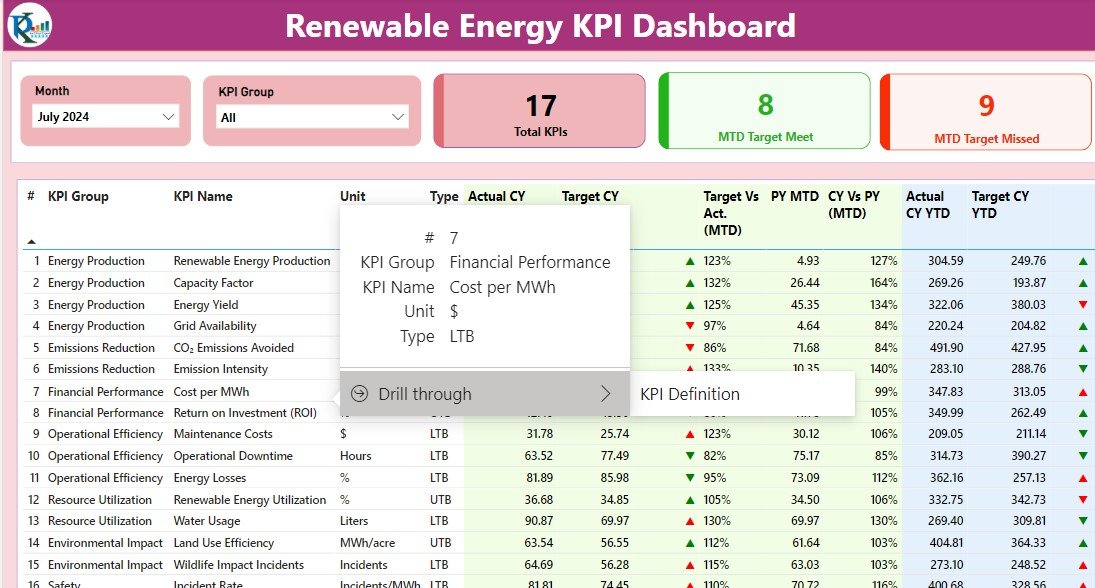
3️⃣ Monitor Key Metrics – Use the dashboard to track energy production, financial performance, carbon reduction, and system efficiency in real-time.
4️⃣ Evaluate Environmental Impact – Track carbon emissions saved and assess the environmental benefits of your renewable energy systems.
5️⃣ Generate Reports – Create custom reports summarizing the performance of your renewable energy projects, including production, financials, and environmental impact.
Who Can Benefit from the Renewable Energy KPI Dashboard in Power BI:
-
Renewable Energy Companies and Developers
-
Energy Project Managers
-
Sustainability Consultants
-
Environmental Analysts
-
Financial Analysts in Energy
-
Renewable Energy Technicians
-
Power Generation Operators
-
Policy Makers in Renewable Energy
-
Utility Companies
-
Carbon Footprint Reduction Specialists
The Renewable Energy KPI Dashboard in Power BI is the perfect tool for managing and optimizing renewable energy projects. By tracking key metrics such as energy production, financial performance, and environmental impact, this dashboard helps ensure that your renewable energy initiatives are operating efficiently and contributing to sustainable growth.
Click here to read the Detailed blog post
https://www.pk-anexcelexpert.com/renewable-energy-kpi-dashboard-in-power-bi/
Visit our YouTube channel to learn step-by-step video tutorials
Youtube.com/@PKAnExcelExpert


Reviews
There are no reviews yet.