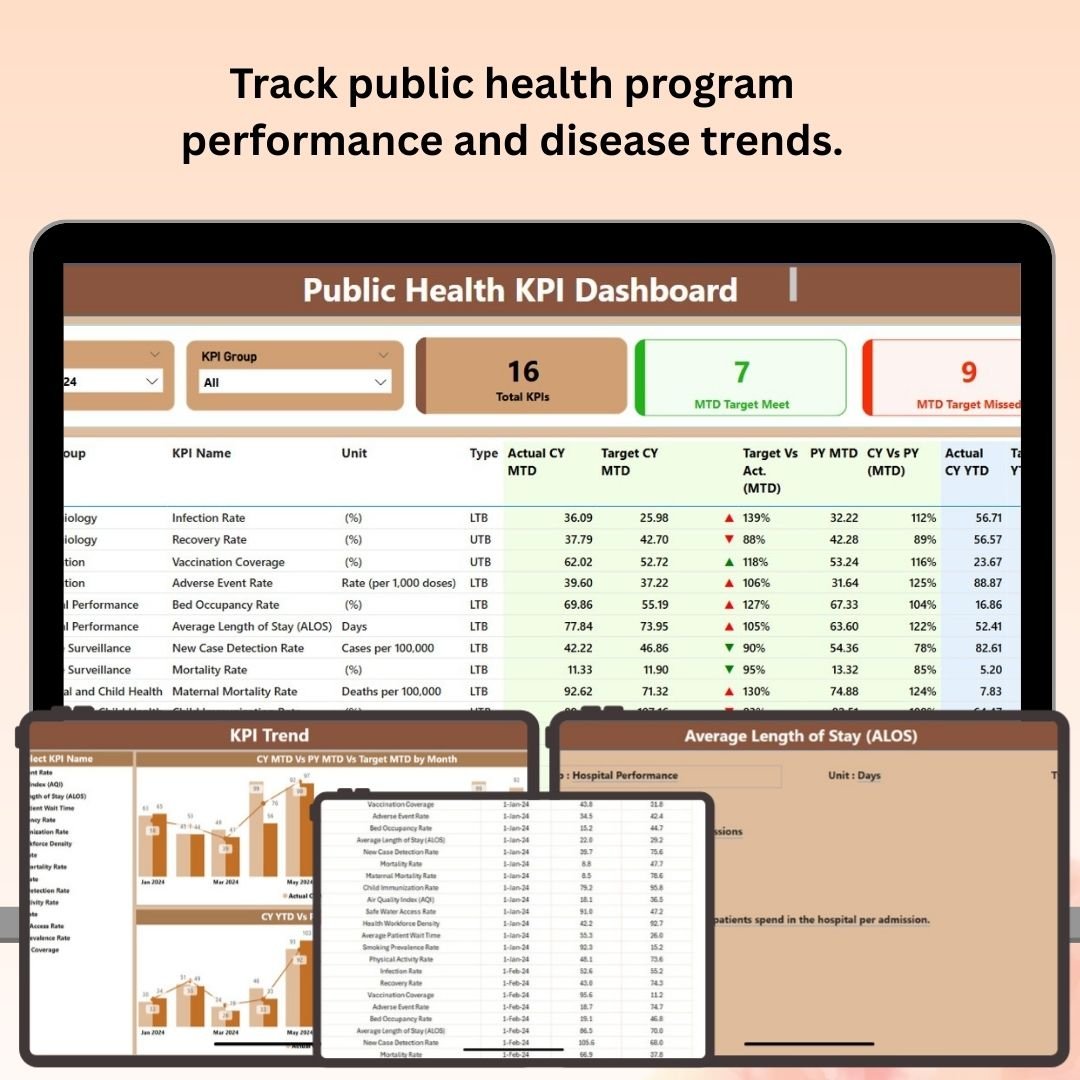
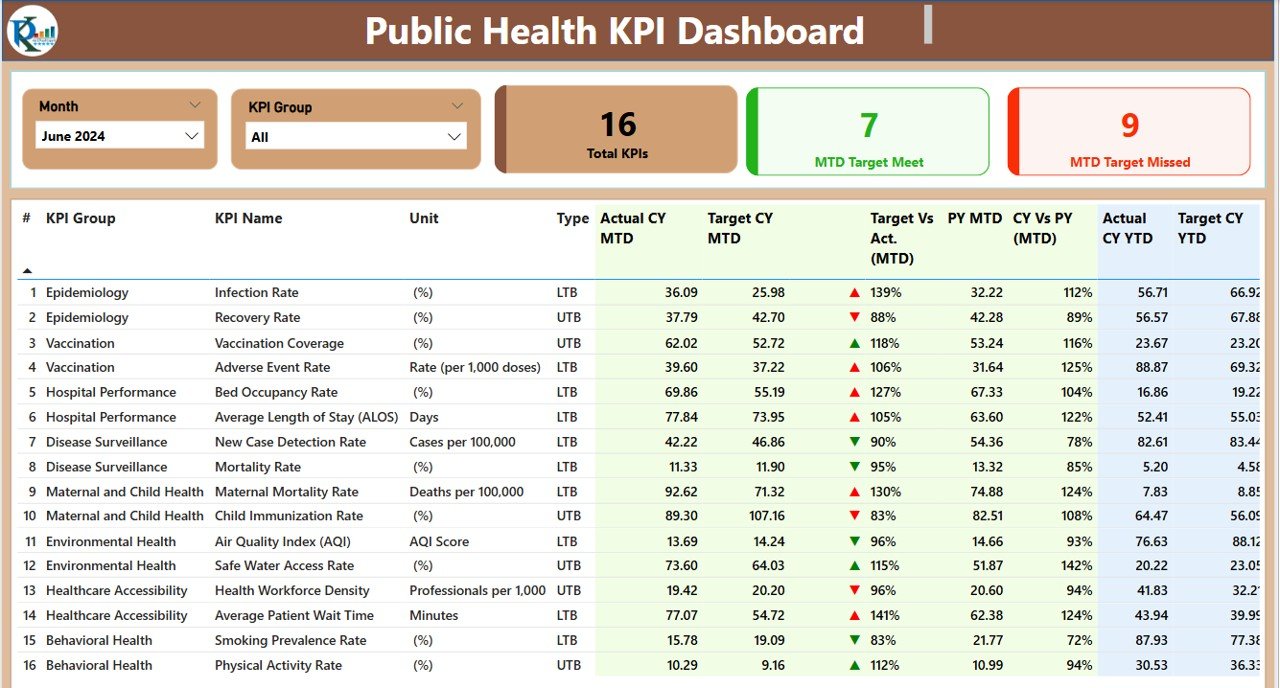
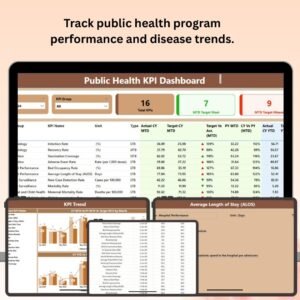
The Public Health KPI Dashboard in Power BI is an essential tool for healthcare administrators, public health officials, and analysts who need to monitor and optimize public health programs. This Power BI-based dashboard allows you to track key performance indicators (KPIs) such as disease incidence rates, vaccination coverage, health outcomes, resource utilization, and health system performance, helping to make data-driven decisions for improving public health outcomes.
With interactive visualizations, real-time tracking, and customizable reports, this dashboard helps public health organizations assess the effectiveness of their programs, allocate resources efficiently, and respond proactively to health issues.
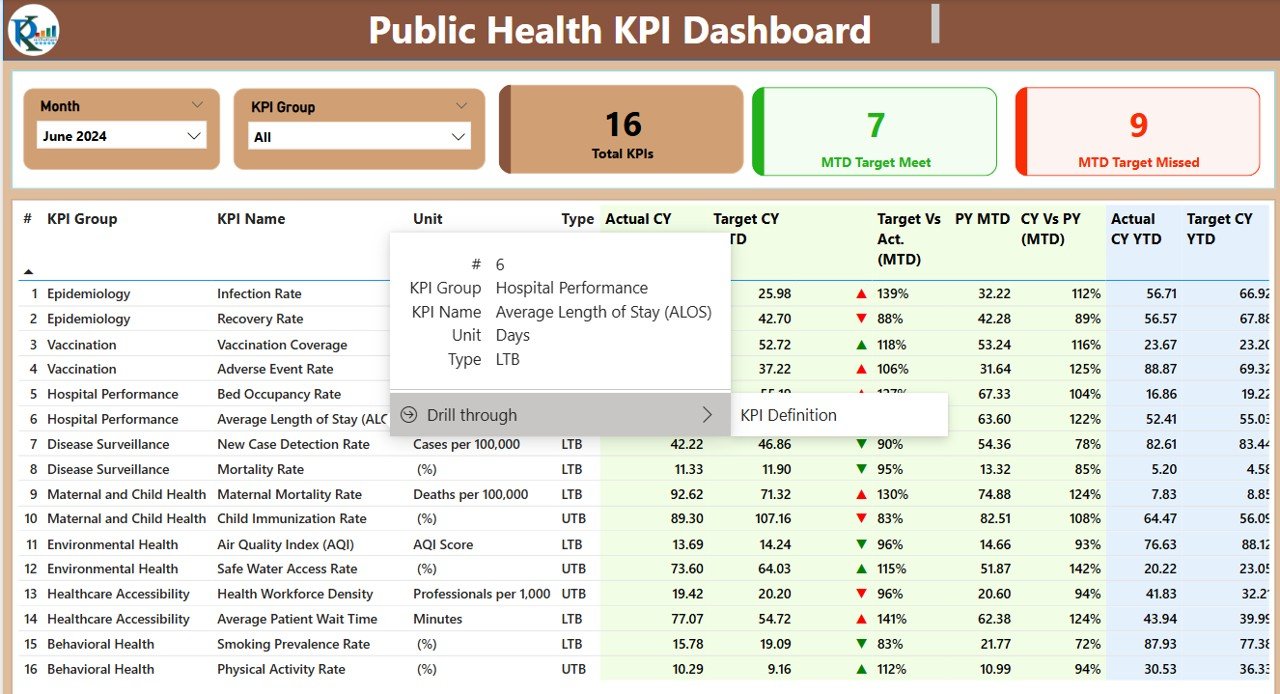
Key Features of the Public Health KPI Dashboard in Power BI:
🏥 Health Program Performance Tracking
Track the progress and performance of various public health programs, from disease prevention to health promotion, ensuring the effectiveness of your initiatives.
📊 Disease Surveillance and Incidence Rates
Monitor disease trends, including outbreak tracking and incidence rates, to identify areas requiring immediate attention and intervention.
💉 Vaccination Coverage and Immunization Rates
Track vaccination coverage rates across different populations and geographic areas to ensure that immunization programs are reaching the intended recipients.
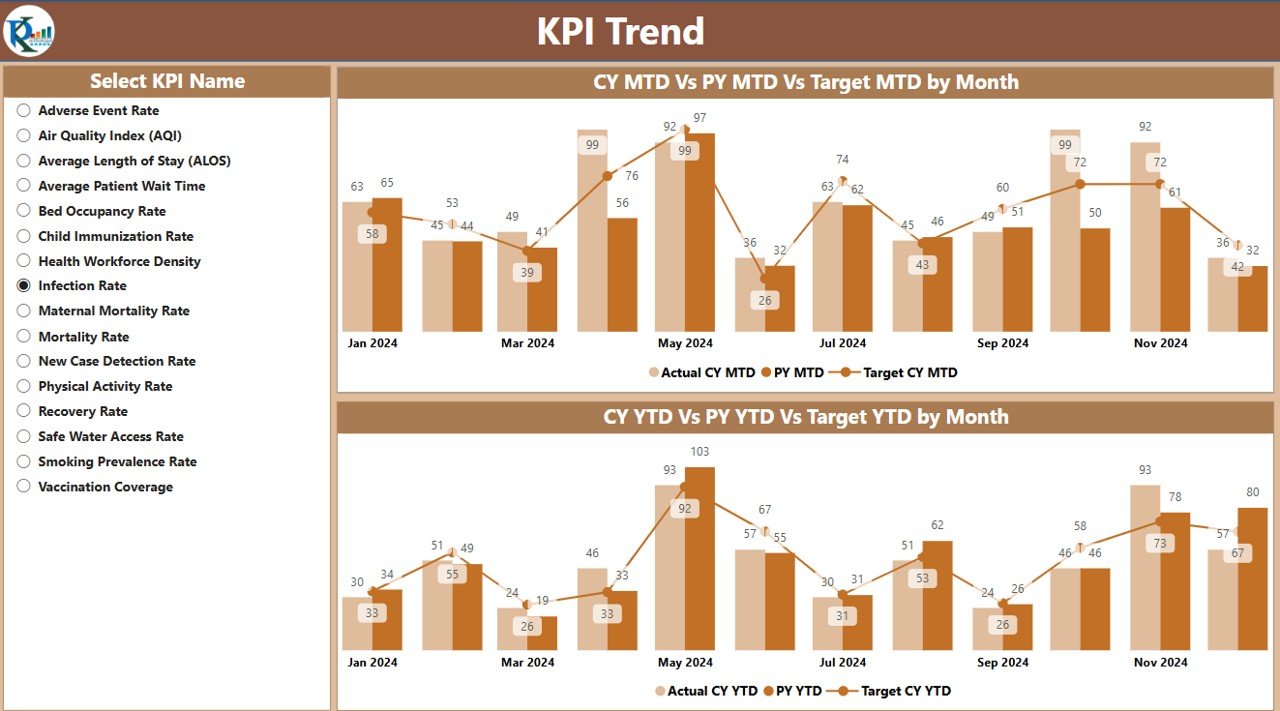
📈 Health Outcome Monitoring
Monitor critical health outcomes, such as mortality rates, morbidity, and life expectancy, to evaluate the overall effectiveness of public health programs.
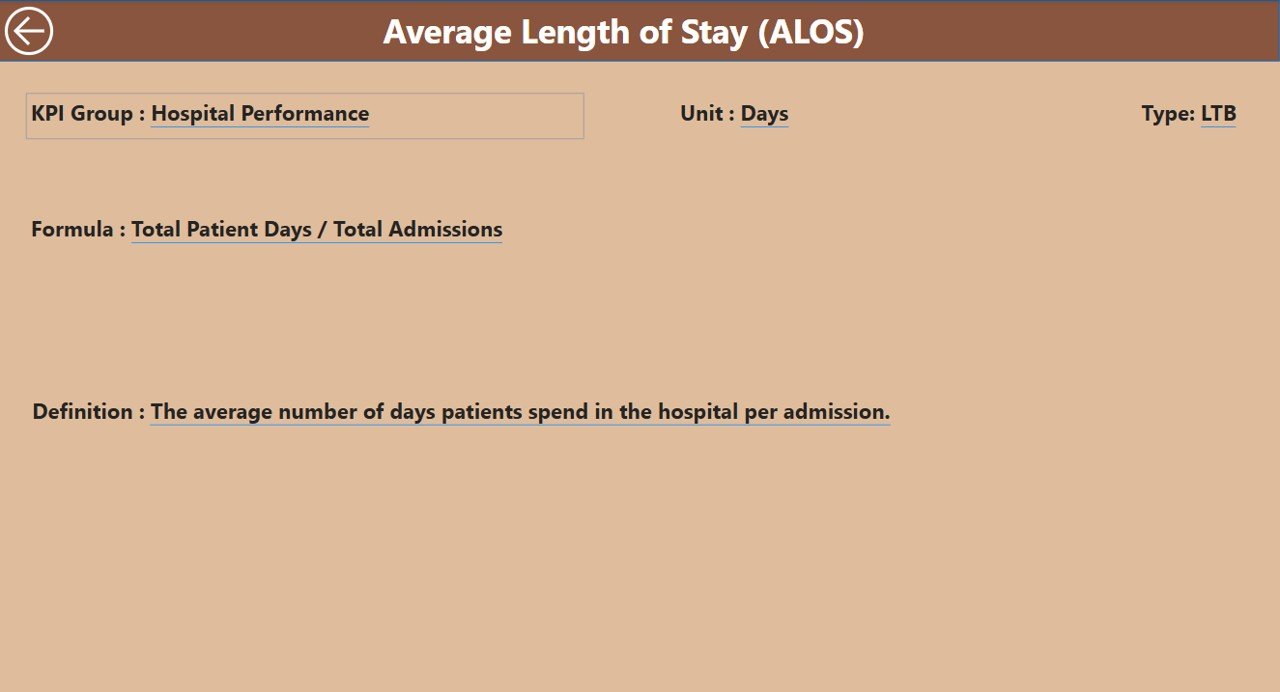
🩺 Healthcare Resource Utilization
Track healthcare resource utilization, including hospital bed occupancy, medical supplies, and healthcare worker availability, to optimize resource allocation.
🚀 Why You’ll Love the Public Health KPI Dashboard in Power BI:
✅ Monitor Health Program Success – Track key metrics for various public health programs, from disease prevention to health promotion, ensuring effectiveness and optimization.
✅ Track Disease Trends – Monitor disease incidence rates, outbreaks, and health-related trends to respond proactively to public health challenges.
✅ Optimize Immunization Efforts – Track vaccination coverage rates, identify gaps in coverage, and ensure that immunization programs are reaching target populations.
✅ Assess Health Outcomes – Measure mortality, morbidity, and other health outcomes to evaluate public health effectiveness and identify areas for improvement.
✅ Manage Healthcare Resources – Track healthcare resource utilization to ensure optimal distribution and avoid shortages during high-demand periods.
✅ Customizable and Interactive – This Power BI dashboard is highly customizable and interactive, allowing you to tailor it to your specific public health goals and KPIs.
What’s Inside the Public Health KPI Dashboard in Power BI:
-
Health Program Performance: Track the progress of public health programs, including disease prevention, immunization campaigns, and health education efforts.
-
Disease Surveillance: Monitor disease incidence rates, trends, and outbreaks to ensure quick responses to emerging health threats.
-
Vaccination Coverage: Track vaccination coverage rates, including population-specific data, to ensure effective immunization programs.
-
Health Outcome Indicators: Measure key health outcomes like mortality rates, life expectancy, and disease-specific morbidity to evaluate public health interventions.
-
Healthcare Resource Tracking: Track the utilization of healthcare resources, such as hospital capacity, medical supplies, and healthcare worker availability, to optimize response strategies.
-
Custom Reports: Generate customized reports based on your data to present insights to stakeholders, policymakers, or the public.
How to Use the Public Health KPI Dashboard in Power BI:
1️⃣ Download the Template – Instantly access your Power BI file upon purchase.
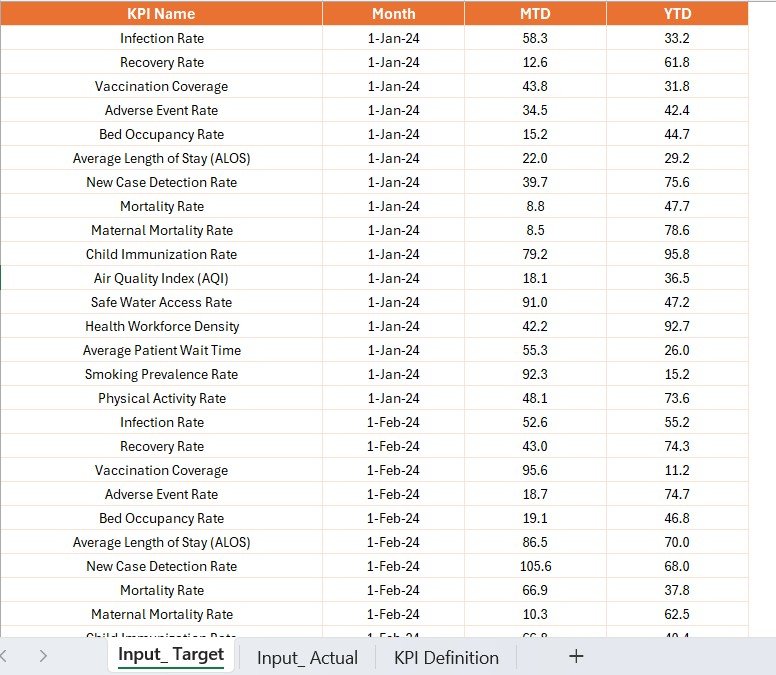
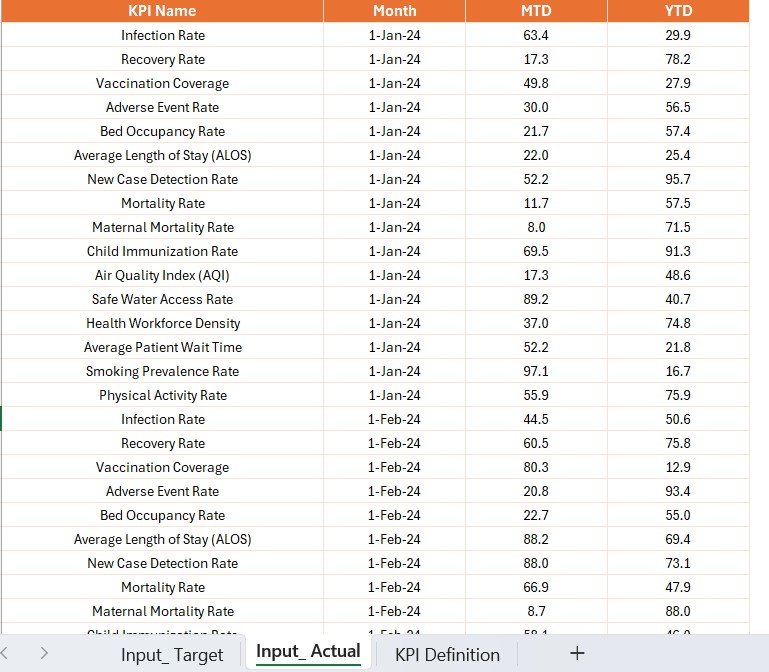
2️⃣ Input Health Data – Enter public health data such as disease incidence rates, vaccination numbers, health outcomes, and healthcare resources into the dashboard.
3️⃣ Monitor Key Metrics – Use the dashboard to track disease trends, immunization coverage, health outcomes, and healthcare resource utilization in real-time.
4️⃣ Analyze Trends – Use interactive charts and graphs to analyze long-term health trends, vaccine coverage gaps, and the effectiveness of health interventions.
5️⃣ Generate Custom Reports – Create tailored reports to share insights with government agencies, public health organizations, or other stakeholders.
Who Can Benefit from the Public Health KPI Dashboard in Power BI:
-
Public Health Officials
-
Healthcare Administrators
-
Epidemiologists and Disease Surveillance Experts
-
Immunization Program Coordinators
-
Government and Non-Profit Health Organizations
-
Health Policy Makers and Analysts
-
Healthcare Resource Managers
-
Data Analysts in Public Health
The Public Health KPI Dashboard in Power BI is the perfect solution for organizations looking to optimize their public health programs, improve disease monitoring, and ensure that healthcare resources are effectively utilized. By tracking key metrics and measuring health outcomes, this dashboard enables data-driven decisions to improve public health across communities.
Click here to read the Detailed blog post
https://www.pk-anexcelexpert.com/public-health-kpi-dashboard-in-power-bi/
Visit our YouTube channel to learn step-by-step video tutorials
Youtube.com/@PKAnExcelExpert


Reviews
There are no reviews yet.