📦 Key Features of Product Inventory Dashboard in Excel
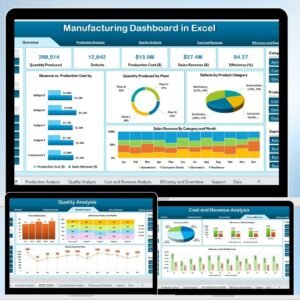
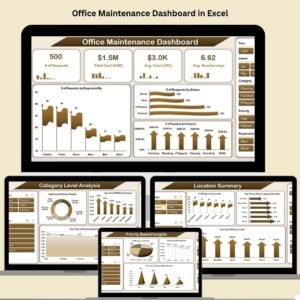
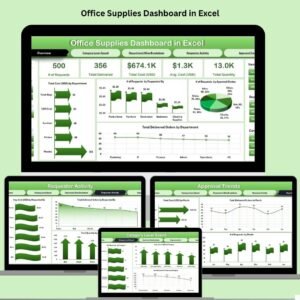
📊 All-in-One Inventory Control Center
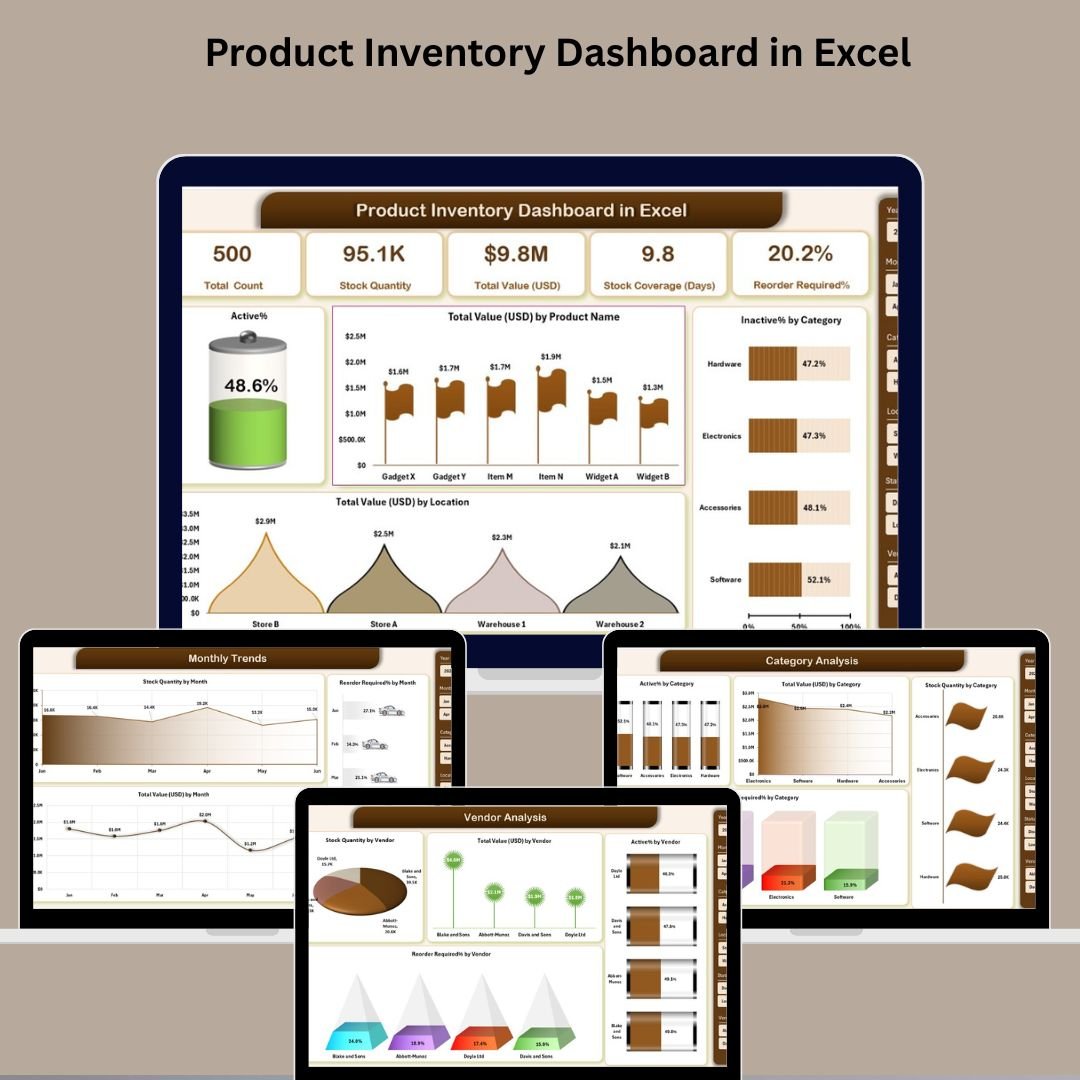
Manage your stock levels, monitor product performance, and track reorder needs across categories, vendors, and locations—all from a single, interactive Excel dashboard.
🔍 5 Dynamic Dashboard Pages
Navigate through powerful pages like Overview, Category Analysis, Location Analysis, Vendor Analysis, and Monthly Trends—each equipped with smart slicers and insightful visuals.
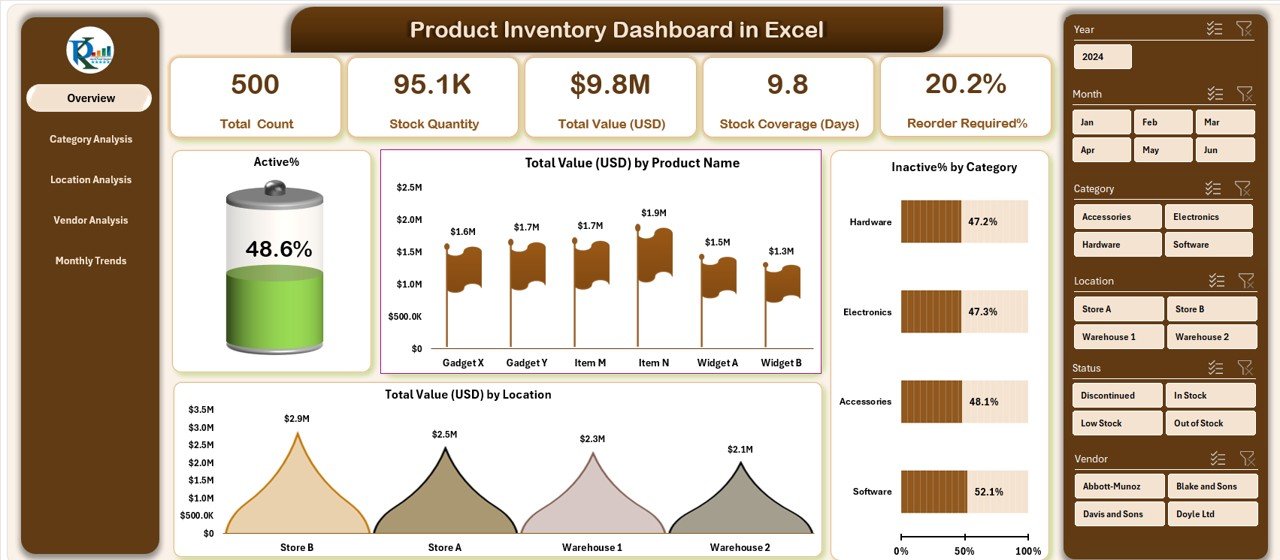
📋 Smart KPI Cards and Visual Charts
View essential metrics instantly:
-
✅ Total Products
-
📦 Active & Inactive Products (%)
-
💰 Total Inventory Value
-
⚠️ Reorder Alerts
Backed by powerful charts like:
-
Active % (Doughnut)
-
Inventory Value by Product (Column)
-
Reorder % by Category/Location/Vendor (Line)
-
Value by Location (Pie)
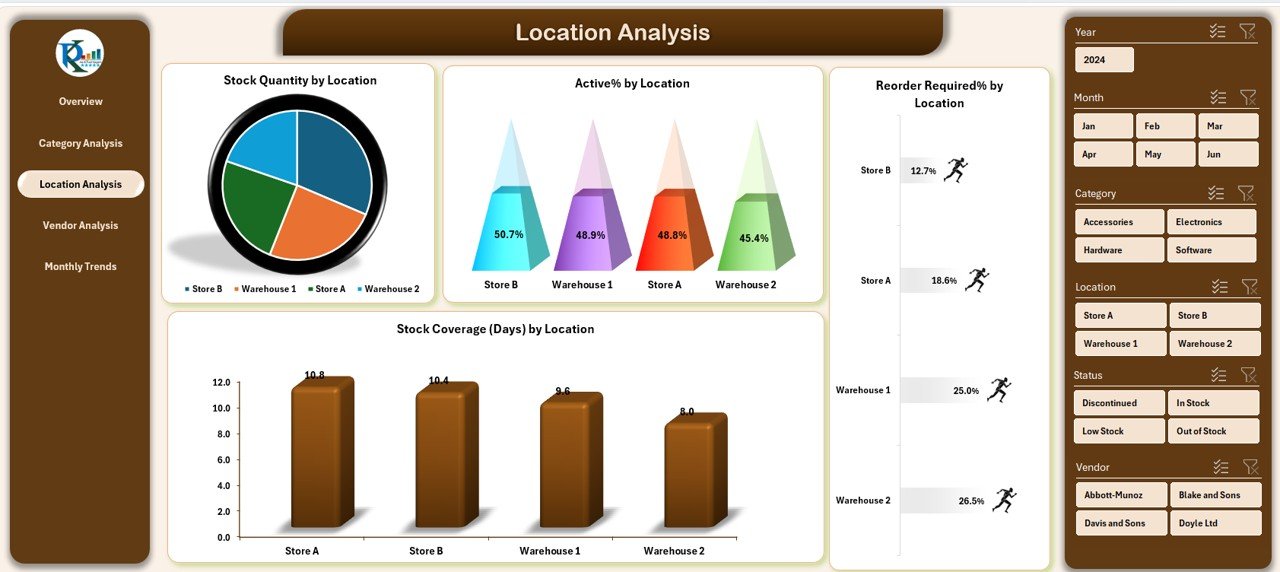
📍 Multi-Location Inventory Management
Compare stock, reorder needs, and stock coverage across warehouses, retail stores, or outlets.
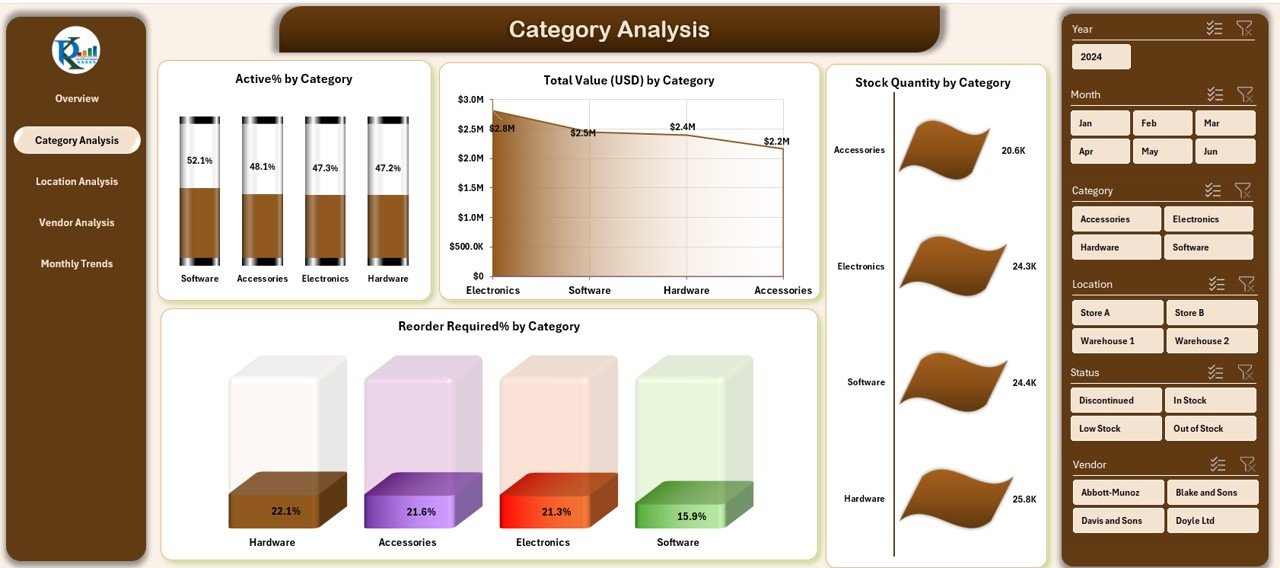
📑 Category-Wise Deep Dive
Analyze stock quantity, inventory value, and reorder requirements by product category—quickly identify overstock or low-moving categories.
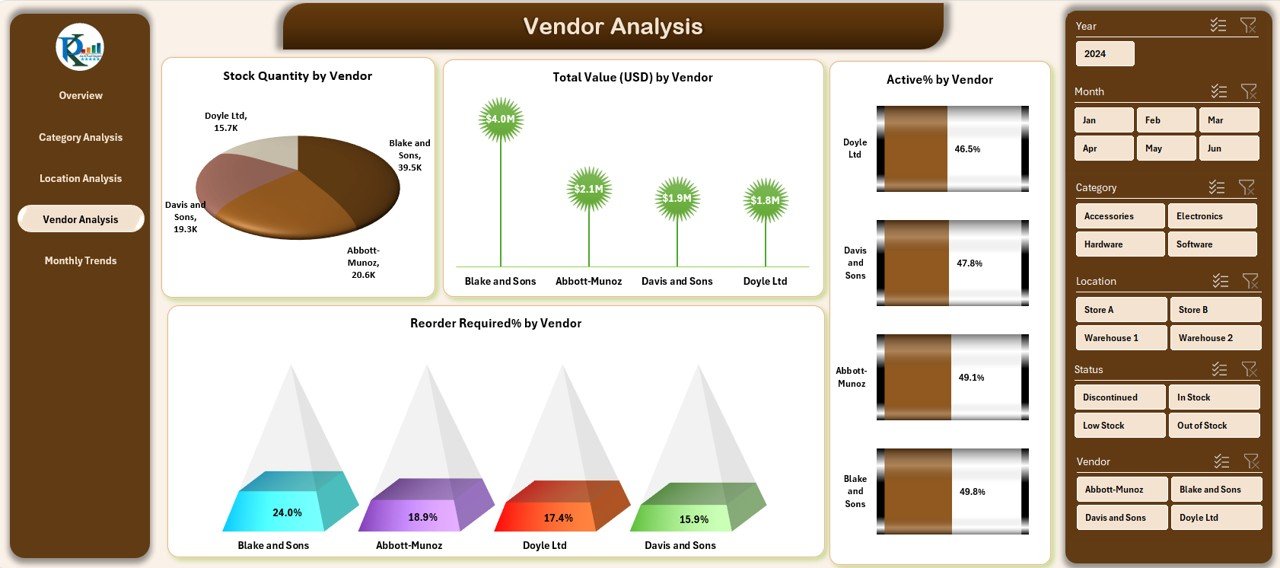
🚚 Vendor Performance Tracker
Evaluate vendor efficiency by looking at their supply volume, reorder frequencies, and stock health.
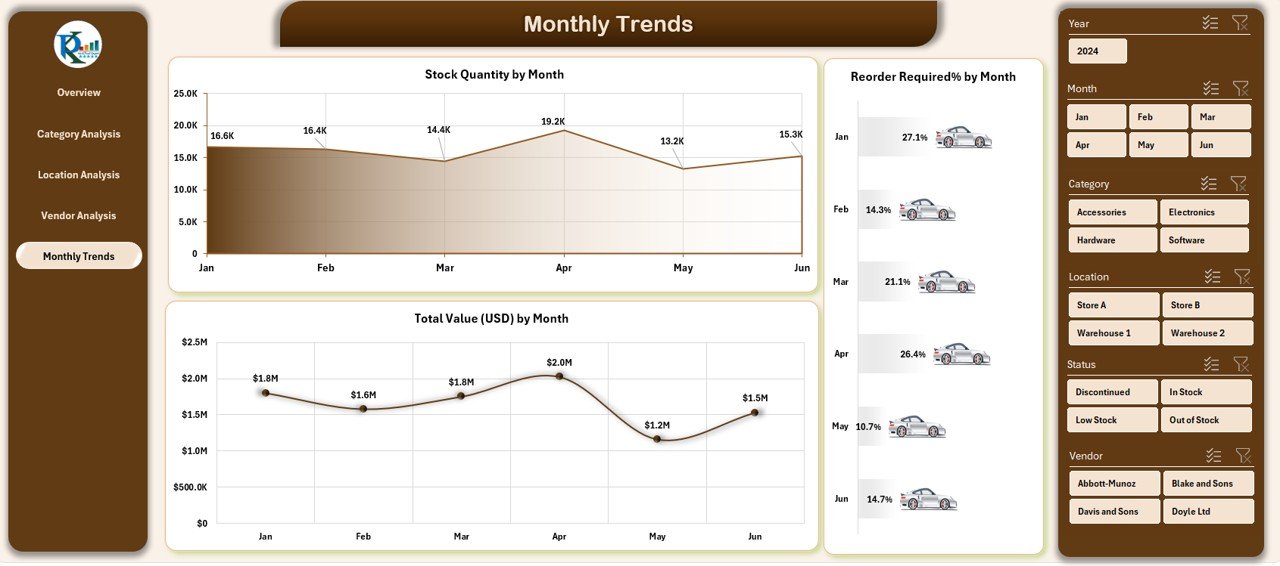
📅 Monthly Trends for Forecasting
Track inventory value, stock movement, and reorder alerts month-over-month—perfect for planning seasonal stock or promotional campaigns.
📥 Excel-Powered & User-Friendly
No plugins or coding needed—just open in Excel and start analyzing. Compatible with Excel 2016 and above.
📂 What’s Inside the Product Inventory Dashboard in Excel
✅ Excel File (.xlsx) – Prebuilt and ready to use
✅ 7 Worksheet Tabs:
-
Overview – Summary cards and charts
-
Category Analysis – Product group performance
-
Location Analysis – Warehouse and store insights
-
Vendor Analysis – Track supplier performance
-
Monthly Trends – Time-based inventory movement
-
Data Sheet – Raw inventory input
-
Support Sheet – Dropdowns and background logic
✅ Interactive Slicers – Filter by status, category, vendor, location, or month
✅ Pivot-Powered Charts – Reliable, real-time calculations
✅ Automated KPIs – No manual formulas needed
✅ Easy to Customize – Modify fields, chart types, or add pages
✅ Ready to Share – Email the file or upload to shared drives
⚙️ How to Use the Product Inventory Dashboard
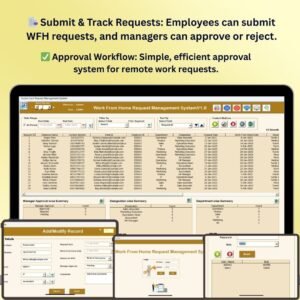
📁 Step 1: Input Data
Enter your product records into the Data Sheet, including columns like Product Name, Category, Quantity, Location, Vendor, Status, and Reorder Level.
📊 Step 2: Review KPIs on the Overview Page
Get a snapshot of inventory value, stock status, and total alerts. Use slicers to focus on specific branches or vendors.
🧠 Step 3: Analyze by Category, Location, or Vendor
Navigate to different pages to get detailed insights, spot underperforming areas, and assess reorder urgency.
📈 Step 4: Monitor Monthly Trends
Use time-series visuals to optimize forecasting, procurement, and storage plans.
📤 Step 5: Share or Export
Save as Excel or export visuals for reports and stakeholder presentations.
👥 Who Can Benefit from This Dashboard
🏪 Retail Businesses – Stay on top of fast-moving and slow-moving stock
🏭 Warehouse Managers – Control stock coverage and prevent excess
🛒 E-commerce Sellers – Monitor multi-vendor supplies and location-wise inventory
📦 Procurement Teams – Analyze vendor efficiency and reorder planning
💰 Finance Teams – Track valuation, spot deadstock, and monitor supply costs
📈 Operations Managers – Make smart decisions using visual, actionable data


Reviews
There are no reviews yet.