Managing procurement data can be complex and time-consuming. With the Procurement Dashboard in Excel, you can visualize, track, and analyze procurement trends efficiently. This dashboard provides real-time insights into supplier performance, order quantities, pending payments, and cost distribution using interactive slicers, charts, and tables. Whether you’re overseeing a small business or managing large-scale procurement, this tool will enhance decision-making and optimize cost control.
Key Features of the Procurement Dashboard in Excel
1. Dashboard Sheet – Instant Overview of Procurement Data
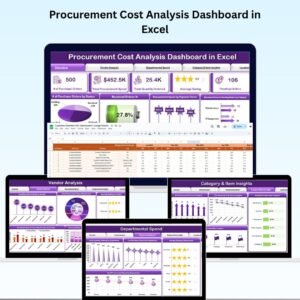
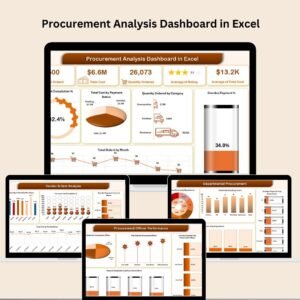
The main dashboard provides a real-time snapshot of key procurement metrics using interactive charts and slicers.
✅ Summary Cards
- Total Orders – View the total number of purchase orders.
- Quantity Ordered – See the total quantity of items procured.
- Pending Payments – Track outstanding payments for better financial management.
- Total Cost – Get a consolidated view of procurement spending.
- Percentage Paid – Understand the proportion of payments completed.
✅ Slicers – Dynamic Filtering Options
- Filter by Year, Month, Supplier Name, and Category
- Quickly analyze historical trends and compare procurement activity over time.
✅ Visual Charts for Clear Insights
- Total Cost by Category (Pie Chart) – Get a cost breakdown of consumables, electronics, and furniture.
- Total Cost by Supplier (Arrow Chart) – Compare total procurement costs for different suppliers.
- Total Cost by Month and Year (Line Chart) – Identify cost fluctuations over time.
- Total Cost by Location (Bar Chart) – Pinpoint high-spending locations for better cost allocation.

2. Detailed View Sheet – Drill Down into Procurement Data
The Detailed View Sheet provides granular insights into procurement activities with pivot tables and filters.
🔍 View and filter procurement details, including:
- Supplier Names – See which suppliers are delivering the most orders.
- Category & Item Names – Analyze cost distribution across product categories.
- Quantity & Total Cost – Evaluate procurement cost-effectiveness.
- Procurement Officer & Status – Track approvals, cancellations, and pending orders.
📊 Why This Feature is Important?
- Helps in supplier evaluation based on past orders.
- Enables procurement officers to prioritize urgent orders.
- Enhances financial planning by analyzing category-wise spending.
3. Data Sheet – The Foundation of the Dashboard
The Data Sheet acts as the backbone of the dashboard, containing all raw procurement data.
📑 Data Fields Include:
- PO Number, Supplier Name, Item Name, Category
- Order Date, Delivery Date, Quantity, Unit Price, Total Cost
- Location, Procurement Officer, Status, Payment Terms, Payment Status
💡 How It Works:
- Enter data manually or import from other sources.
- The dashboard updates automatically, reflecting real-time procurement activity.
4. Support Sheet – User Guidance & Optimization
The Support Sheet enhances usability and ensures accuracy in data entry.
🔹 What’s Included?
- Data Validation Rules – Prevents incorrect data entry.
- Formula Explanations – Understand key calculations used in the dashboard.
- Usage Tips – Best practices to maximize dashboard efficiency.
📌 Who Can Benefit from This Dashboard?
✅ Procurement Managers – Optimize supplier selection and cost tracking.
✅ Finance Teams – Improve payment tracking and budget allocation.
✅ Business Owners – Get a 360-degree view of procurement expenses.
✅ Supply Chain Analysts – Analyze trends and forecast procurement needs.
Why Choose This Procurement Dashboard?
✔ Easy-to-Use Interface – No complex setup required!
✔ Automated Calculations – Save time with pre-built formulas.
✔ Dynamic Data Filtering – Analyze data with one click.
✔ Clear Visuals & Charts – Instantly spot trends and anomalies.
✔ Excel-Based – No additional software needed!
Click here to read the detailed blog post procurement dashboard
Watch the step-by-step video tutorial:
Visit our YouTube channel to learn step-by-step video tutorials











Reviews
There are no reviews yet.