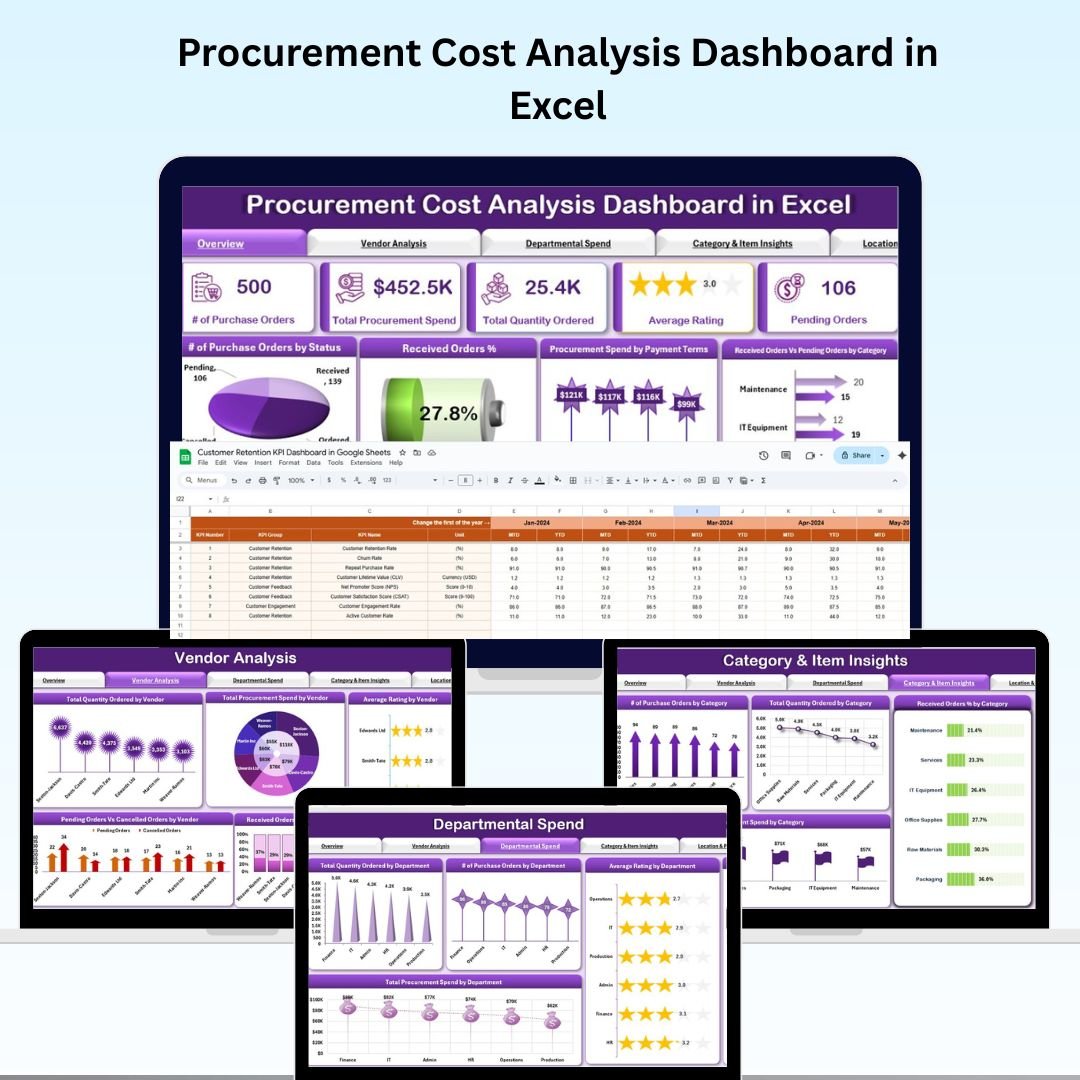
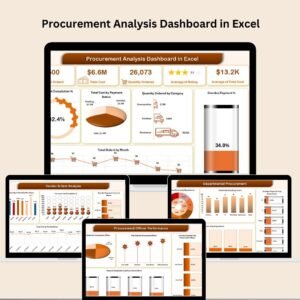
Managing procurement effectively is essential for keeping business operations smooth and controlling costs. 💼 The Procurement Cost Analysis Dashboard in Excel is a ready-to-use, interactive solution designed to give procurement teams a real-time view of spending, vendor performance, departmental budgets, and cost optimization opportunities.
With its clean design, pre-built charts, and automated calculations, this dashboard empowers decision-makers to track key procurement metrics, uncover inefficiencies, and make data-driven improvements — all within Excel. 📊✅
🔑 Key Features of the Procurement Cost Analysis Dashboard
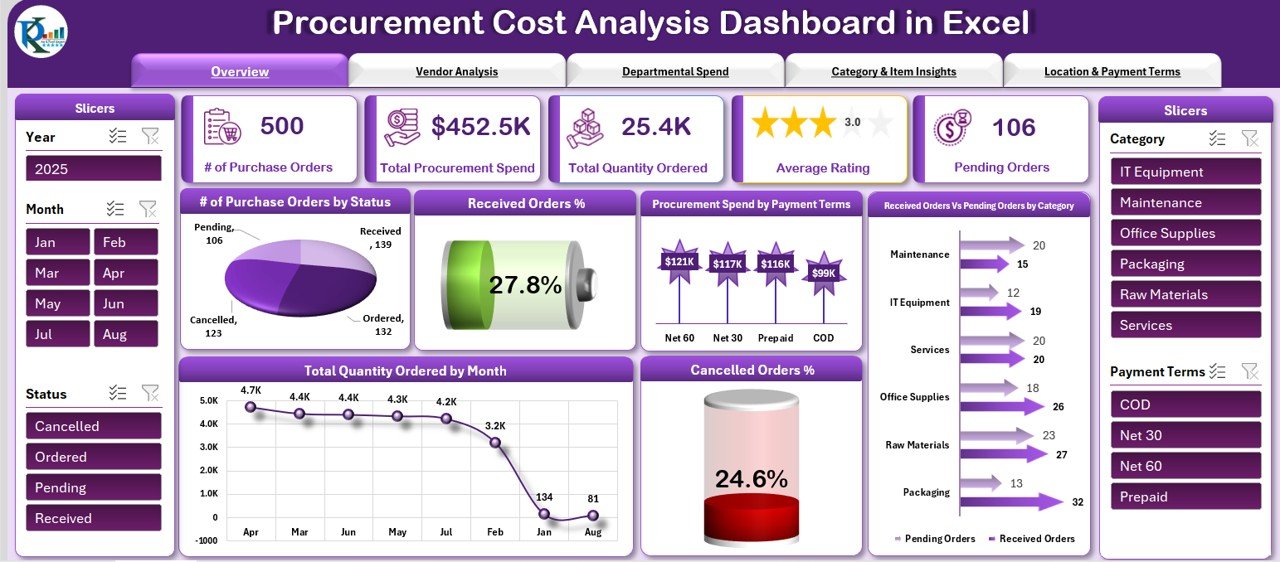
📌 Overview Sheet – Complete Procurement Summary
-
Cards for Key Metrics – Purchase Orders, Total Spend, Quantity Ordered, Average Rating, Pending Orders
-
Insightful Charts – Order Status, Received Orders %, Spend by Payment Terms, Received vs Pending Orders by Category, Quantity Ordered by Month, and Cancelled Orders %
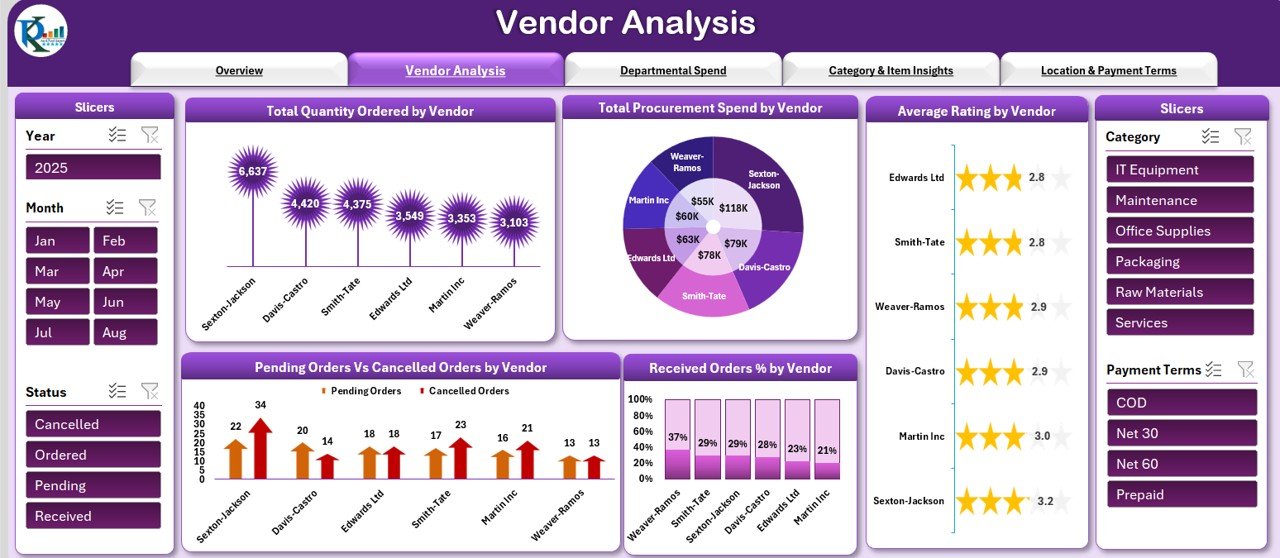
📌 Vendor Analysis – Measure Supplier Performance
-
Compare Total Spend, Quantity Ordered, Average Ratings, and Order Fulfillment % across vendors
-
Identify high-performing suppliers and flag those with high cancellation or pending rates
-
Optimize vendor partnerships with clear performance data
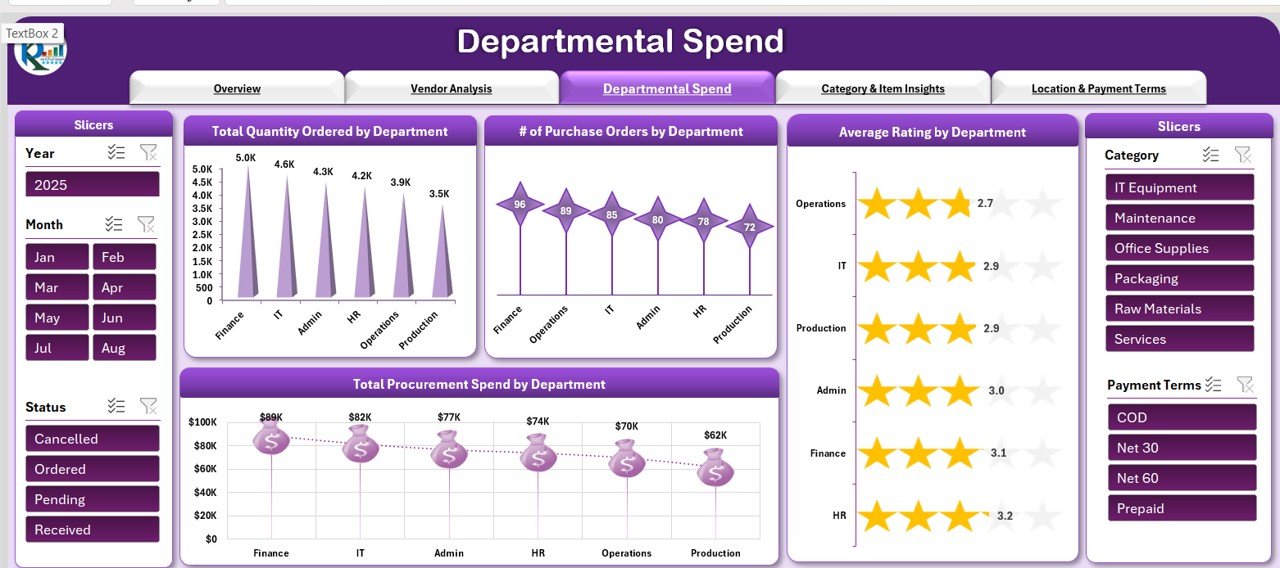
📌 Departmental Spend – Budget Tracking by Team
-
Monitor procurement activity per department
-
Track Quantity Ordered, Purchase Orders, Average Ratings, and Spend per department
-
Improve budget compliance and resource allocation
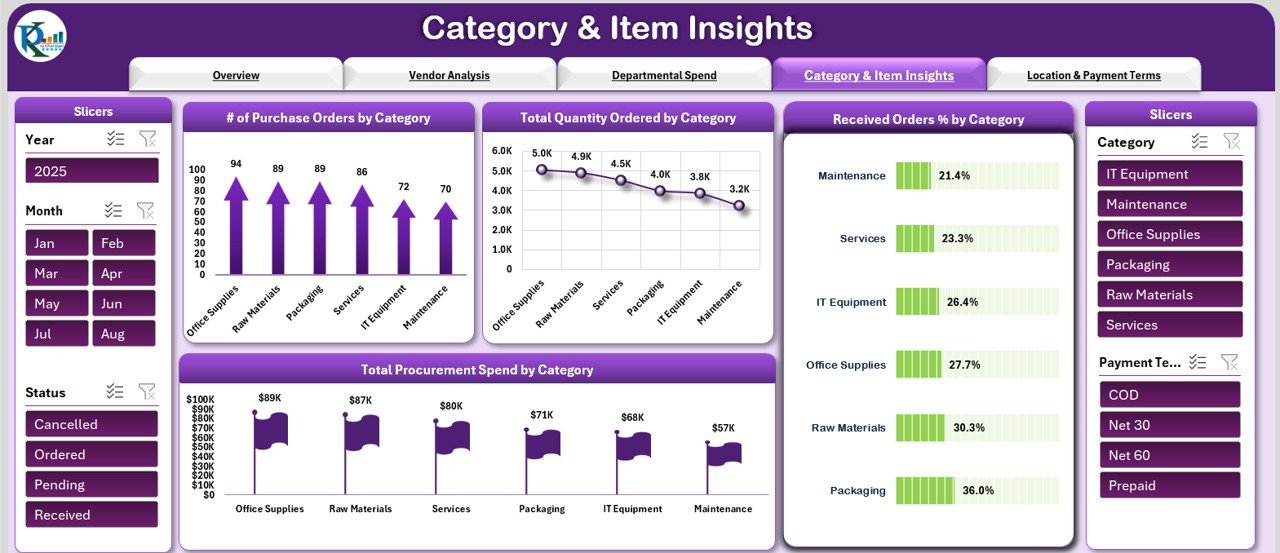
📌 Category & Item Insights – Understand Procurement Priorities
-
Analyze Purchase Orders, Quantities, Spend, and Fulfillment Rates by category
-
Identify high-cost procurement categories for better negotiation and planning
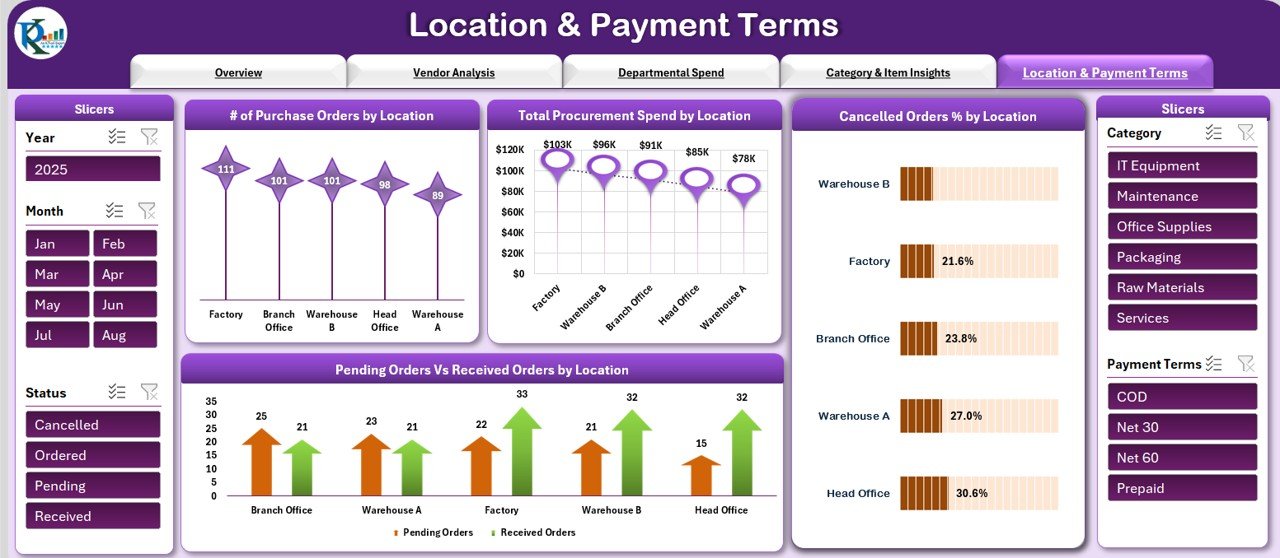
📌 Location & Payment Terms – Regional and Financial Insights
-
View procurement performance by location with spend, order counts, and cancellation rates
-
Analyze spending patterns by payment terms (Net 30, Net 60, etc.) to manage cash flow better
📌 Data Input Sheet – Centralized Data Entry
-
All procurement data entered here automatically updates the dashboard and all charts
-
Easy-to-use structure for consistent, accurate reporting
📦 What’s Inside the Procurement Cost Analysis Dashboard?
When you download this dashboard, you get:
✅ Overview Sheet – Key metrics and visual summaries
✅ Vendor Analysis Tab – Supplier performance breakdown
✅ Departmental Spend Tab – Department-level procurement tracking
✅ Category & Item Insights Tab – Category-wise cost analysis
✅ Location & Payment Terms Tab – Regional and payment term performance
✅ Data Input Sheet – Single entry point for all procurement data
✅ Pre-Built Charts & Formulas – Fully functional and ready to use
✅ Customizable Layout – Adapt it to your organization’s needs
🧠 How to Use the Procurement Cost Analysis Dashboard
-
Download & Open the Excel file
-
Enter Procurement Data into the Data Input Sheet
-
View Metrics in the Overview Sheet for a quick summary
-
Analyze Vendors, Departments, and Categories for cost optimization
-
Use Location & Payment Insights to refine purchasing strategies
-
Update Data Regularly to maintain real-time visibility
👥 Who Can Benefit from This Dashboard?
-
📦 Procurement Managers – Monitor costs, suppliers, and order status in one place
-
🏢 Finance Teams – Track spending patterns and ensure budget compliance
-
🛠 Operations Managers – Identify procurement bottlenecks and streamline processes
-
🌍 Multi-Location Businesses – Compare procurement performance across regions
-
🏭 Manufacturing & Retail Companies – Manage supplier relations and control category spending


Reviews
There are no reviews yet.