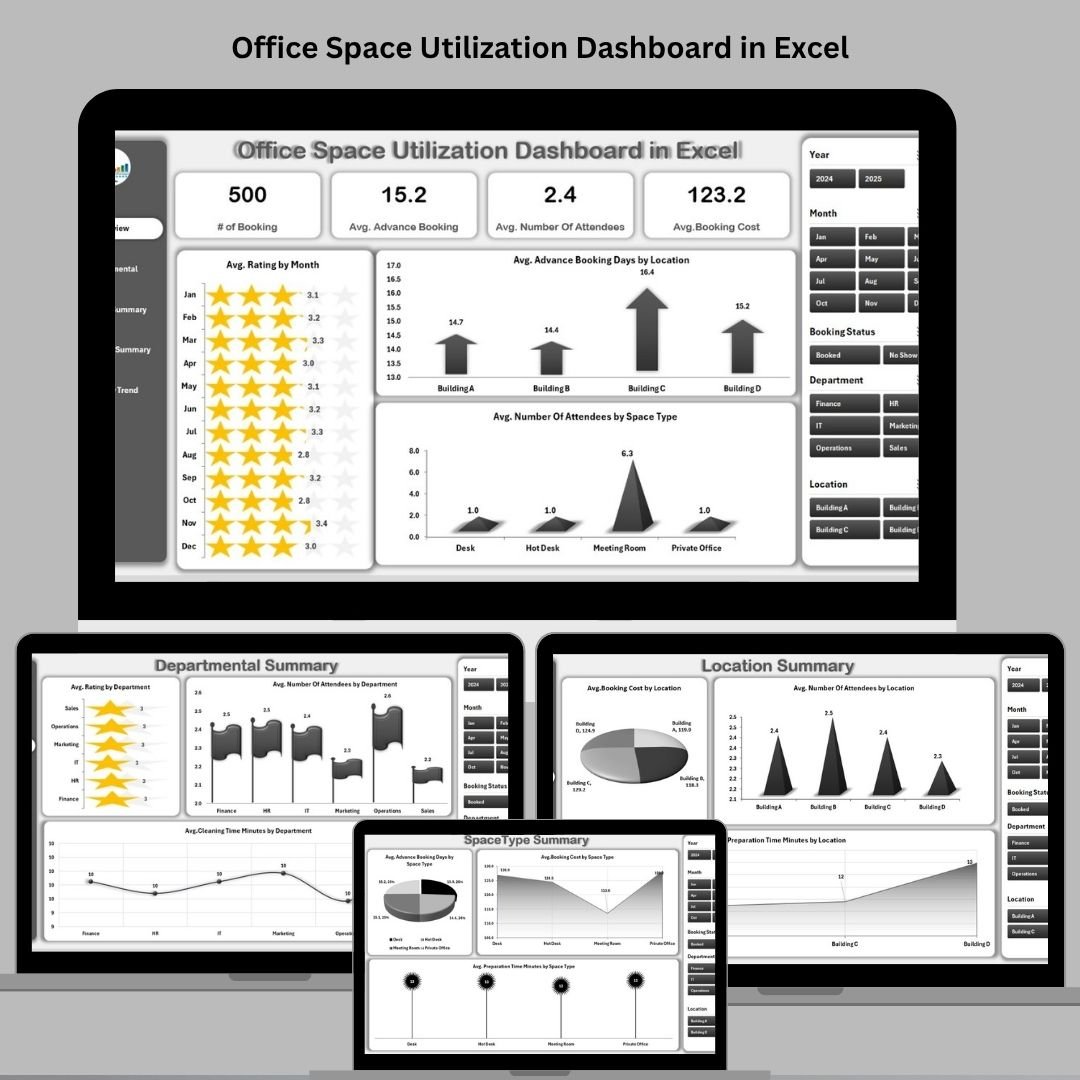
Whether you’re managing a single office or an entire corporate real estate portfolio, the Office Space Utilization Dashboard in Excel empowers you to track, visualize, and optimize the way teams interact with your shared spaces. No expensive software. No IT support needed. Just paste your booking data, and Excel does the rest.
🔍 What’s Inside the Dashboard?
This template includes 5 fully interactive pages, each designed to provide focused insights:
1️⃣ Overview Page
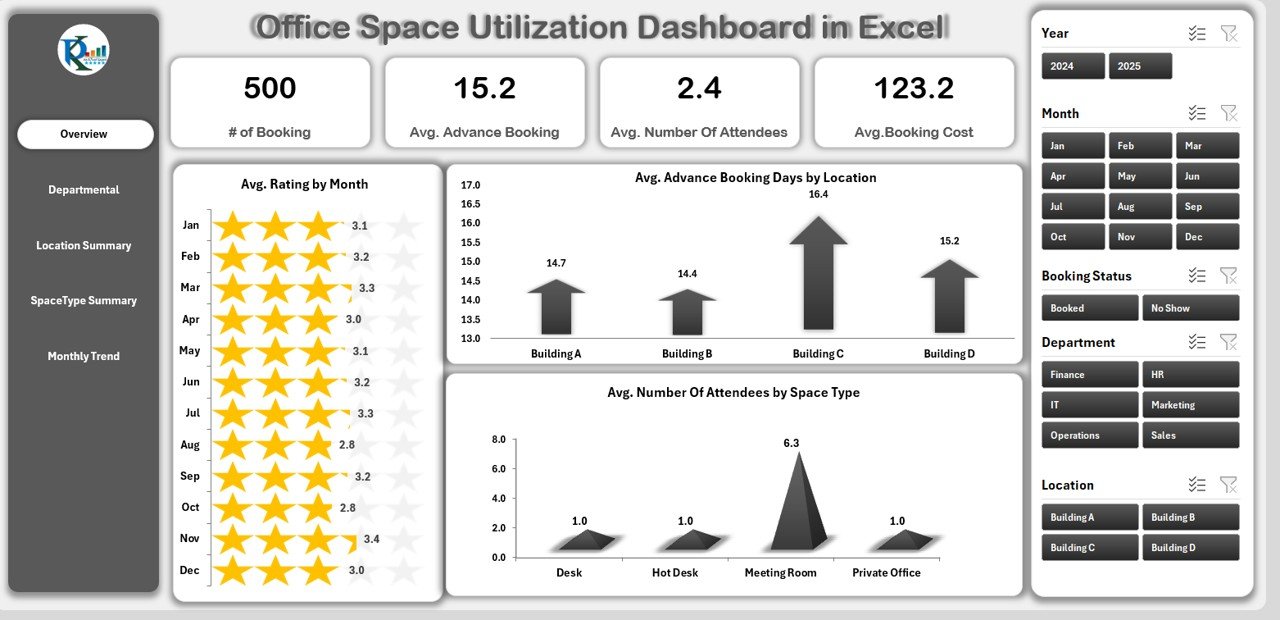
Your executive summary for space utilization.
📌 KPI Cards:
-
Total Bookings
-
Average Duration (Hours)
-
Total Number of Attendees
-
Overall Booking Cost
📊 Charts:
-
Avg. Rating by Month
-
Avg. Advance Booking Days by Location
-
Avg. Attendees by Space Type
-
Avg. Preparation Time by Department
🎯 Use slicers to filter by Month, Location, Department, and more.
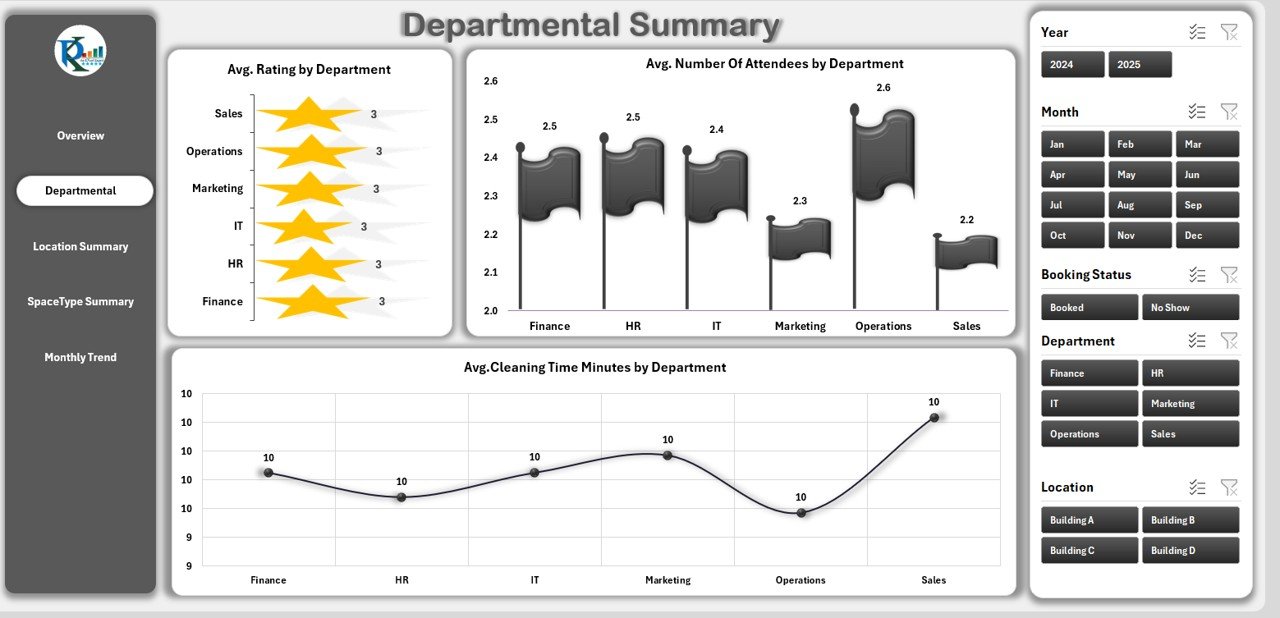
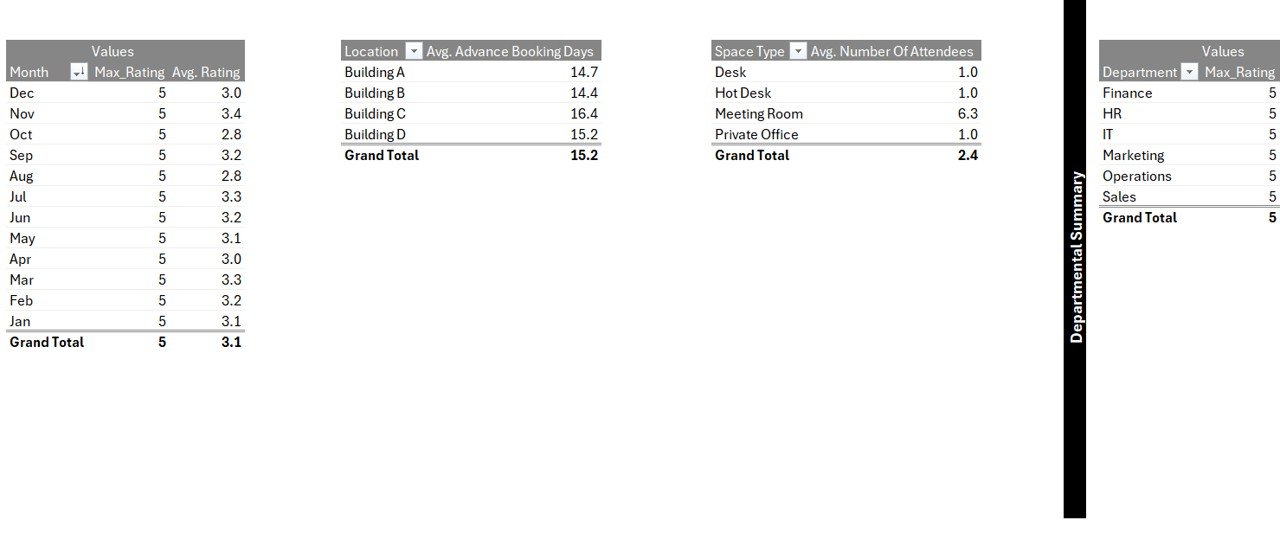
2️⃣ Departmental Summary
Understand how different teams use shared space.
📊 Charts included:
-
Avg. Rating by Department
-
Avg. Number of Attendees
-
Avg. Cleaning Time by Department
👥 Compare space behavior and assign resources accordingly.
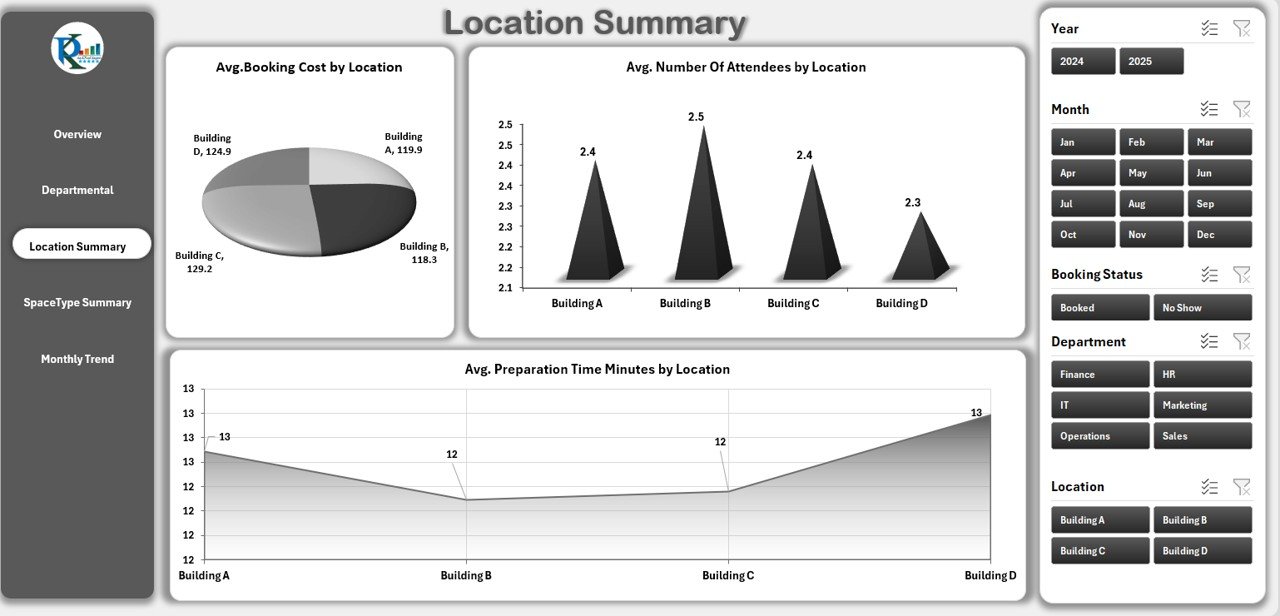
3️⃣ Location Summary
Ideal for multi-building or multi-site organizations.
📊 Charts included:
-
Avg. Booking Cost
-
Avg. Attendees
-
Avg. Preparation Time by Location
🏢 See which locations drive the most cost or usage.
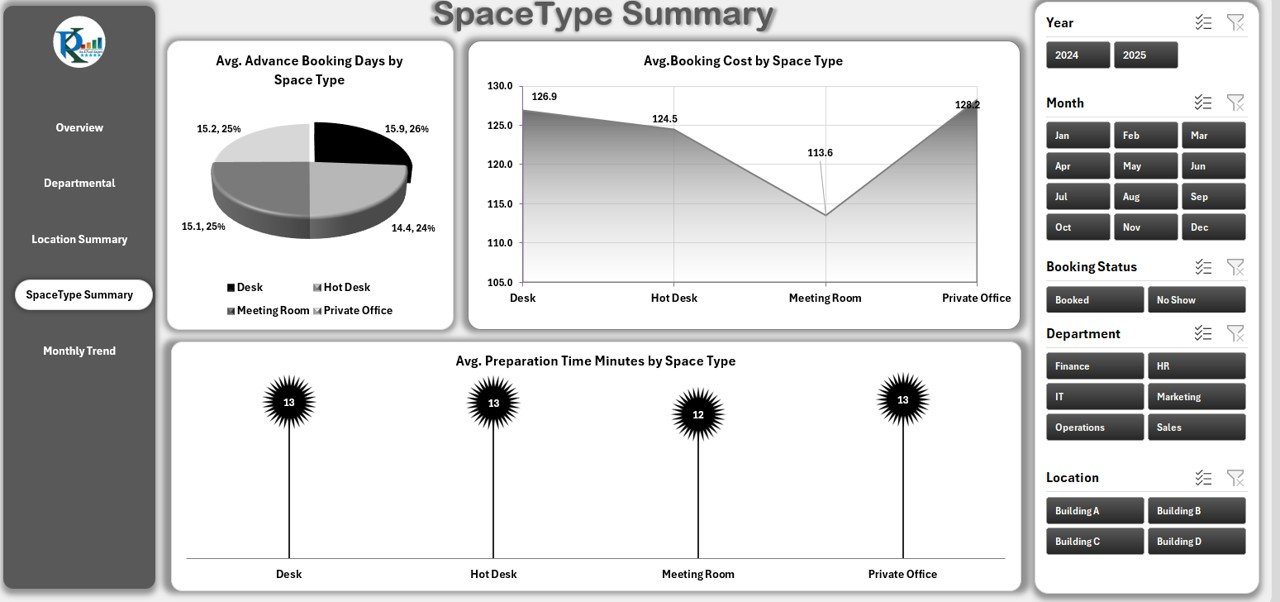
4️⃣ Space Type Summary
Track demand for meeting rooms, hot desks, and more.
📊 Charts included:
-
Avg. Advance Booking Days
-
Avg. Booking Cost
-
Avg. Preparation Time
📌 Identify which types of spaces require more time, money, or cleaning.
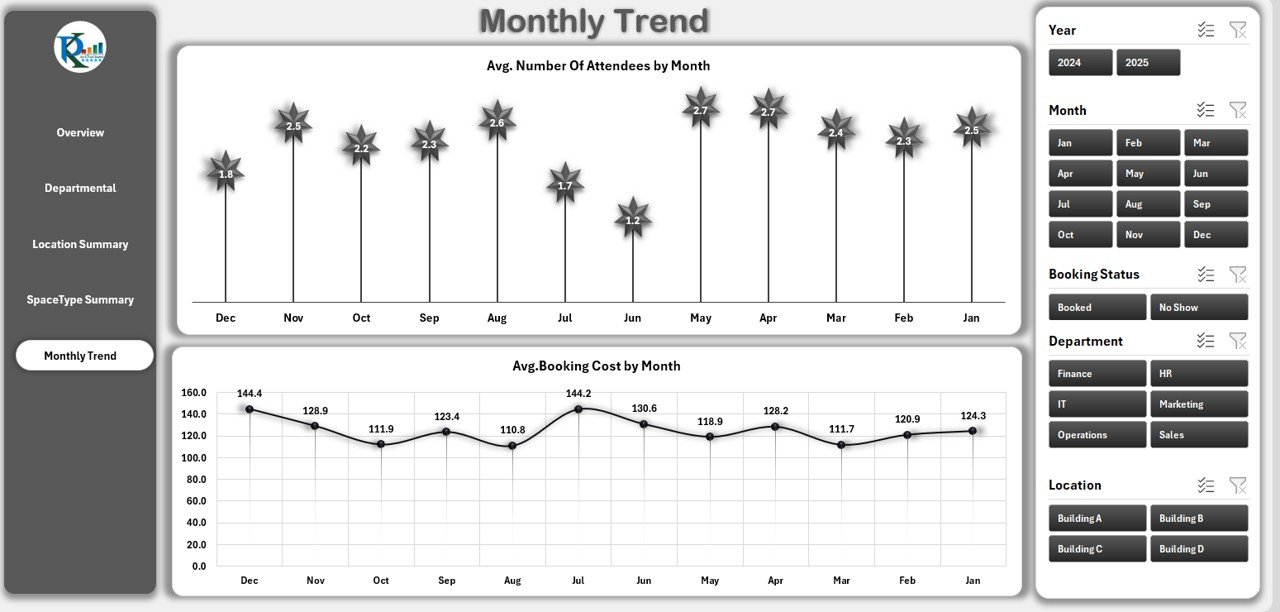
5️⃣ Monthly Trend Page
Your go-to for forecasting and trend analysis.
📊 Charts:
-
Avg. Attendees by Month
-
Avg. Booking Cost by Month
📅 Adjust budgets, capacity planning, and layout with confidence.
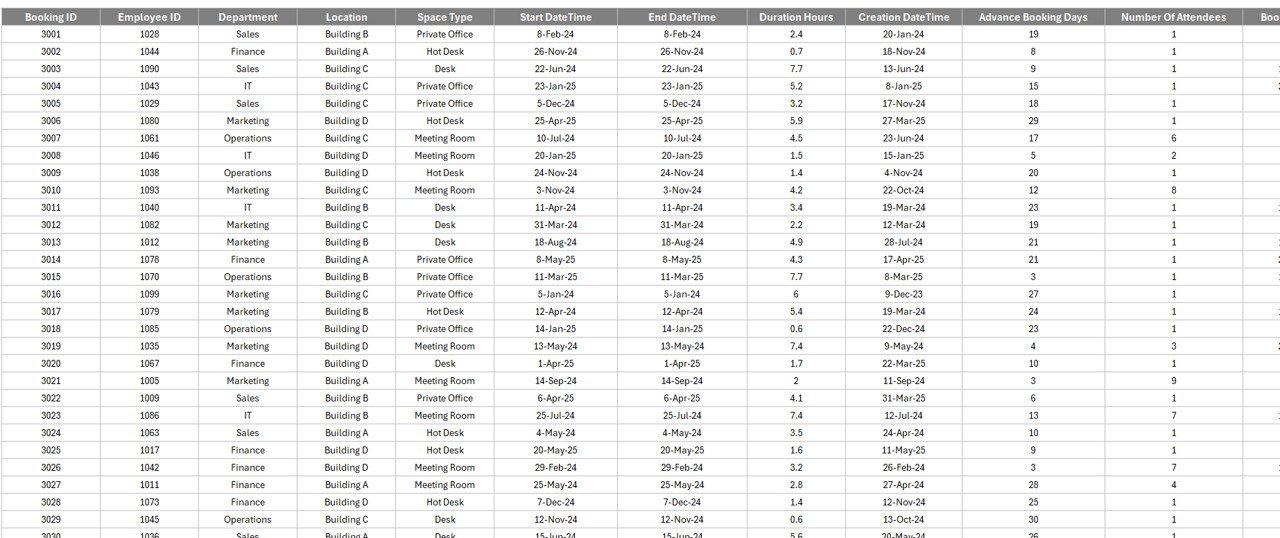
🔧 Backend Support Tabs
-
Data Sheet: Paste raw booking data (Date, Time, Duration, Space Type, Cost, etc.)
-
Support Sheet: Centralize dropdowns for Departments, Locations, and Space Types
💼 Benefits of Using This Dashboard
✅ Cost Optimization
Spot underused rooms and reduce unnecessary maintenance or leasing costs.
✅ Improved Space Planning
Make data-backed decisions on layout, cleaning cycles, and room types.
✅ Instant Insights
View trends and KPIs without building a single formula. All pivot-powered.
✅ Fully Customizable
Add or remove charts, tailor KPIs, and rebrand to suit your organization’s workflow.
✅ Easy to Deploy
No macros or add-ins. Open, paste your data, and start analyzing.
📌 Use Cases
-
Real estate and facility managers
-
HR and admin teams
-
Workplace strategists
-
Operations heads
-
Hybrid work coordinators
🔍 Best Practices
-
📅 Refresh data weekly or monthly
-
🧼 Use consistent naming via dropdowns for clean pivot outputs
-
🔒 Lock dashboard sheets and leave data sheets editable
-
📤 Export charts for stakeholder presentations or reports
-
🔄 Use Power Query for dynamic external data connections
🔄 How to Customize It
-
➕ Add KPI cards with
GETPIVOTDATA -
🧮 Create custom fields like “Cost per Attendee”
-
🌐 Localize date and currency formats
-
📊 Use combo charts to compare trends
-
📨 Integrate with Power Automate or Power BI for advanced workflows
🎓 Need Help?
🎥 Visit our YouTube channel for a full walkthrough:
👉 youtube.com/@PKAnExcelExpert


Reviews
There are no reviews yet.