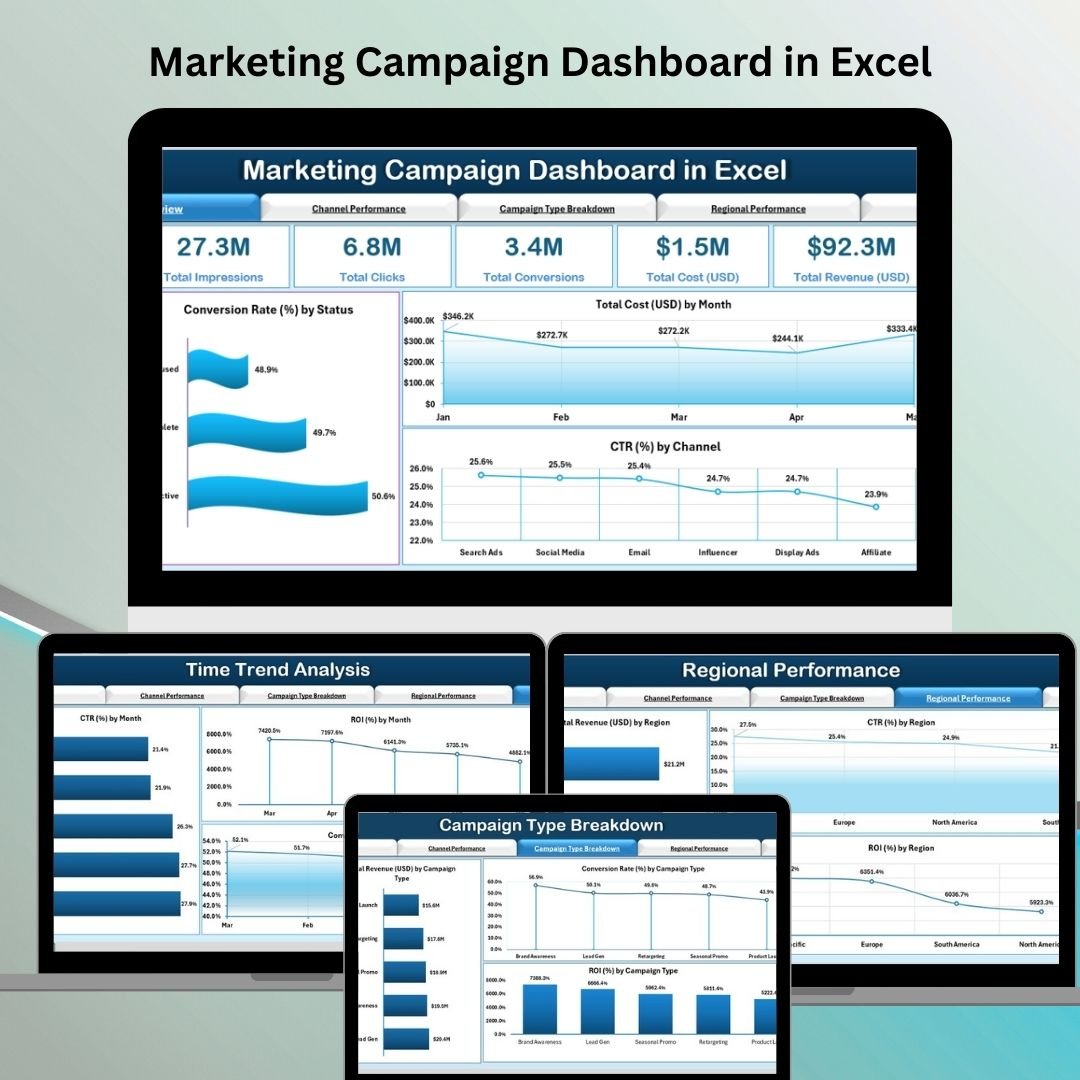
In the world of modern marketing, data isn’t just an advantage—it’s the strategy. From managing ad spend to maximizing ROI, your ability to monitor campaign performance in real-time can make or break your marketing success. That’s where the Marketing Campaign Dashboard in Excel becomes your secret weapon. 🚀
This powerful, plug-and-play Excel template brings together impressions, clicks, conversions, costs, revenue, and ROI—all in one centralized location. No more switching between platforms. No more manual reporting. Just insight, clarity, and control.
✨ Key Features of the Marketing Campaign Dashboard
🧭 Page Navigator – Jump to Insights Instantly
Navigate between detailed reports with ease:
-
🔘 Overview
-
📣 Channel Performance
-
🎯 Campaign Type Breakdown
-
🌍 Regional Performance
-
📆 Time Trend Analysis
Quick access = quicker decisions.
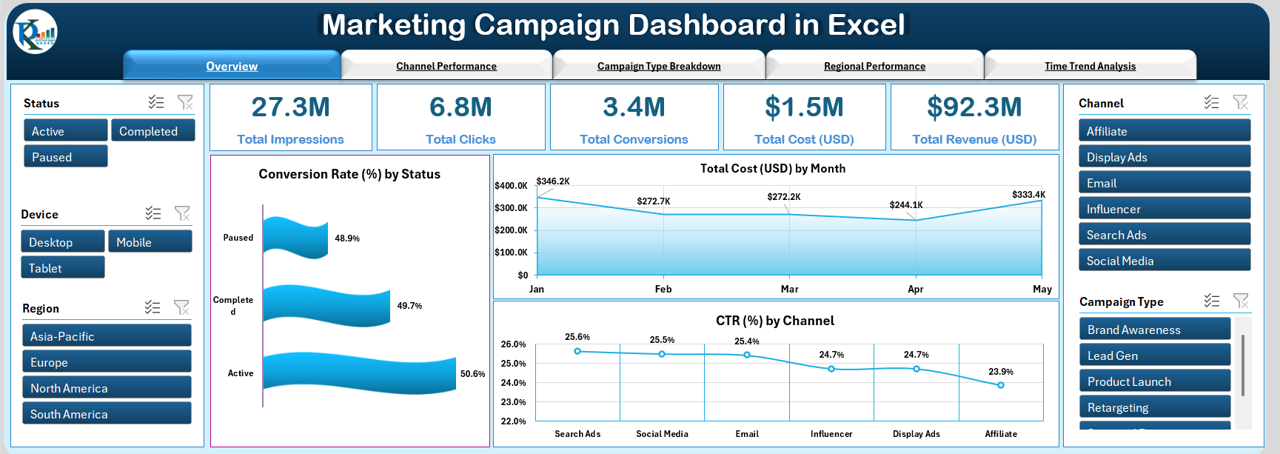
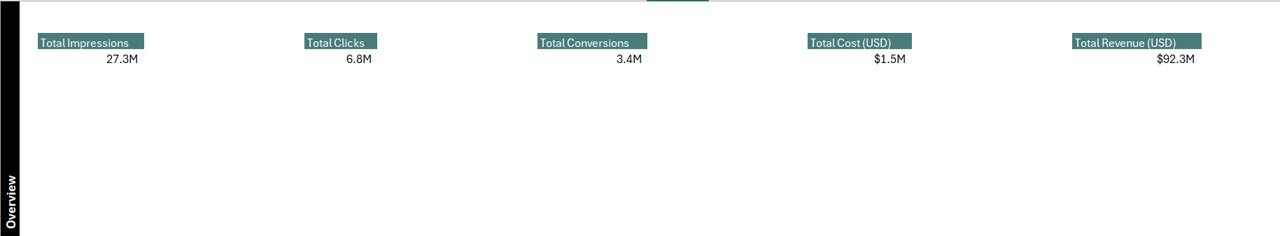
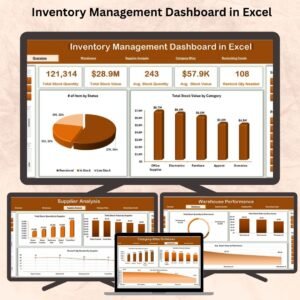
🏁 Overview Page – The Big Picture
Get a campaign-wide summary at a glance:
-
🎯 KPIs: Total Impressions, Clicks, Conversions, Cost, Revenue
-
🧮 Calculated Metrics: CTR%, Campaign Rate%, and ROI
Dynamic charts:
-
📊 Campaign Rate (%) by Status
-
💸 Total Cost by Month
-
🔗 CTR (%) by Channel
Filter everything with slicers by channel, campaign type, region, or time.
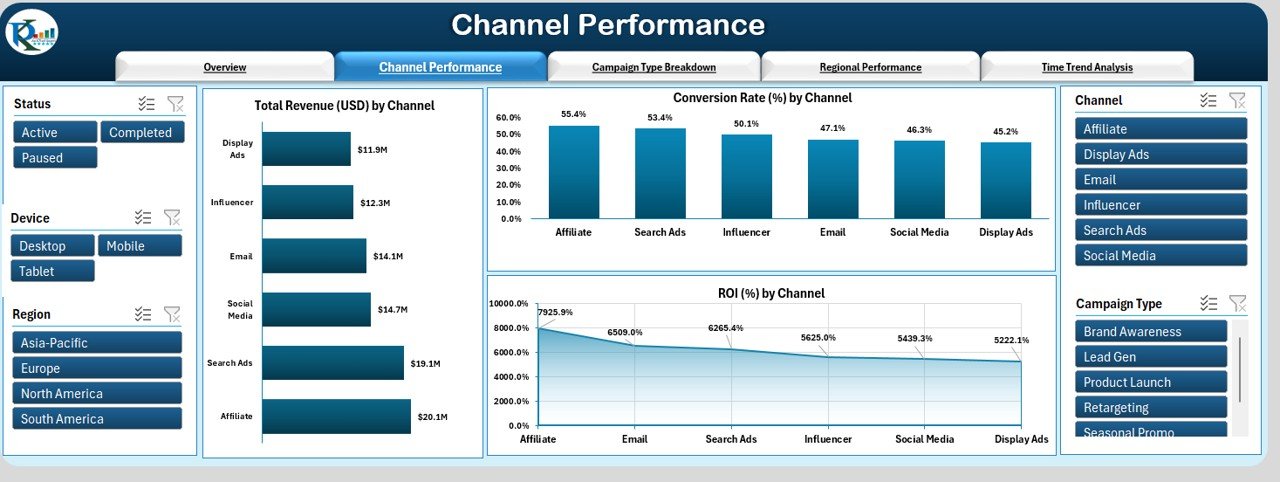
📣 Channel Performance – Drill into Channel Results
Visualize which channels deliver the best ROI:
-
Metrics: Impressions, Clicks, Conversions, Cost, Revenue
-
📈 Charts:
-
Total Revenue by Channel
-
Conversion Rate (%) by Channel
-
ROI (%) by Channel
-
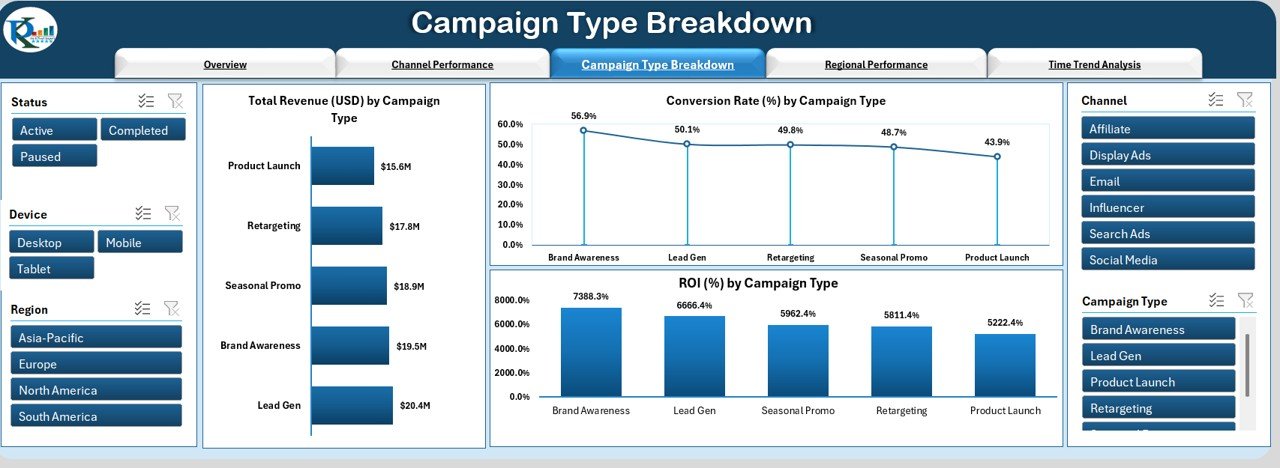
🧪 Campaign Type Breakdown – Performance by Strategy
Understand how each campaign type is performing:
-
📈 Charts:
-
Revenue by Campaign Type
-
Conversion Rate (%)
-
ROI by Campaign Type
-
Easily analyze which formats drive the best results.
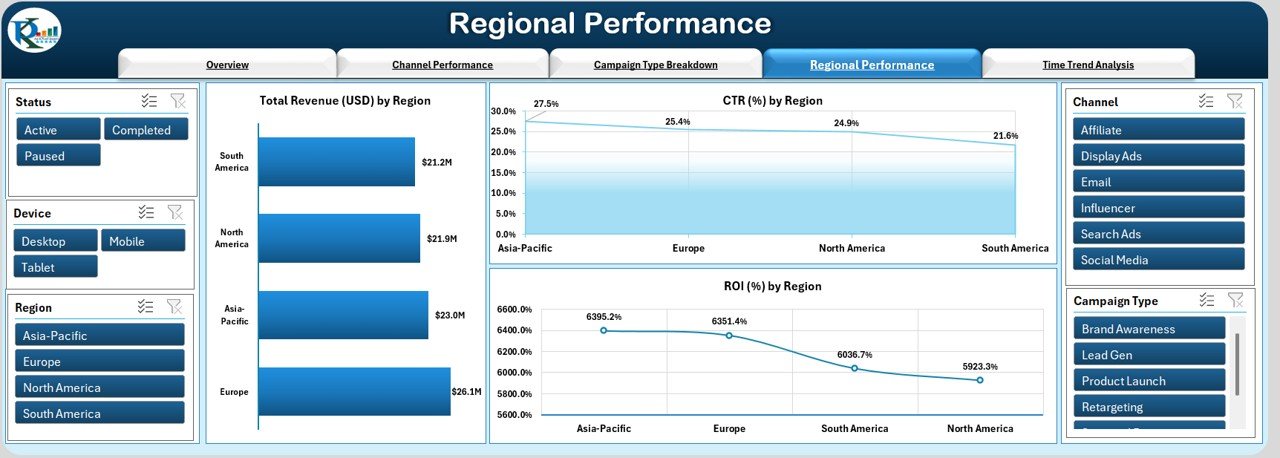
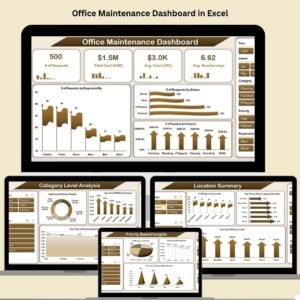
🌍 Regional Performance – Geo-Specific Insights
Explore how campaigns perform across regions:
-
📊 Revenue by Region
-
📈 CTR (%) and ROI (%) by Region
Perfect for refining geo-targeted strategies.
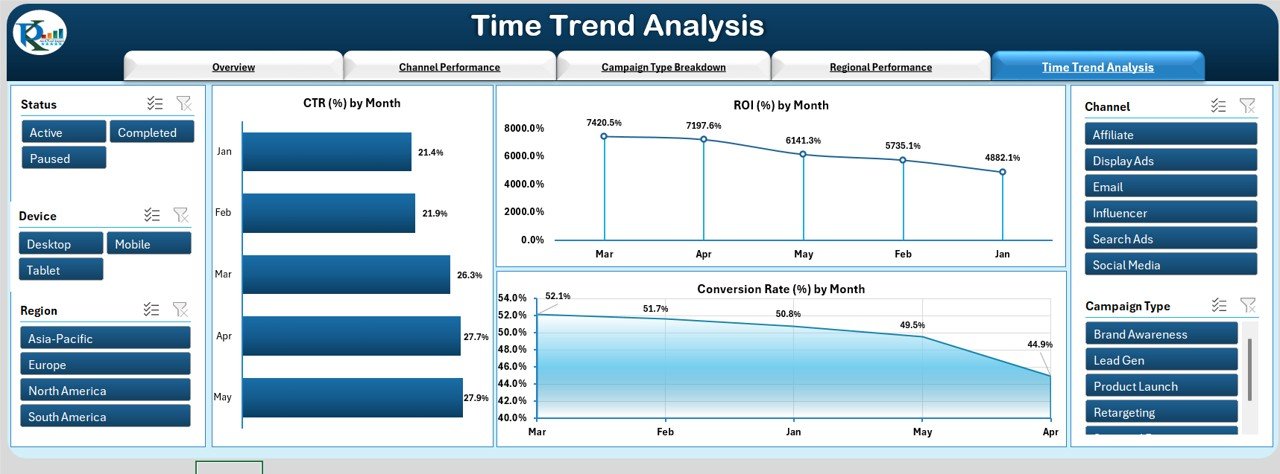
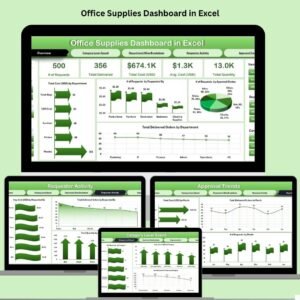
📅 Time Trend Analysis – Spot Trends Over Time
Track performance evolution with month-wise charts:
-
CTR % by Month
-
ROI % by Month
-
Conversion Rate % by Month
Identify seasonal trends and timing for optimal campaign launches.
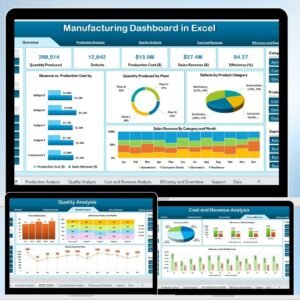
📦 What’s Inside the Excel File?
-
📊 5 Dashboard Tabs
-
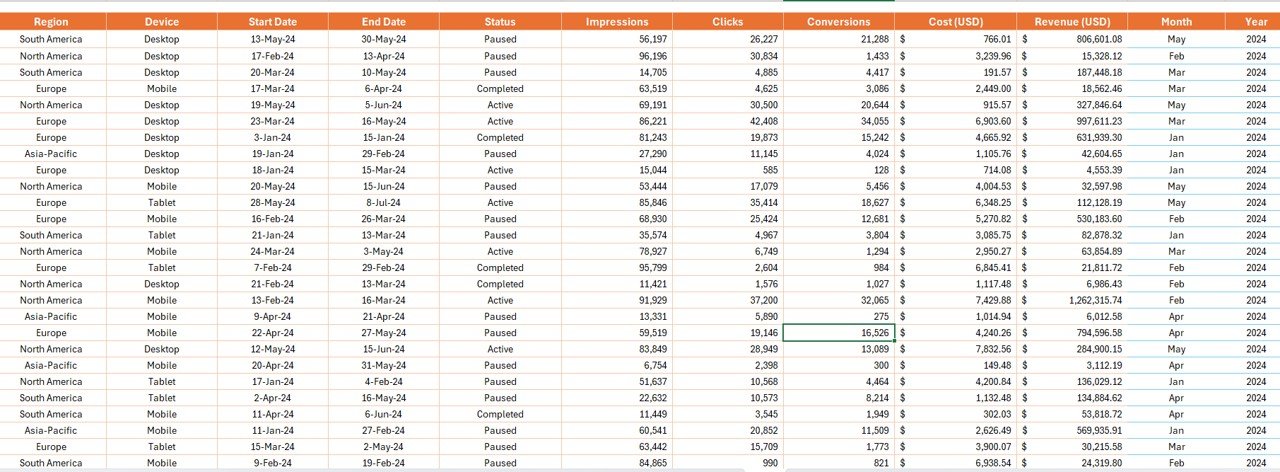
🗃 Data Sheet – Your source data input tab
-
🧰 Support Sheet – For drop-downs and slicer references
-
🧮 KPI Cards with real-time calculations
-
🔄 Dynamic Charts that update automatically with slicer use
Everything is formula-driven. No coding. Just results.
🧠 How to Use the Product
-
📥 Download the Excel file
-
📋 Paste your campaign data into the Data Sheet
-
🎯 Use slicers to filter by region, channel, or campaign type
-
📈 Review dynamic charts and KPIs across all tabs
-
✏️ Customize KPIs as needed for your team’s goals
👥 Who Can Benefit from This Dashboard?
-
📊 Marketing Analysts – Centralize campaign data and boost performance reviews
-
💼 Brand Managers – Monitor high-level ROI and conversion metrics
-
🧑💻 Agencies & Freelancers – Provide clients with beautiful, easy-to-share reports
-
🧠 Growth Teams – Optimize media buying decisions with visual data
Whether you’re running PPC, SEO, email, or social campaigns—this tool adapts to your needs.
🔗 Click here to read the Detailed blog post
📺 Visit our YouTube channel to learn step-by-step video tutorials


Reviews
There are no reviews yet.