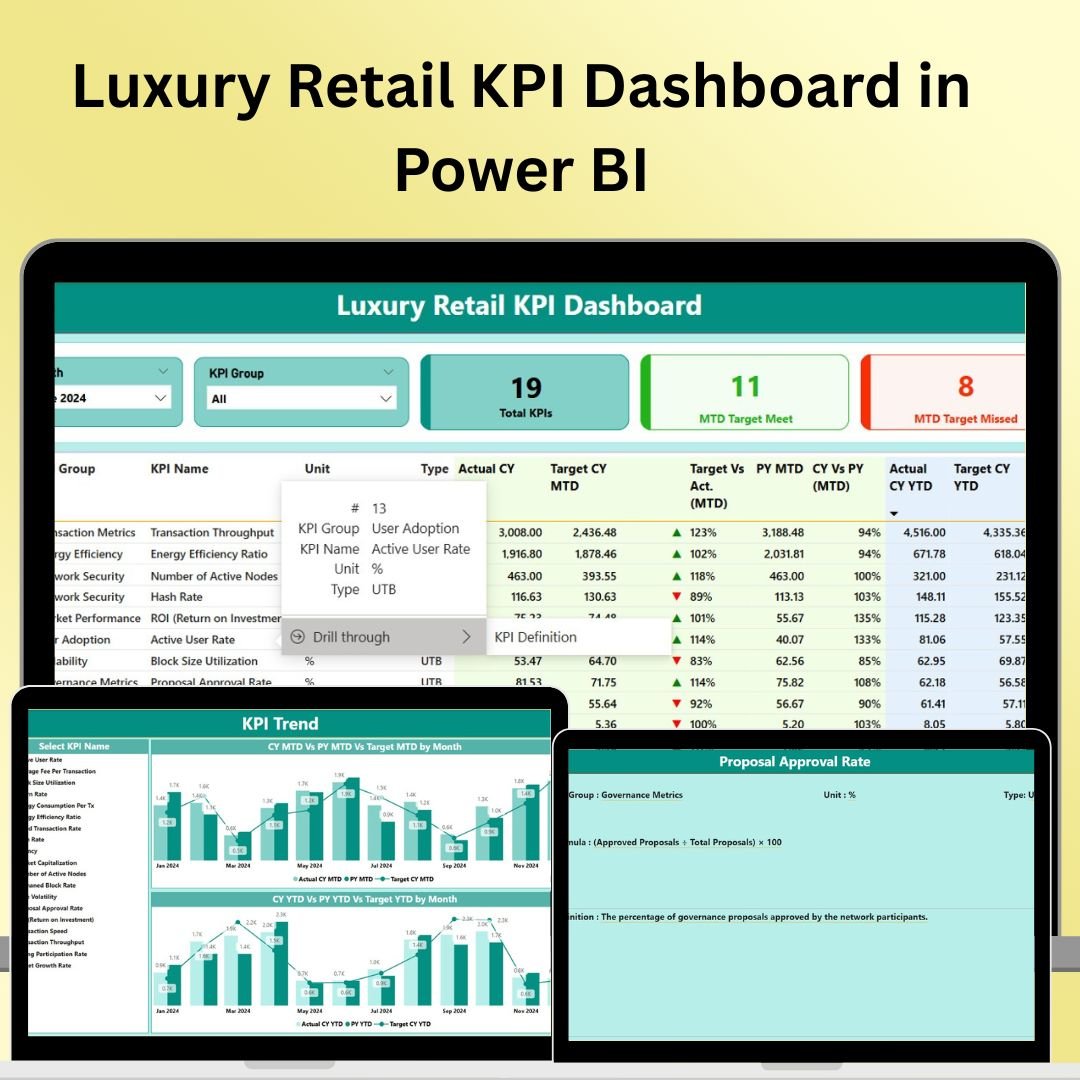


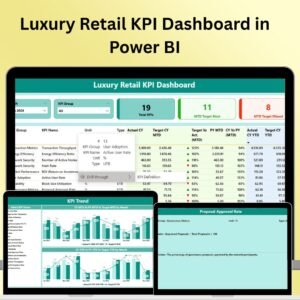
The Luxury Retail KPI Dashboard in Power BI is an advanced and highly interactive tool designed for luxury retailers to track and analyze their key performance indicators (KPIs) in real time. Whether you’re managing sales, inventory, customer behavior, or marketing performance, this Power BI dashboard offers a comprehensive view of all your vital business metrics in one place.
With powerful features such as real-time data visualization, customizable reports, and interactive filtering options, this dashboard allows retail managers and business owners to make informed, data-driven decisions. The system helps optimize operations, improve customer experience, and increase profitability while keeping track of crucial KPIs like sales trends, profit margins, stock levels, and marketing effectiveness.

Key Features of the Luxury Retail KPI Dashboard in Power BI:
📊 Comprehensive KPI Tracking
Track essential luxury retail KPIs such as sales volume, average transaction value, profit margins, customer satisfaction, inventory turnover, and marketing campaign performance—all in one interactive dashboard.
📈 Real-Time Data Visualization
Monitor your business performance with visually appealing charts and graphs that update in real-time, ensuring that you have the most up-to-date insights to make informed decisions.
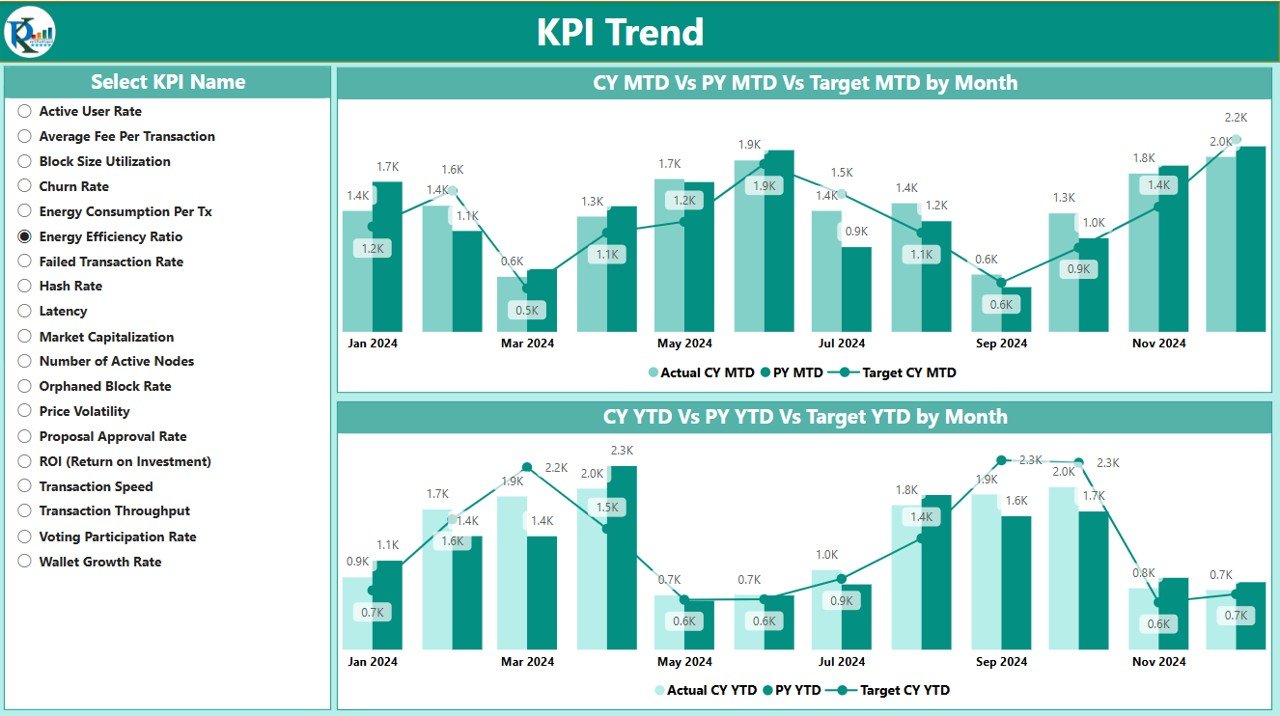
📅 Month-to-Date (MTD) and Year-to-Date (YTD) Analysis
Track and compare performance over different periods, such as month-to-date, year-to-date, or custom timeframes, to identify trends and adjust strategies accordingly.
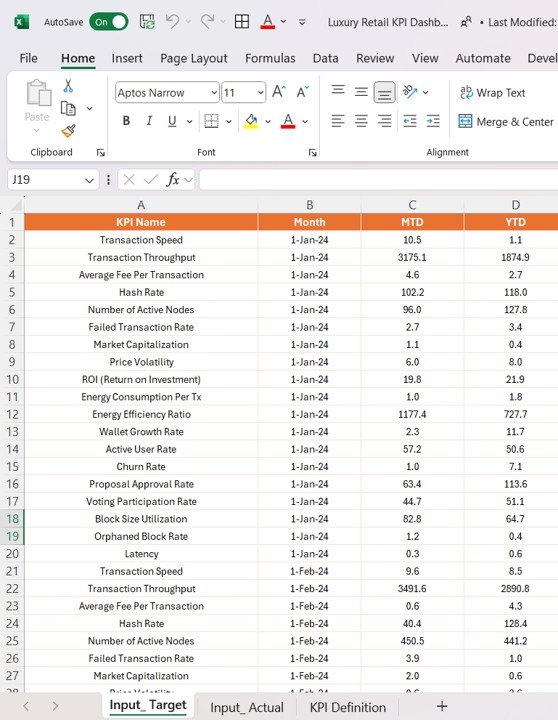
🎯 Goal Setting and Performance Comparison
Set specific targets for each KPI and compare actual performance against goals, ensuring that your retail operations are aligned with your business objectives.
🛠 Customizable Reports and Dashboards
Customize the dashboard to fit your specific luxury retail needs, allowing you to focus on the KPIs that matter most to your business.
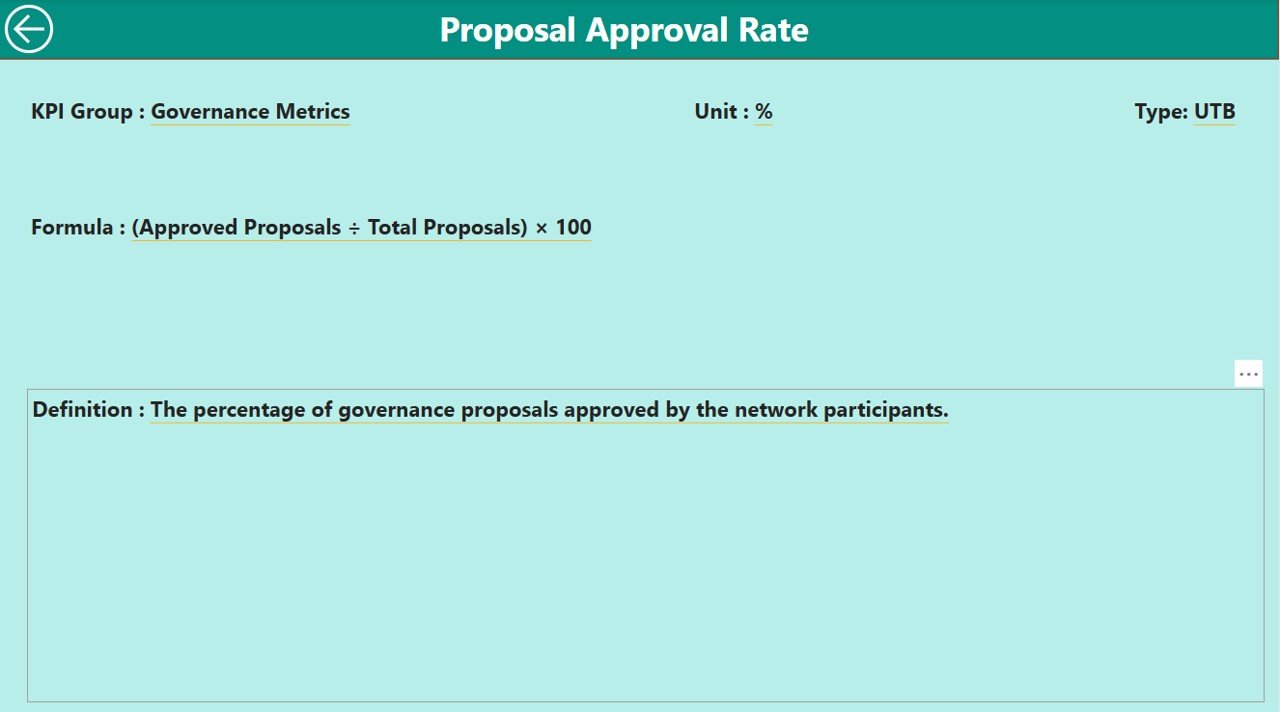
🔔 Interactive Filtering and Drill-Down
Easily filter data by region, product category, or time period to gain deeper insights into performance. Drill down into detailed data to uncover specific trends and opportunities.
💼 Advanced Sales and Marketing Insights
Analyze your sales trends, marketing campaigns, and customer behavior to optimize product offerings, promotional strategies, and inventory management.
🚀 Why You’ll Love the Luxury Retail KPI Dashboard in Power BI:
✅ Optimize Sales Performance – Track sales trends and average transaction value to understand which products are performing well and which need more attention.
✅ Increase Profitability – Measure profit margins and track inventory levels to ensure that you are optimizing revenue and minimizing stockouts or overstocking.
✅ Enhance Customer Experience – Track customer satisfaction and purchasing behavior to enhance customer service and tailor offerings based on preferences.
✅ Improve Marketing ROI – Monitor marketing campaign performance in real-time, tracking the effectiveness of ads, promotions, and offers to ensure maximum return on investment (ROI).
✅ Gain Actionable Insights – Leverage real-time data visualization and interactive filtering to uncover insights and adjust strategies swiftly.
✅ Customizable and Scalable – Tailor the dashboard to fit your business needs, whether you have multiple stores, a single boutique, or an e-commerce platform.
What’s Inside the Luxury Retail KPI Dashboard in Power BI:
- Sales Performance KPI: Track sales volume, average transaction value, and sales by product category, region, or store.
- Profit Margin KPI: Measure profit margins for individual products, categories, or overall sales, helping you identify high-margin items.
- Inventory Turnover KPI: Track stock levels and inventory turnover rates to ensure efficient inventory management and minimize stockouts or excess inventory.
- Customer Satisfaction KPI: Monitor customer feedback and satisfaction scores to improve service quality and tailor your offerings to customer needs.
- Marketing Campaign Performance KPI: Track the performance of your marketing campaigns, including online ads, email marketing, and in-store promotions.
- Store Performance KPI: Compare sales, profit margins, and customer satisfaction across multiple stores or locations to identify top performers and areas for improvement.
- Sales Forecasting KPI: Use historical data to forecast future sales trends, helping you prepare for peak seasons or slow periods.
How to Use the Luxury Retail KPI Dashboard in Power BI:
1️⃣ Download the Dashboard – Access your Power BI file instantly upon purchase.
2️⃣ Customize the Dashboard – Adjust the data sources and set up filters to match your retail operations and business needs.
3️⃣ Track Performance – Use real-time data visualizations to monitor your sales, inventory, marketing performance, and customer satisfaction.
4️⃣ Generate Reports – Use interactive filters to create detailed reports for management meetings, sales performance reviews, or marketing evaluations.
5️⃣ Make Data-Driven Decisions – Leverage actionable insights from the dashboard to optimize pricing, inventory, and marketing strategies.
Who Can Benefit from the Luxury Retail KPI Dashboard in Power BI:
- Retail Managers
- Business Owners
- Marketing Teams
- Sales Managers
- E-commerce Teams
- Inventory Managers
- Customer Service Teams
- Financial Analysts
The Luxury Retail KPI Dashboard in Power BI is the ideal solution for any luxury retailer looking to optimize sales, improve customer experience, and enhance business performance through data-driven decision-making.
Click here to read the Detailed blog post
https://www.pk-anexcelexpert.com/luxury-retail-kpi-dashboard-in-power-bi/
Visit our YouTube channel to learn step-by-step video tutorials
Youtube.com/@PKAnExcelExpert


Reviews
There are no reviews yet.