
 MTD & YTD Tracking – Analyze your logistics in real time
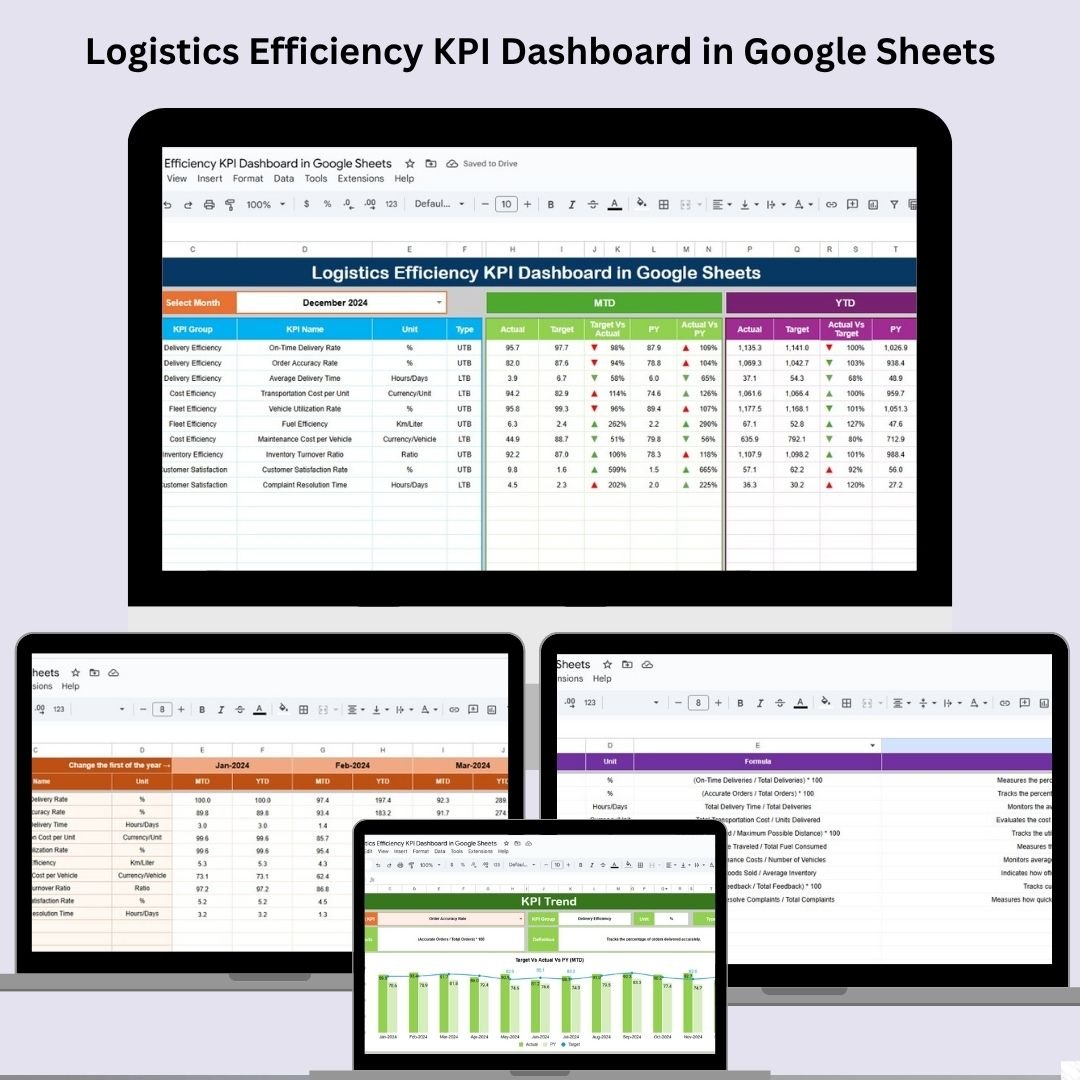
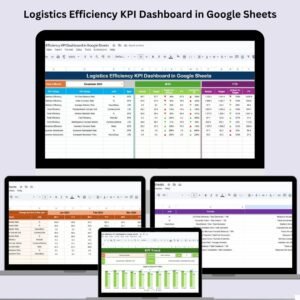
Managing logistics operations without real-time insights is like navigating without a map. That’s why we’ve created the Logistics Efficiency KPI Dashboard in Google Sheets—a smart, ready-to-use solution tailored for logistics teams and operations managers who want to monitor KPIs effortlessly and drive efficiency across every delivery, warehouse, and order fulfillment process. 

This dashboard isn’t just a spreadsheet—it’s your command center for analyzing logistics performance with clarity. With dynamic drop-downs, trend-tracking, and easy input panels, this Google Sheets tool allows you to track essential metrics like On-Time Delivery, Cost Per Delivery, Order Accuracy, and more—right from your browser.
 Key Features of the Logistics KPI Dashboard
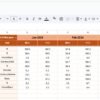
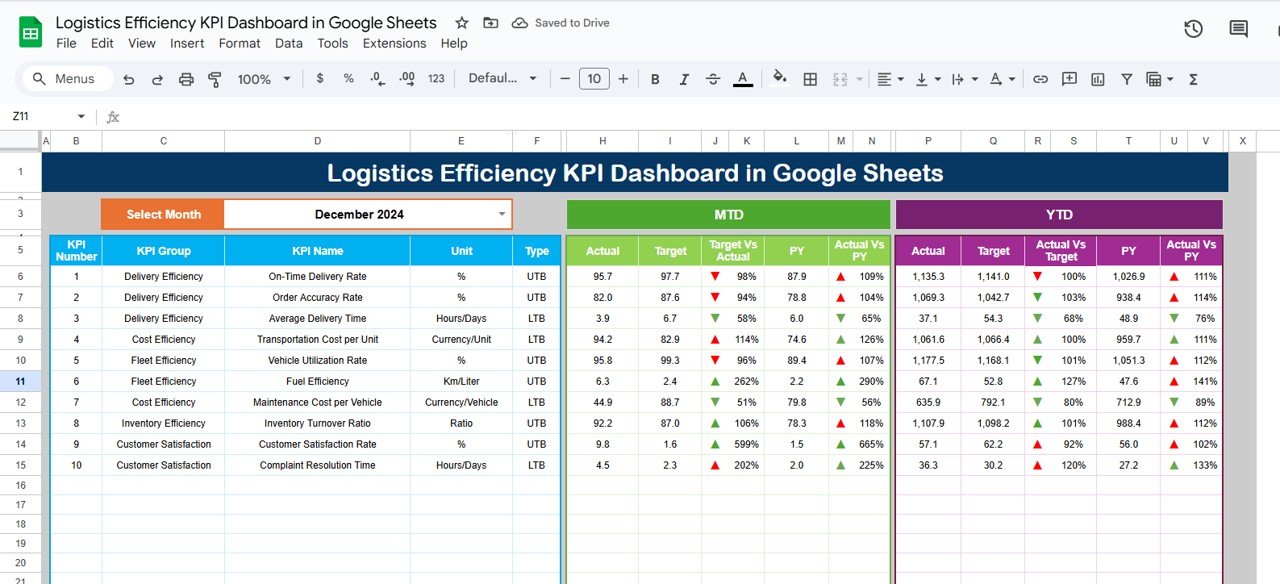
 Dashboard Sheet Tab
Your centralized performance view:
-
 MTD Actuals (Month-to-Date actual performance)
 -
 Target values for current month
 -
 Previous Year Comparison for benchmarking
 -
 Visual Indicators with up/down arrows and conditional formatting
 -
 Month selector at cell D3 for dynamic updates
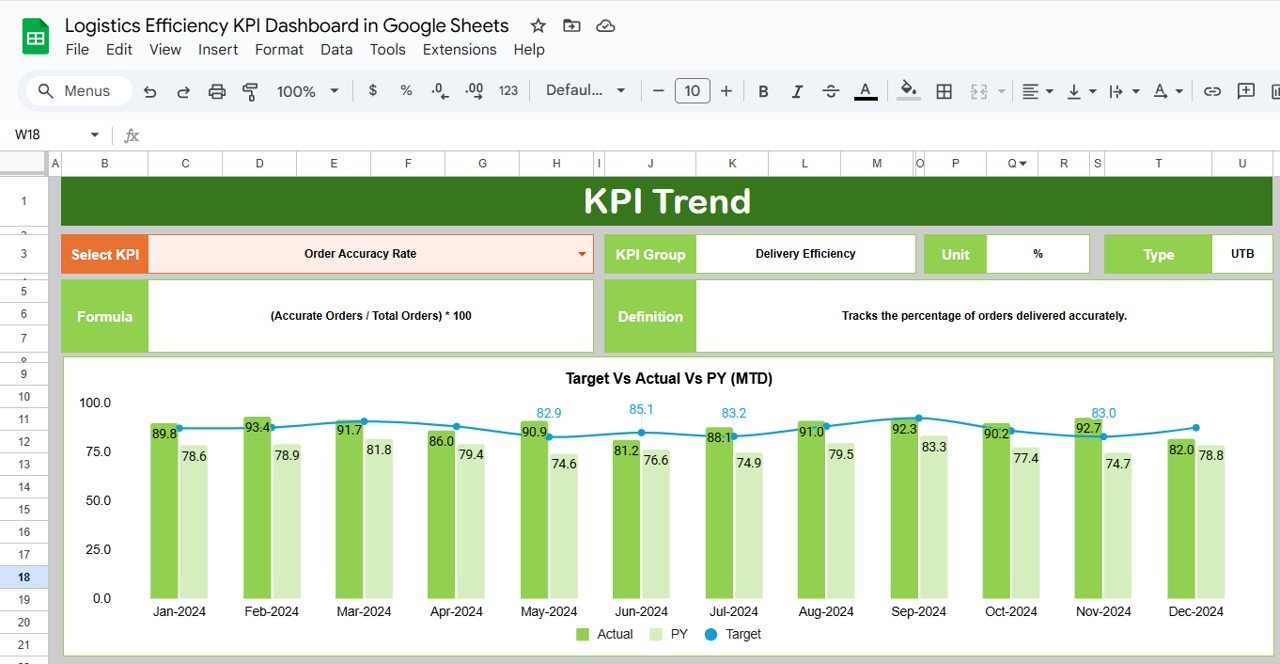
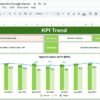
KPI Trend Sheet Tab
Zoom in on any KPI:
-
View historical trends by selecting a KPI from the drop-down in Range C3
-
Includes KPI Group, Unit, Formula, and whether it’s Lower the Better (LTB) or Upper the Better (UTB)
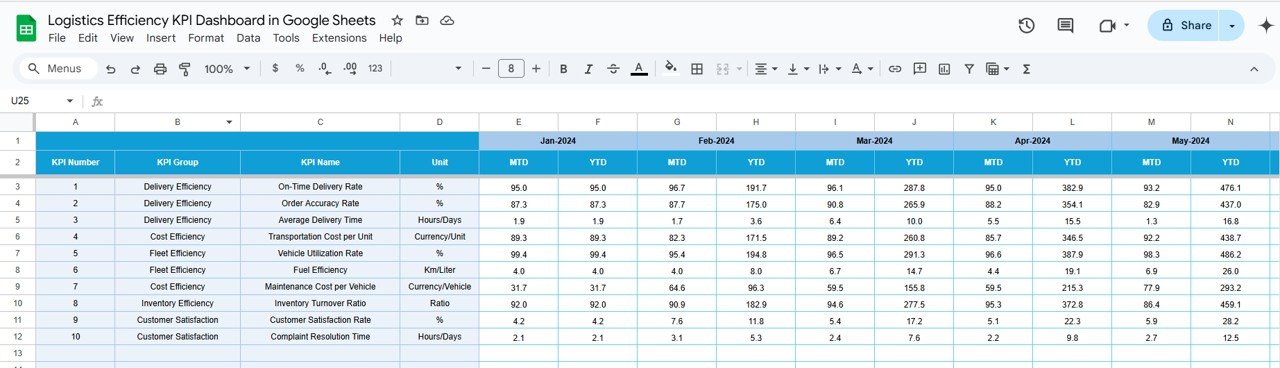
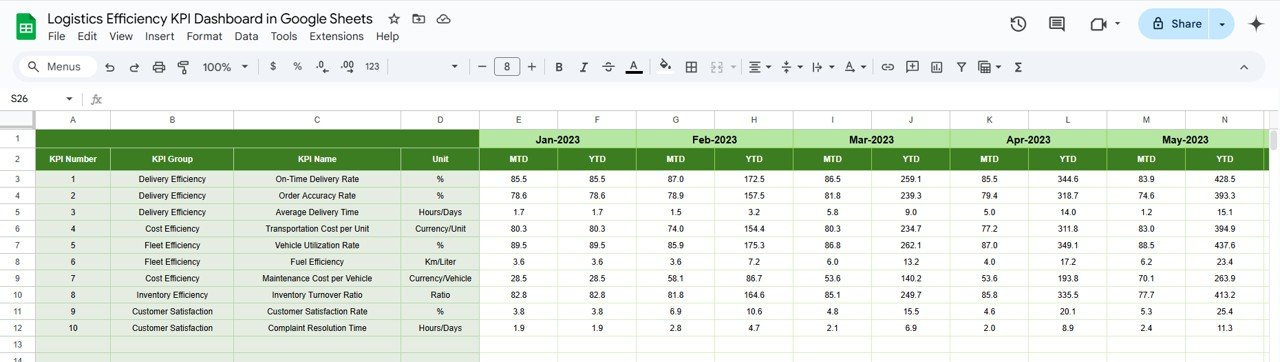
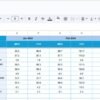
 Actual Numbers Sheet Tab
Enter your real monthly and YTD numbers with a smart month selector in cell E1—keeping the dashboard updated in real-time.
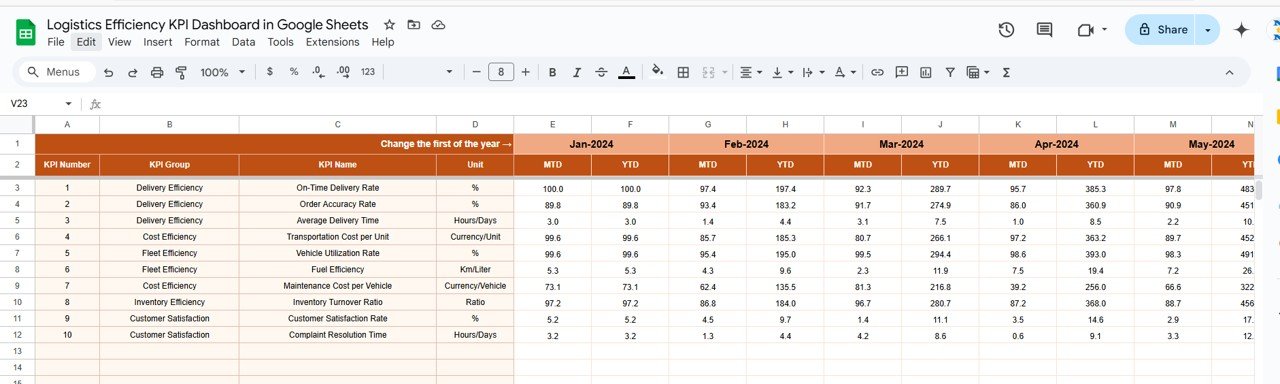
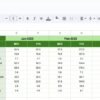
Target Sheet Tab
Input KPI targets for both MTD and YTD, enabling consistent goal-tracking and performance evaluation.
Previous Year Sheet Tab
Compare your current numbers against last year’s performance to identify progress or setbacks.
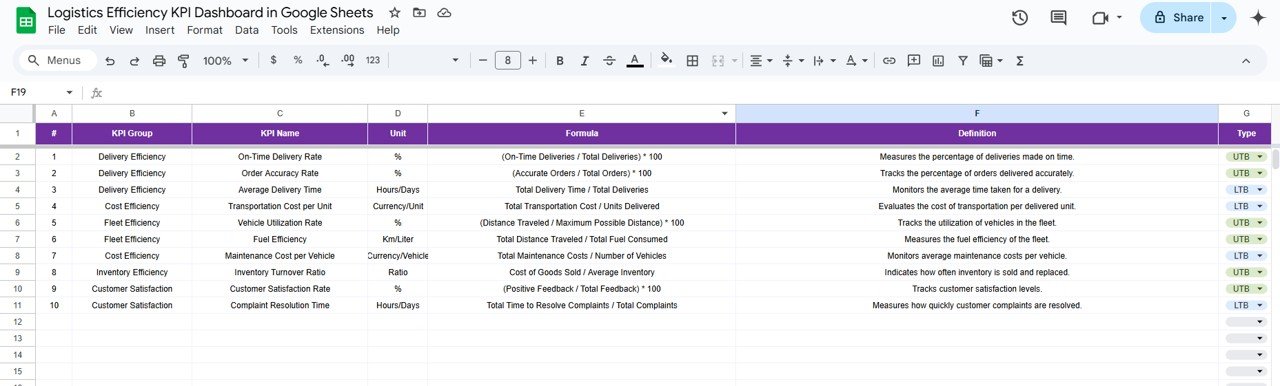
 KPI Definition Sheet Tab
Find all KPI definitions, formulas, units, and types clearly documented for your team’s understanding and alignment.
 Why This Dashboard Is a Game-Changer
Real-Time Performance Tracking – Monitor logistics metrics that matter, as data updates reflect instantly across all sheets Comprehensive View – From delivery timeliness to inventory turnover, see the full logistics picture in one place Year-over-Year Insights – Easily spot improvement areas and historical dips
 Fully Customizable – Add new KPIs or modify formulas to match your business processes
 Cloud-Based Access – Use it on any device with Google Sheets, no software required
 No Coding Needed – Simple dropdowns and clean layouts mean anyone on your team can use it
 Who Should Use This Tool?
-
Logistics Managers – Optimize delivery timelines, reduce costs, and improve resource use
-
Operations Heads – Gain oversight across shipping, warehousing, and fulfillment
-
Supply Chain Analysts – Track trends, highlight inefficiencies, and recommend improvements
-
Warehouse Supervisors – Analyze throughput and track loading/unloading accuracy
-
Startups and SMBs – Get an enterprise-grade dashboard without the enterprise price tag
 Best Practices
 Update data monthly in the Actual and Target sheets for accurate reports Review trends regularly to make proactive adjustments Customize your KPIs to match business-specific logistics goals Use visual indicators to instantly identify underperforming areas Involve your team in understanding and improving the numbers
 Click here to read the Detailed blog post
Watch the step-by-step video Demo:
 Visit our


Reviews
There are no reviews yet.