
Managing IT operations shouldn’t be complicated. The IT Dashboard Report in Excel gives you complete control over your IT performance — from incident resolution to SLA compliance — all in one powerful, easy-to-use Excel template.
This interactive dashboard is designed for IT managers, analysts, and business leaders who need quick, accurate, and data-driven insights. With real-time visuals, KPI cards, and slicers, you can instantly track tickets, measure performance, and identify improvement areas — without using any complex software.
Whether you manage 50 service tickets or 5,000, this Excel-based report helps you bring clarity, speed, and accountability to every IT operation.
⚙️ Key Features of the IT Dashboard Report in Excel
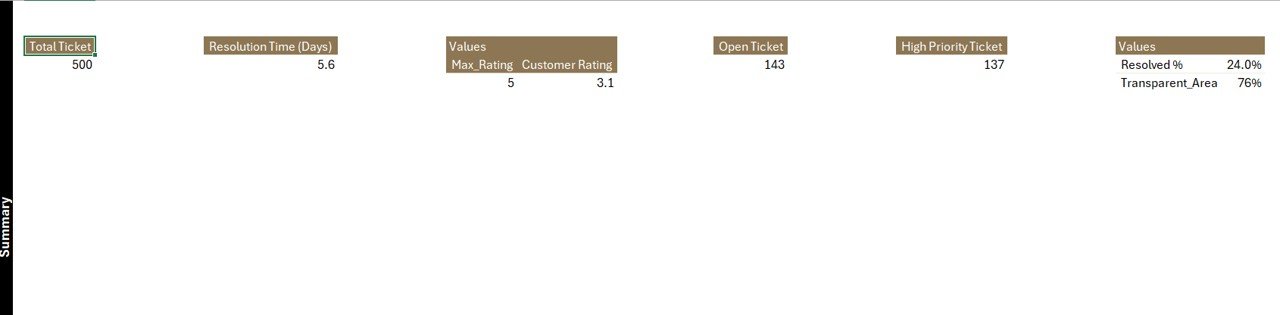
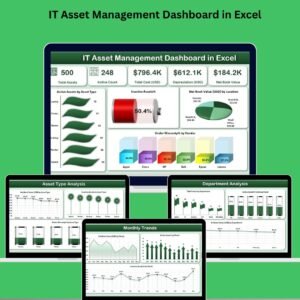
🏠 1️⃣ Summary Page – The Central Command Center
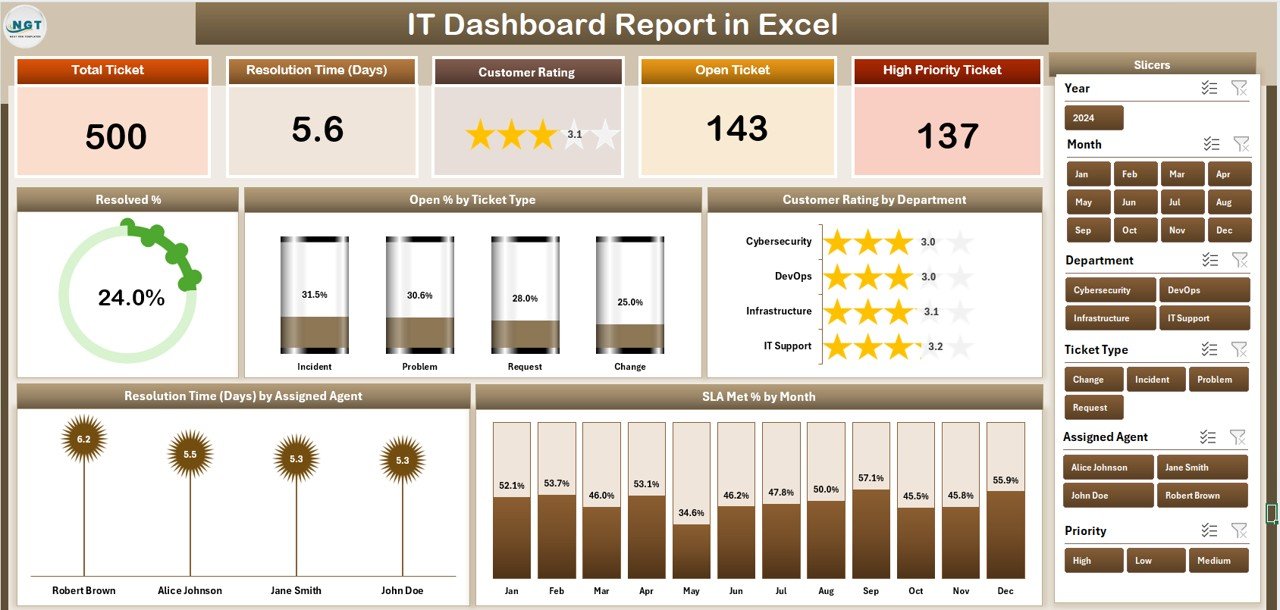
Get an instant snapshot of your IT department’s overall health.
Top Highlights:
-
🎯 Five KPI Cards showing Resolved %, Open %, Customer Rating, Avg. Resolution Time (Days), and SLA Met %.
-
📊 Interactive Charts:
-
Resolved %
-
Open % by Ticket Type
-
Customer Rating by Department
-
Resolution Time (Days) by Assigned Agent
-
SLA Met % by Month
-
-
🧭 Right-Side Slicer: Filter by Month, Department, or Agent for targeted insights.
Perfect for daily reviews, team huddles, and performance meetings.
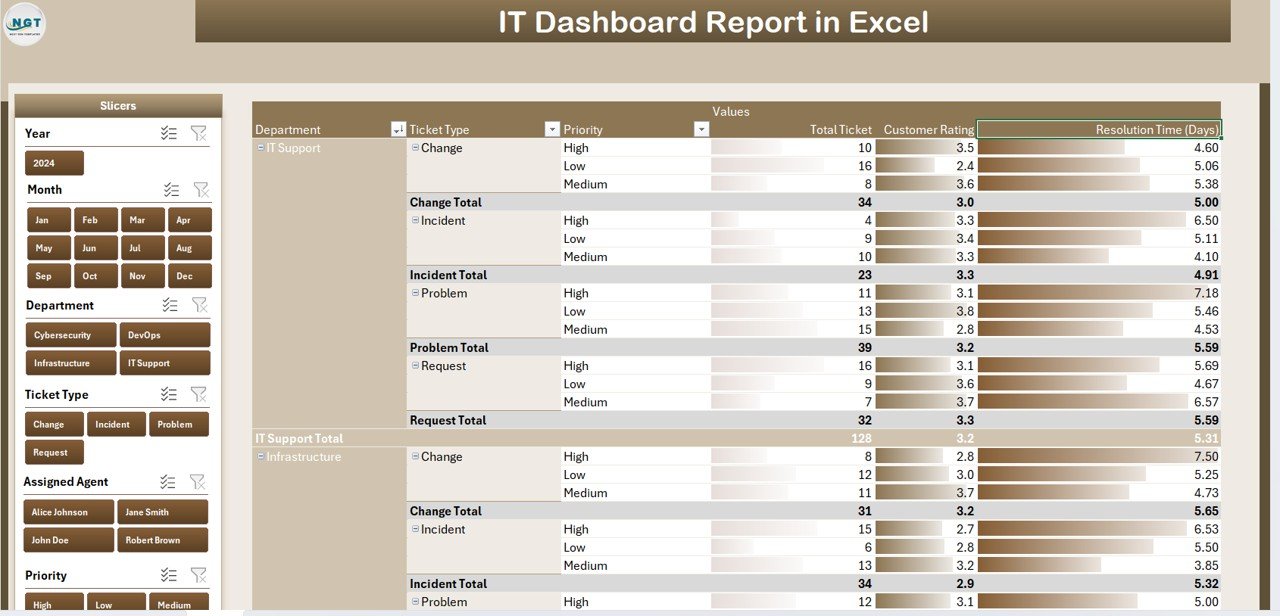
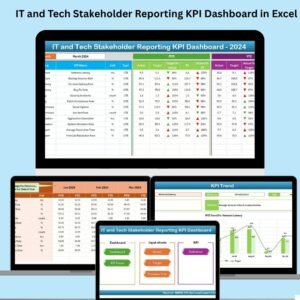
📋 2️⃣ Report Page – Deep Dive into Data
This page transforms raw ticket data into actionable insights.
Includes:
-
🧩 Left-Side Slicer for filtering by Ticket Type, Agent, Priority, or Date.
-
📑 Interactive Table with Ticket ID, Request Details, Assigned Agent, Resolution Time, and SLA Status.
Ideal for helpdesk leads or IT analysts who need a detailed operational view.
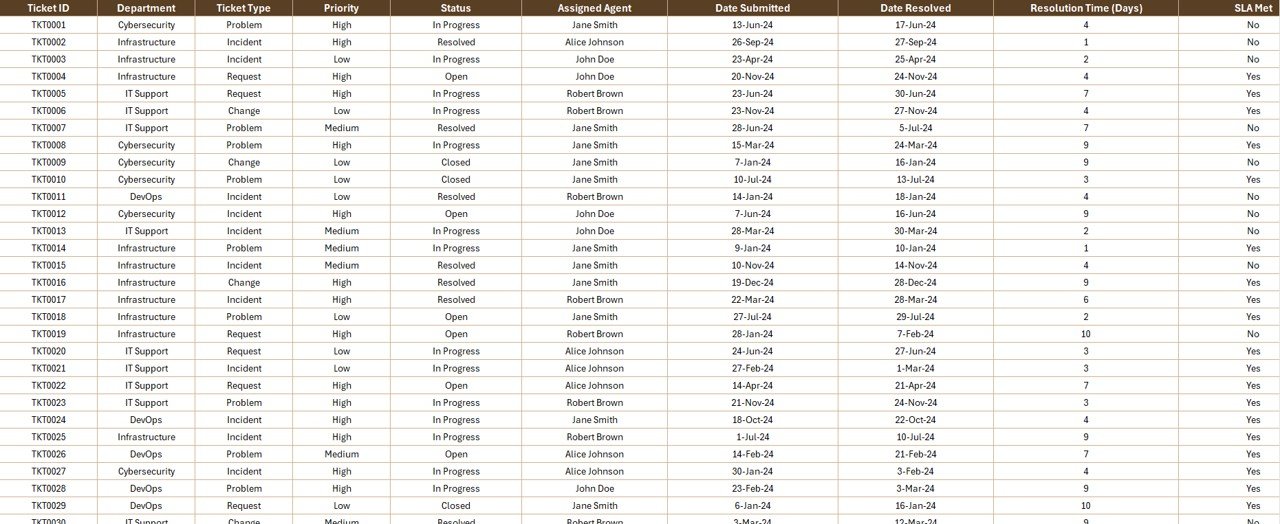
📂 3️⃣ Data Sheet – The Backbone of Your Dashboard
All raw ticket and feedback data are stored here.
Data Columns: Ticket Number, Issue Type, Department, Date Logged, Resolution Date, SLA Status, and Customer Rating.
This sheet feeds every chart and KPI — simply paste or import your data and refresh!
⚙️ 4️⃣ Support Sheet – Behind-the-Scenes Logic
Contains dropdowns, lookup lists, and formulas for consistent data entry.
Keeps your dashboard error-free, automated, and professional.
🚀 Why Use the IT Dashboard Report in Excel?
✅ Centralized IT Performance Tracking: Manage all tickets, SLAs, and feedback in one place.
✅ Real-Time Analytics: Visual charts and cards update instantly as you refresh your data.
✅ Actionable Insights: Quickly identify trends such as low SLA compliance or slow response time.
✅ Fully Customizable: Add new KPIs, change departments, or modify visuals easily.
✅ Cost-Effective: No extra software — everything runs in Excel.
✅ Scalable: Perfect for small IT teams or large enterprises.
🧭 Who Can Benefit from This Dashboard?
-
🧑💼 IT Managers & Directors – Oversee departmental performance and SLA goals.
-
🧰 Service Desk Teams – Monitor workload, response, and resolution rates.
-
📊 IT Analysts & Support Engineers – Drill into incidents and performance metrics.
-
💼 CIOs & Executives – Review high-level KPIs and identify budget priorities.
-
🌐 Managed Service Providers (MSPs) – Track multiple client SLAs in one file.
🧩 Advantages of Using Excel for IT Reporting
-
💻 Universal Access: Excel is familiar, flexible, and used everywhere.
-
⚙️ No Coding Required: Uses pivot tables and formulas, not macros.
-
🔄 Automatic Updates: Charts refresh instantly after data import.
-
🧮 Custom Formulas: Tailor metrics for your unique KPIs.
-
💡 Integration Ready: Works with Outlook, SharePoint, or Access.
🏁 Best Practices for Maximum Impact
1️⃣ Maintain data consistency (agent names, ticket types).
2️⃣ Refresh pivot tables after every update.
3️⃣ Use conditional formatting to highlight trends.
4️⃣ Focus on critical KPIs — SLA Met %, Resolution Time, Customer Rating.
5️⃣ Protect sheets with formulas.
6️⃣ Automate data import via Power Query.
7️⃣ Backup your report weekly for historical tracking.
💡 Combine consistency with automation for accurate, actionable analytics every time.
🔗 Click here to read the Detailed Blog Post
📺 Visit our YouTube Channel for Step-by-Step Tutorials
👉 YouTube.com/@PKAnExcelExpert


Reviews
There are no reviews yet.