Managing IT assets efficiently is crucial for any organization aiming to reduce costs, prevent losses, and maximize operational efficiency. The IT Asset Management Dashboard in Google Sheets is a ready-to-use, automated solution that provides complete visibility into your company’s hardware, software, and networking equipment — all from a single, easy-to-navigate dashboard.
This smart template helps IT managers, procurement teams, and finance departments track the lifecycle, cost, depreciation, and utilization of every asset — ensuring transparency, accountability, and smarter resource allocation.
💻 What Is an IT Asset Management Dashboard in Google Sheets?
An IT Asset Management Dashboard is a centralized performance and financial tracking tool that visualizes your organization’s IT inventory — from purchase to depreciation and disposal.
Built entirely in Google Sheets, it combines automation, interactivity, and collaboration to simplify IT asset monitoring. You can easily track total cost, active count, net book value (NBV), depreciation trends, and warranty coverage — all without complex software or IT tools.
It’s a complete asset control system that brings together data accuracy, financial clarity, and visual insights.
📊 Dashboard Structure Overview
This dashboard is divided into multiple interconnected sheets — each serving a unique analytical purpose for a 360° view of asset health and performance.
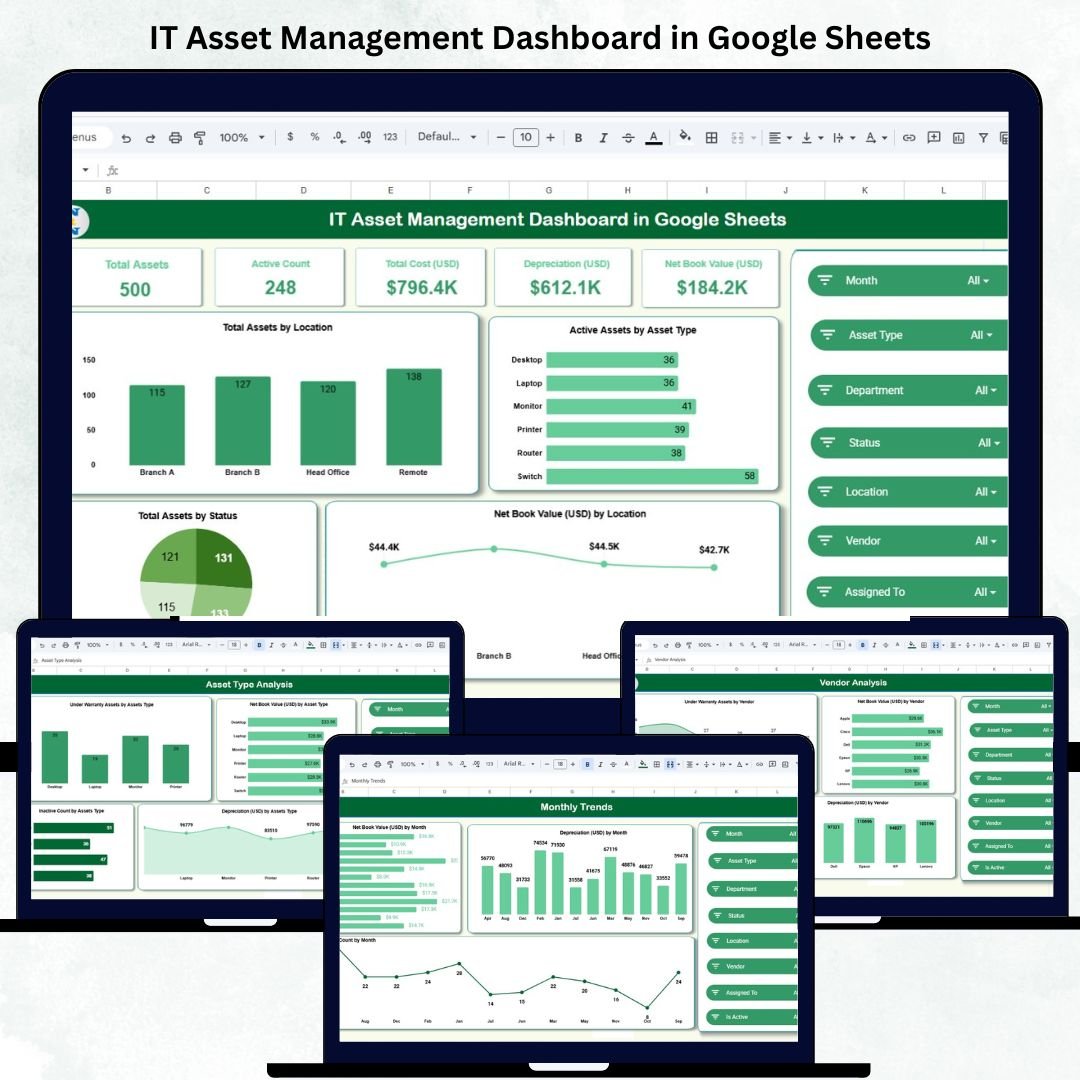
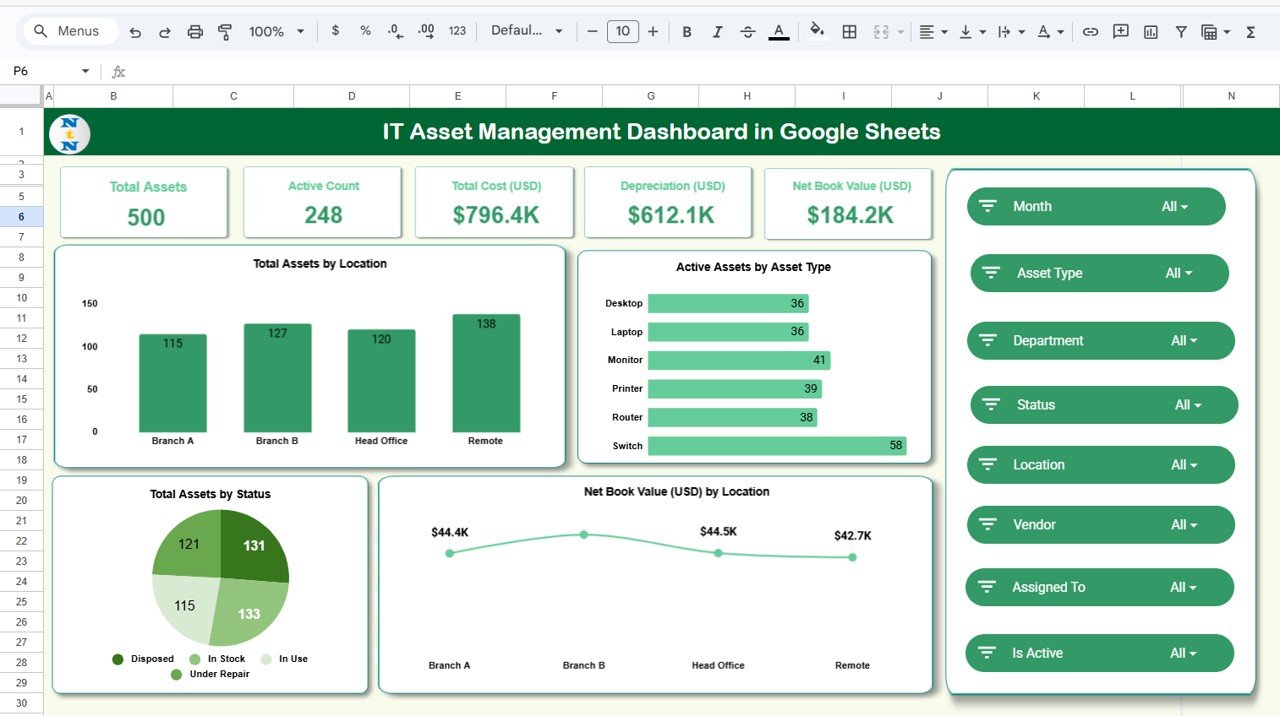
1️⃣ Overview Sheet Tab
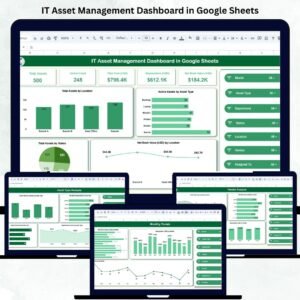
The Overview Sheet is the main dashboard page summarizing key asset information through KPI cards and charts.
KPI Cards Include:
-
💻 Total Assets: Total number of assets in the organization.
-
⚙️ Active Count: Assets currently in use.
-
💰 Total Cost (USD): Cumulative purchase cost of all IT assets.
-
📉 Depreciation (USD): Total depreciation value of assets.
-
🧾 Net Book Value (USD): Current asset valuation after depreciation.
Charts in the Overview:
📦 Active Assets by Asset Type – Visual distribution of laptops, desktops, servers, and other devices.
📍 Total Assets by Location – Displays location-wise allocation of assets.
💵 Net Book Value by Location – Shows how asset value is distributed across offices.
📊 Total Assets by Status – Differentiates Active, Under Repair, and Disposed assets.
This section gives IT and finance teams a complete performance snapshot at a glance.
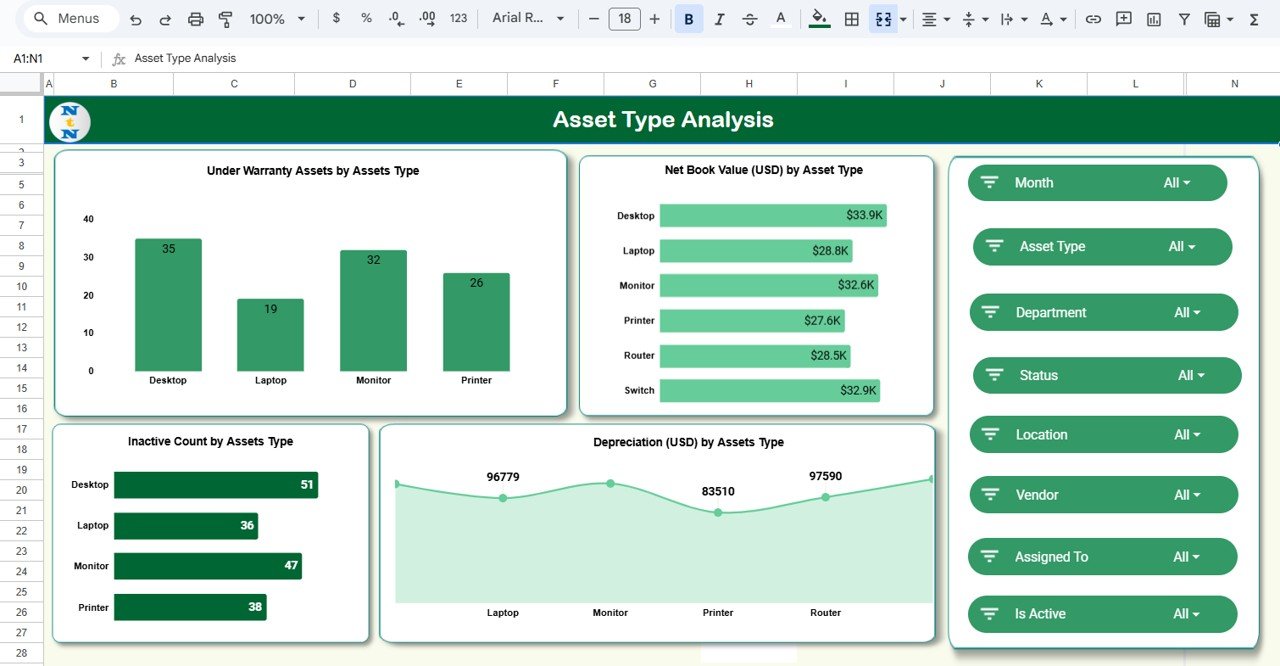
2️⃣ Asset Type Analysis Sheet
Analyze your assets by category or type to optimize procurement and lifecycle management.
Charts Include:
-
Under Warranty Assets by Type
-
Net Book Value (USD) by Type
-
Depreciation by Type
-
Inactive Count by Type
This tab helps identify high-depreciation assets, monitor replacement cycles, and detect underused categories.
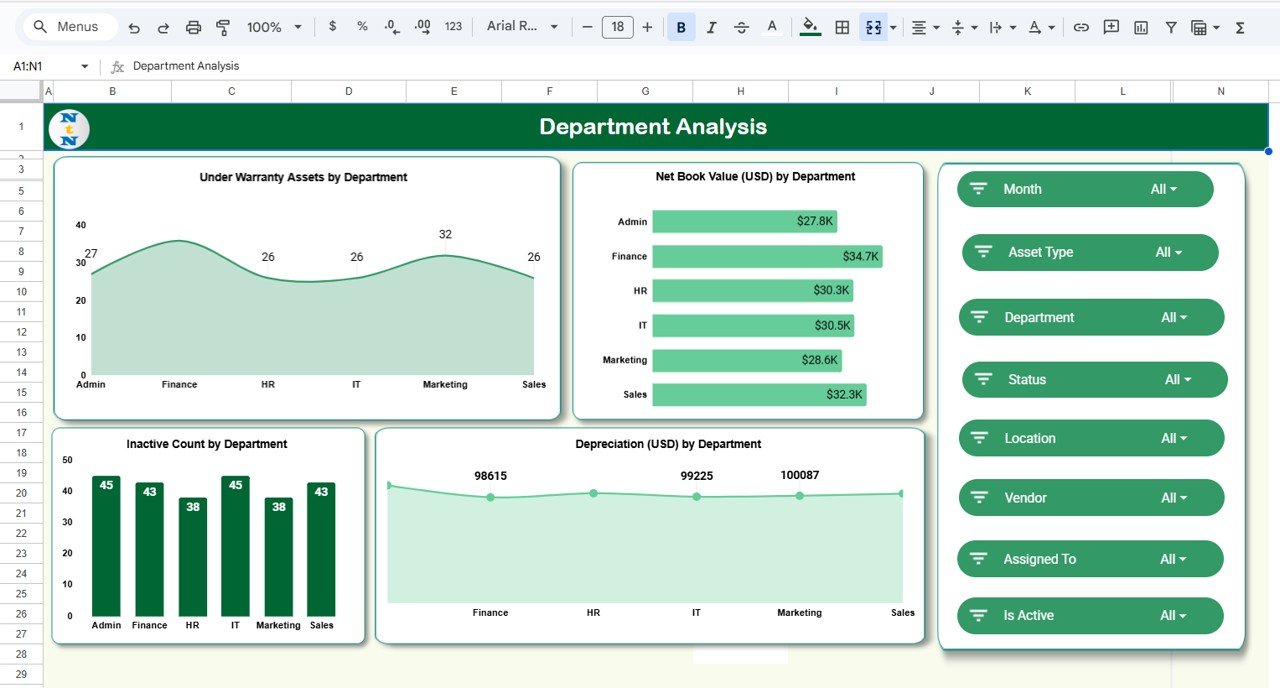
3️⃣ Department Analysis Sheet
Track which departments own or use which assets.
Charts Include:
-
Under Warranty Assets by Department
-
Net Book Value by Department
-
Depreciation by Department
-
Inactive Count by Department
This insight helps improve asset accountability and ensures efficient departmental budgeting.
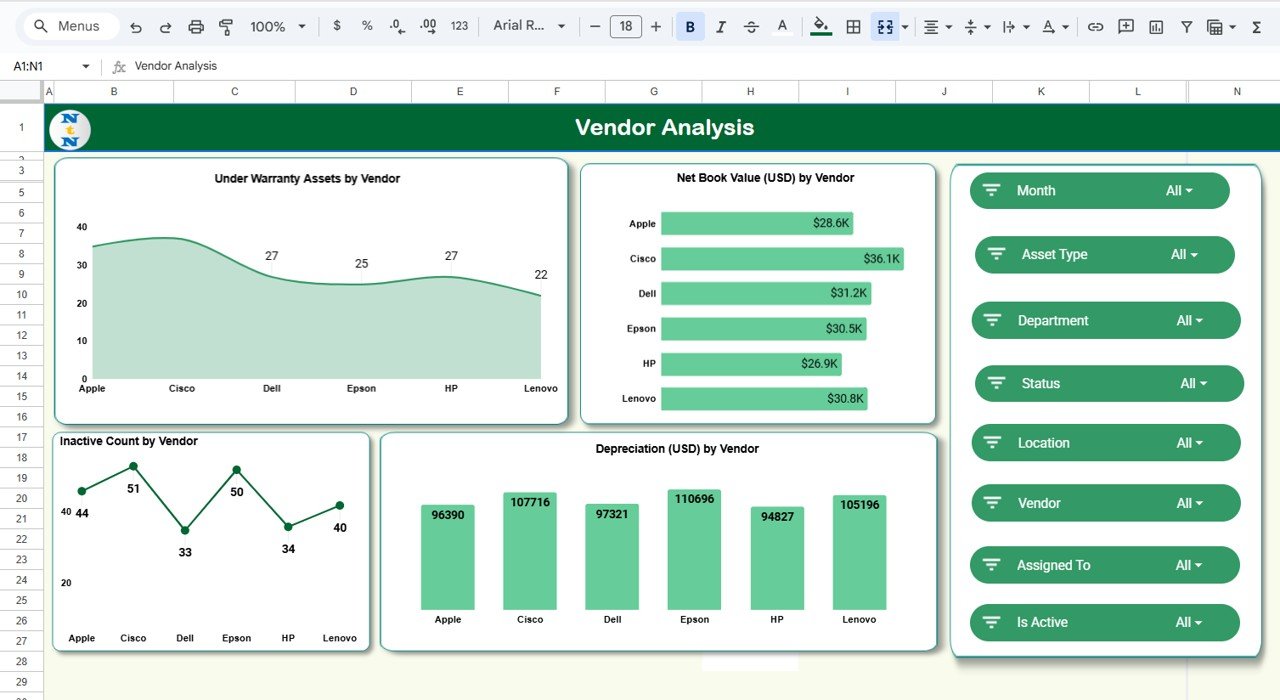
4️⃣ Vendor Analysis Sheet
Evaluate vendor performance and warranty coverage efficiently.
Charts Include:
-
Under Warranty Assets by Vendor
-
Net Book Value by Vendor
-
Depreciation by Vendor
-
Inactive Count by Vendor
This view helps assess vendor reliability and supports procurement negotiations.
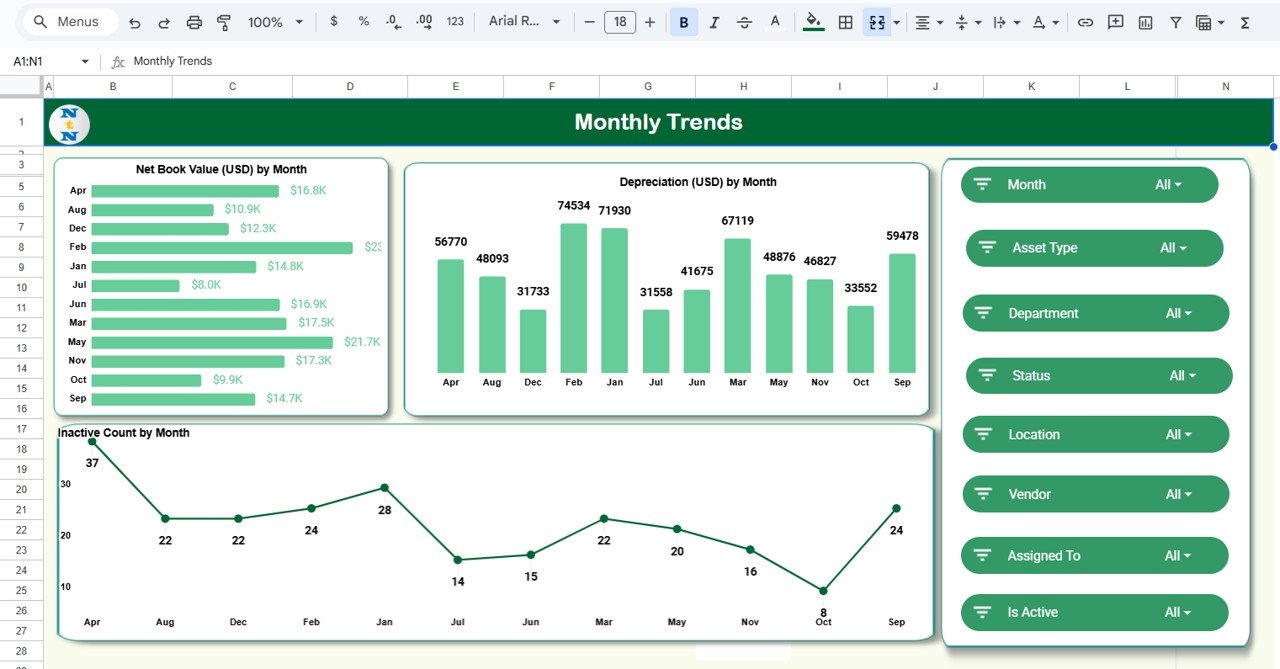
5️⃣ Monthly Trends Sheet
Visualize asset performance over time to plan replacements and budget forecasts.
Charts Include:
📈 Net Book Value (USD) by Month
📉 Depreciation (USD) by Month
🖥️ Inactive Count by Month
These trends help predict when assets will reach end-of-life and when new investments are needed.
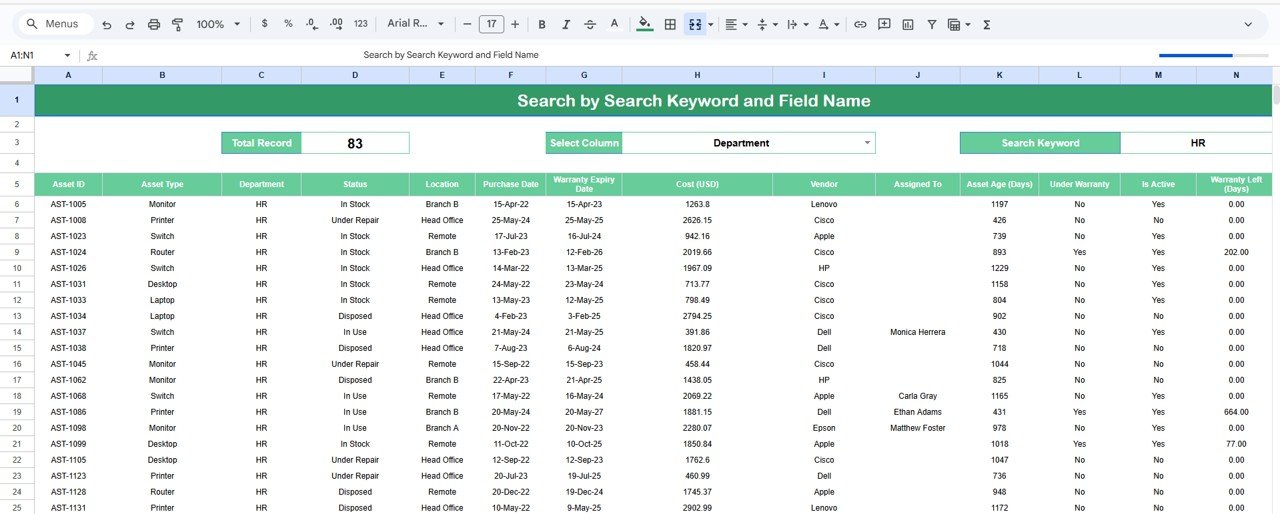
6️⃣ Search Tab
The Search Sheet allows keyword-based lookups for quick asset retrieval.
🔍 Examples:
-
Search “Laptop” → view all laptop records.
-
Search “Vendor ABC” → list all assets purchased from that vendor.
-
Search “Warranty” → find items under warranty.
Perfect for organizations managing hundreds of assets across multiple sites.
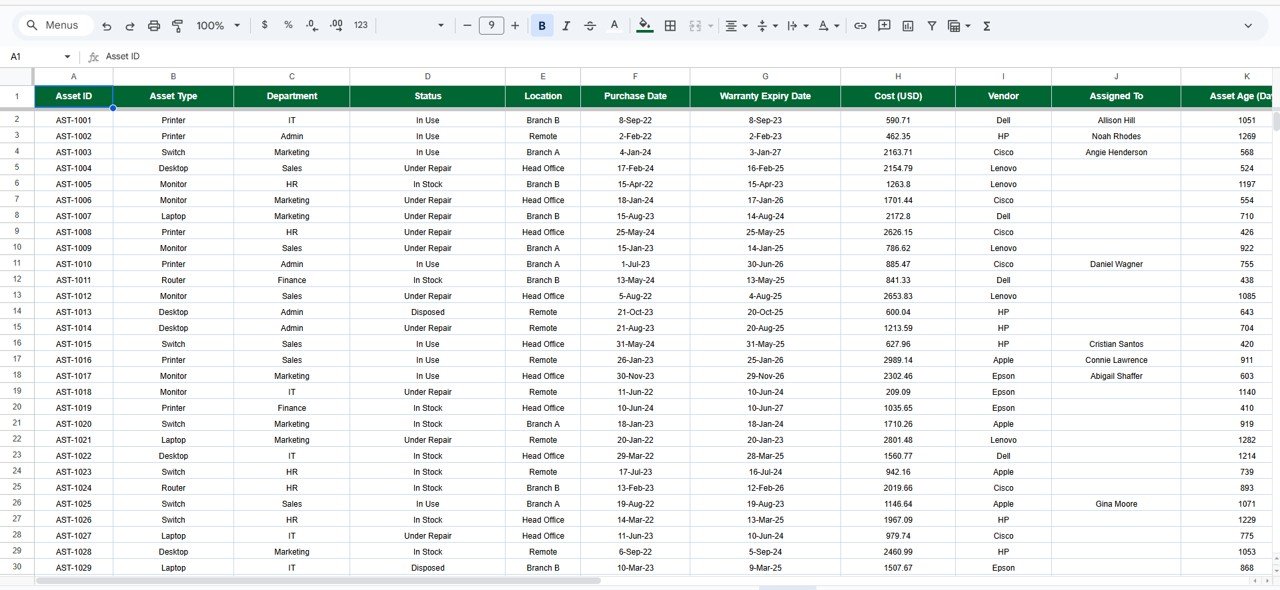
7️⃣ Data Sheet Tab
The Data Sheet is the foundation of the entire dashboard.
Typical Columns Include:
Asset ID | Asset Type | Department | Vendor | Purchase Date | Purchase Cost (USD) | Depreciation (USD) | Net Book Value (USD) | Warranty Expiry | Status | Location
All charts and KPIs update automatically when data is added or edited.
🌟 Advantages of the IT Asset Management Dashboard
-
📊 Centralized Tracking: Manage all asset details in one location.
-
⏱️ Real-Time Updates: Data-driven charts refresh automatically.
-
💵 Cost Transparency: Understand asset value and financial impact instantly.
-
🧩 Department-Level Accountability: View usage patterns and inefficiencies.
-
🤝 Vendor Performance Insight: Evaluate reliability and service quality.
-
🧮 Accurate Depreciation Tracking: Visualize financial depreciation month-over-month.
-
☁️ 100% Google Sheets-Based: No external software required.
🚀 Opportunities for Improvement
You can enhance the dashboard’s capabilities further by:
-
📧 Automated Alerts: Notify teams before warranty or AMC expiry.
-
🧾 Form Integration: Use Google Forms for easy asset entry.
-
🧭 Geo-Mapping: Show office-wise distribution visually.
-
🔗 Barcode Scanning: Add barcodes/QR codes for instant asset lookup.
-
📈 Predictive Analysis: Model depreciation trends for better capital planning.
💡 Best Practices for Using the Dashboard
✅ Update the data sheet monthly with new purchases or disposals.
✅ Verify depreciation and NBV formulas for accuracy.
✅ Maintain consistent asset naming conventions.
✅ Archive old data to improve performance.
✅ Restrict formula cells from editing to preserve calculations.
✅ Review monthly trend charts for capital budgeting.
✅ Conclusion
The IT Asset Management Dashboard in Google Sheets is the ultimate solution for managing and visualizing your organization’s IT inventory. It helps you monitor costs, track depreciation, identify inactive assets, and ensure efficient utilization — all within an accessible, automated platform.
From procurement to retirement, every asset can now be tracked, analyzed, and optimized with clarity. If you want complete visibility and control over your IT infrastructure, this dashboard is your perfect digital companion.


Reviews
There are no reviews yet.