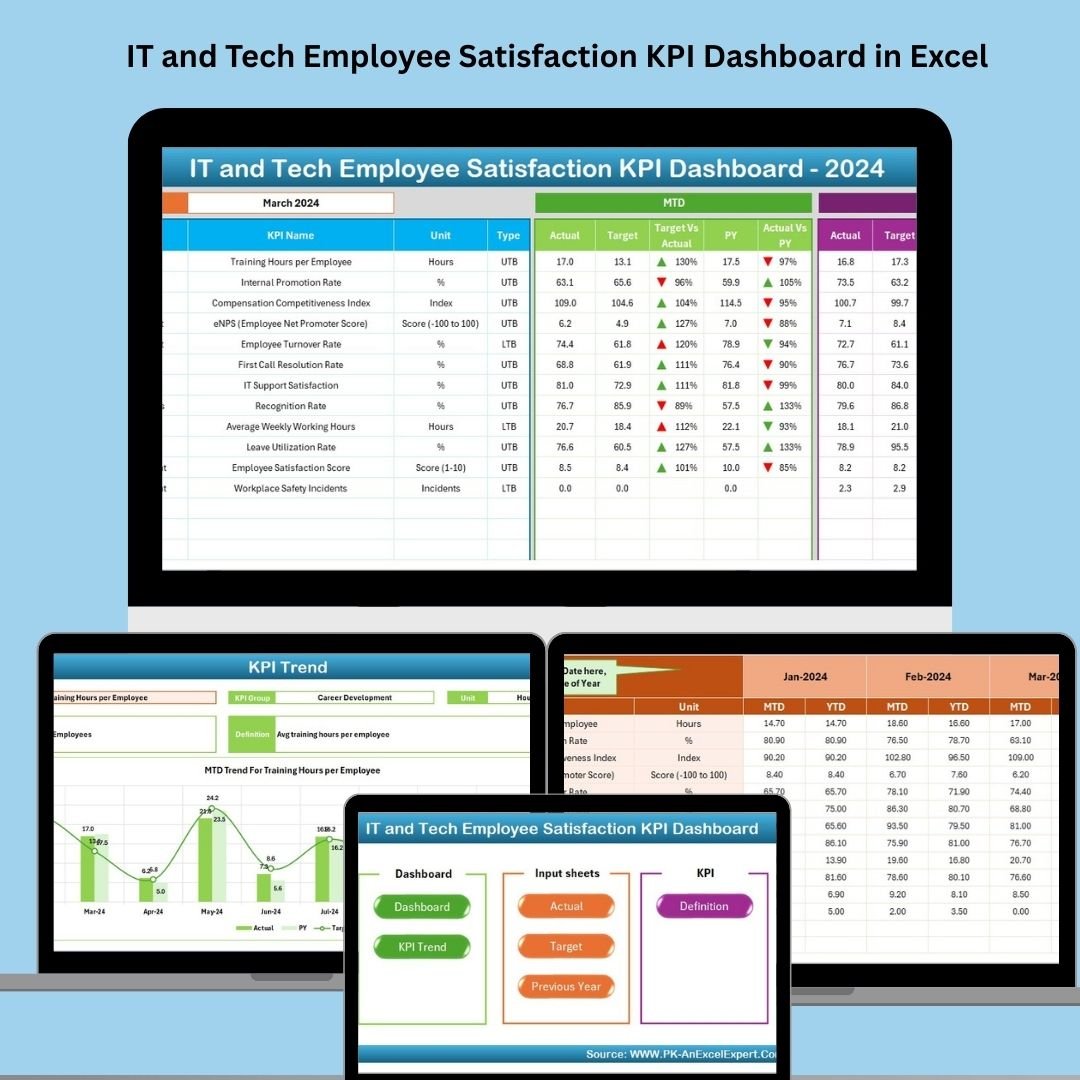
In the ever-evolving tech world, your best asset isn’t code—it’s your people. Keeping top IT talent happy, productive, and motivated requires more than casual check-ins. That’s why we created the IT and Tech Employee Satisfaction KPI Dashboard in Excel—a fully automated and visual solution to monitor employee happiness, engagement, and retention metrics in one place! 💻📈
Whether you’re managing a startup or an enterprise IT team, this dashboard gives HR professionals and managers the power to make data-driven decisions for a healthier, more loyal tech workforce.
✨ Key Features of the IT & Tech Satisfaction Dashboard
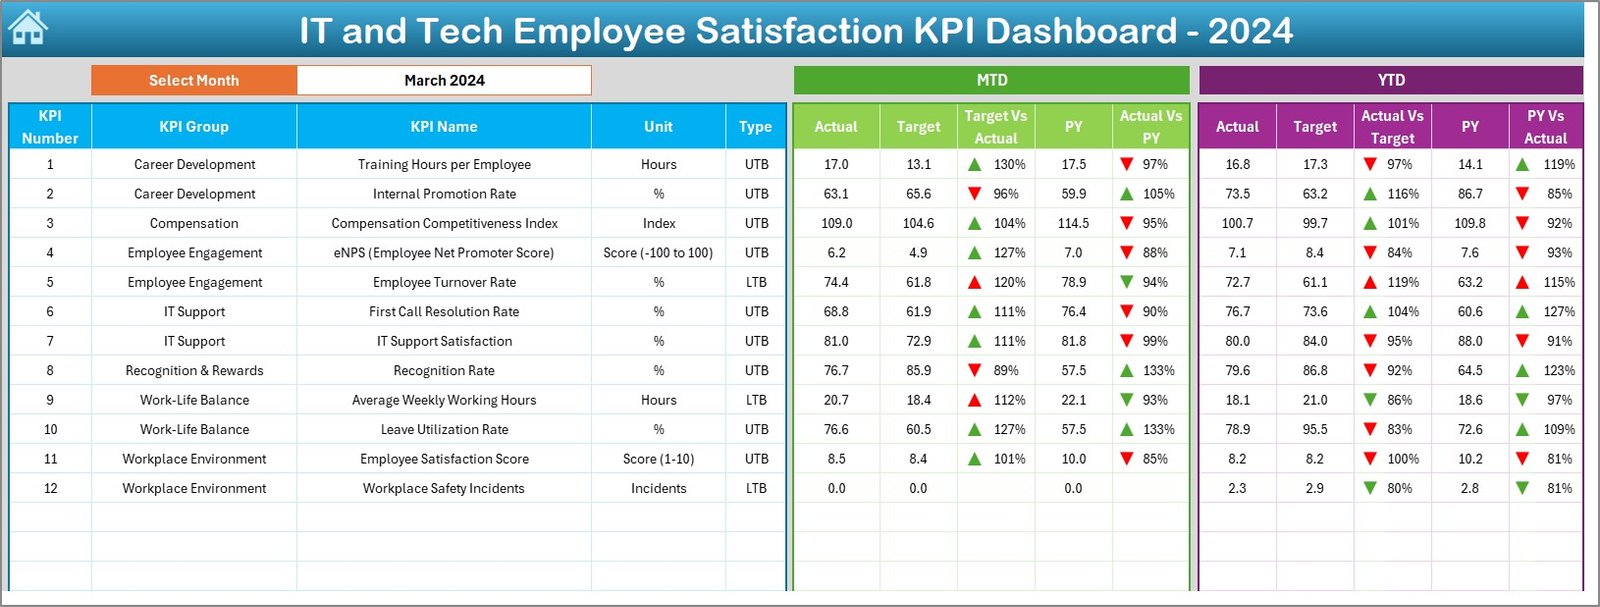
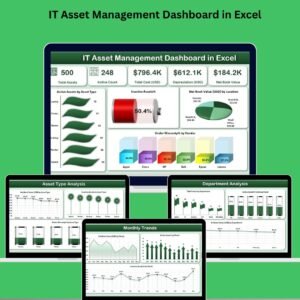
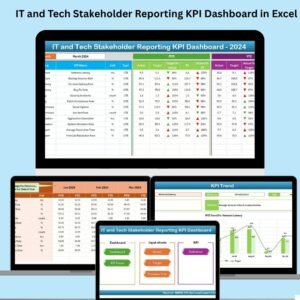
📊 Real-Time Dashboard with Monthly Filters
Track performance with ease using dropdown-based navigation for any month. See MTD, YTD, Target, and Previous Year comparisons with up/down indicators for instant clarity.
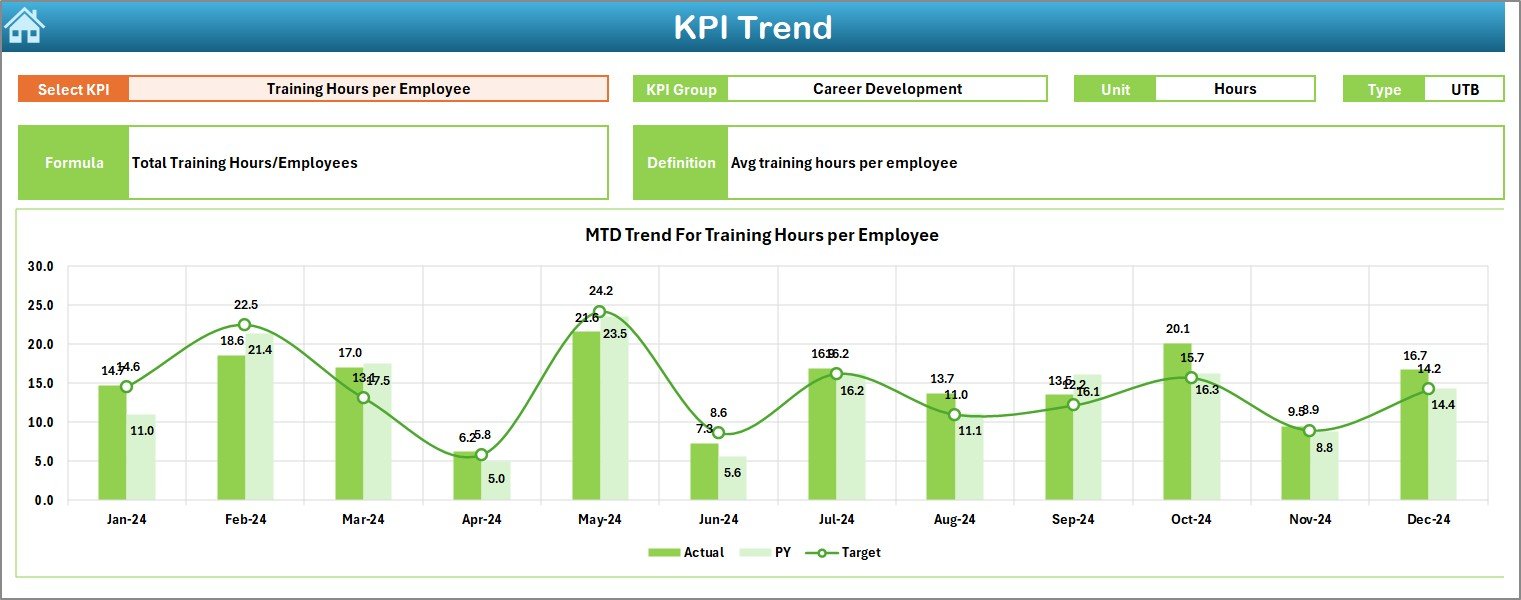
📈 KPI Trend Sheet for Deeper Insights
Select any KPI to explore monthly and yearly trends—perfect for spotting dips in engagement or peaks in productivity.
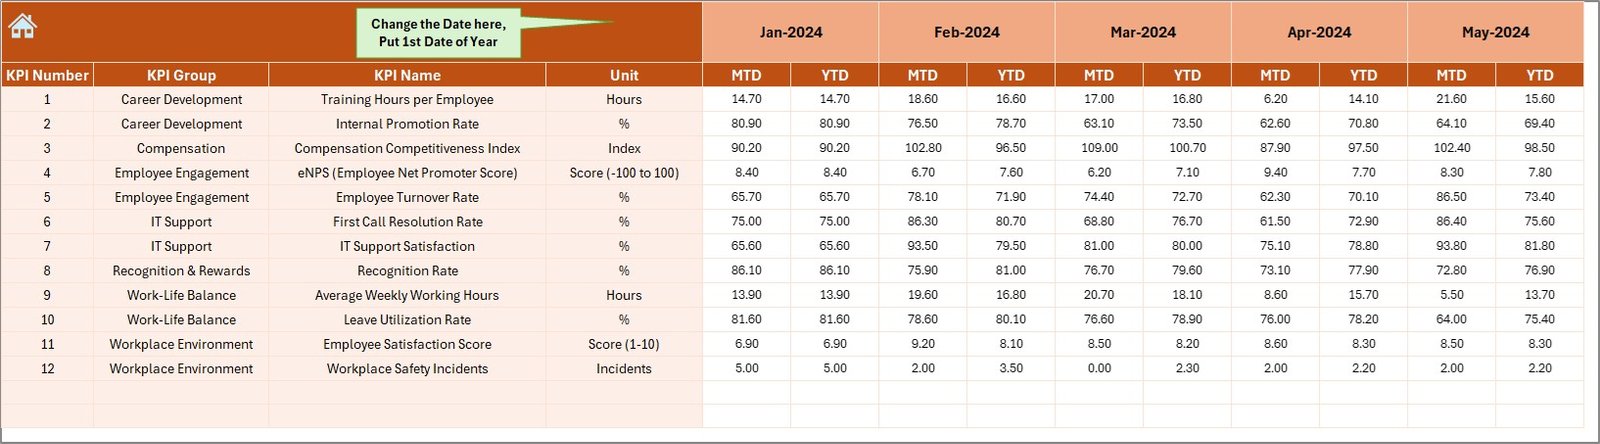
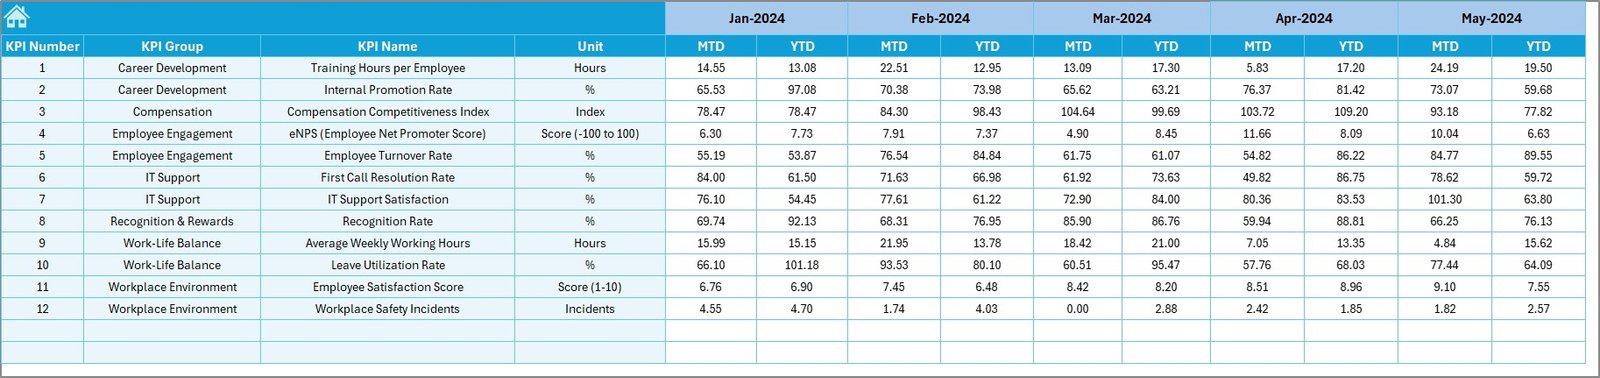
📋 Actual Numbers Input Sheet
Update performance values monthly with clearly structured rows and editable month columns.
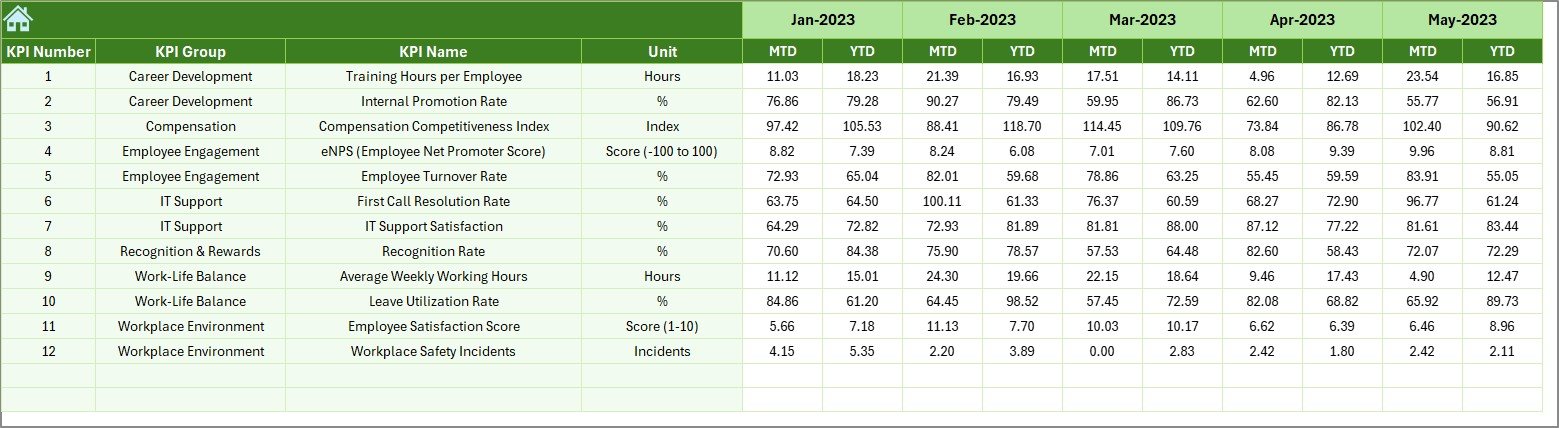
🎯 Target & Previous Year Sheets
Benchmark your goals with yearly and monthly targets. Compare with historical values to track progress and uncover issues.
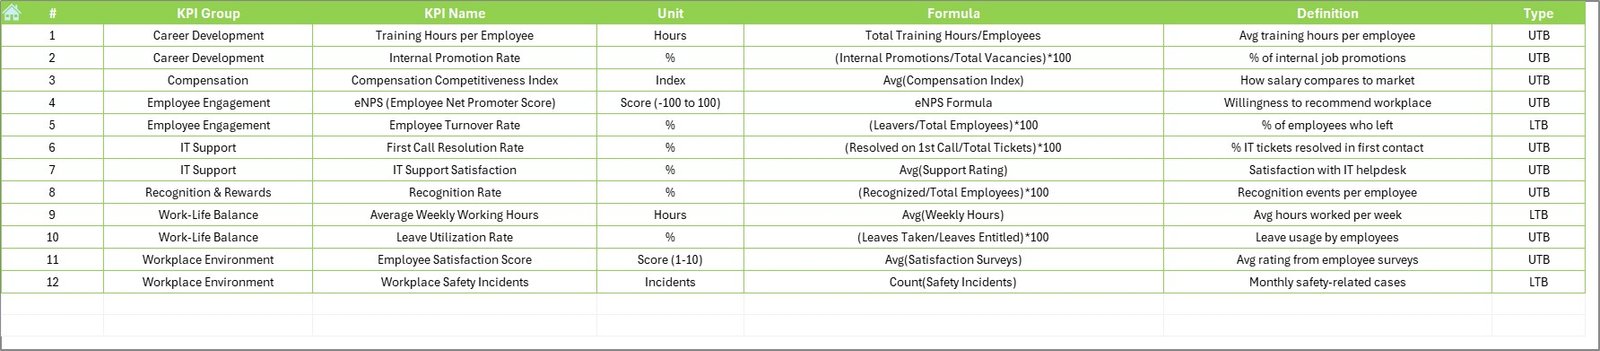
📚 KPI Definition Sheet
Understand every metric clearly with definitions, formulas, units, and performance types (UTB/LTB).
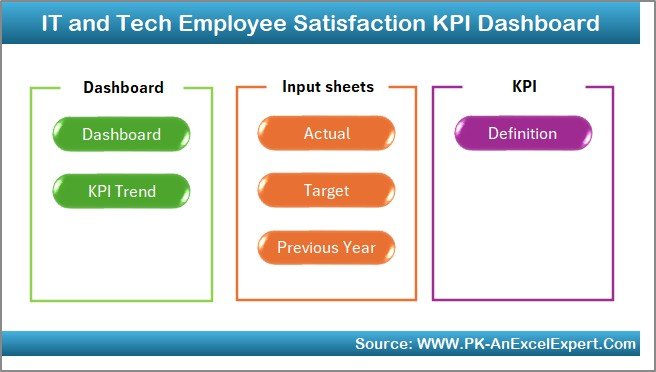
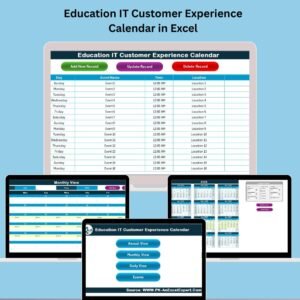
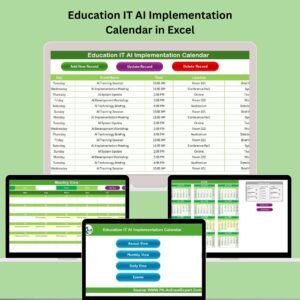
🏠 Home Sheet – One-Click Navigation
Switch between dashboard views, input sheets, and KPI definitions instantly from your homepage panel.
⚙️ Fully Customizable
Add or modify KPIs, insert departmental filters, or connect live data via Power Query or VBA.
📦 What’s Inside the Dashboard
-
✅ Dashboard Sheet with visual cues and dropdown filters
-
✅ Trendline Sheet for monthly and yearly tracking
-
✅ Input Sheet for actual performance data
-
✅ Target and Previous Year Sheets for benchmarks
-
✅ KPI Definition Sheet to standardize understanding
-
✅ Home Sheet for easy navigation
-
✅ Conditional formatting, up/down arrows, and charts
-
✅ Drop-downs for easy customization
🛠️ How to Use the Product
-
Download and unzip the file
-
Open the Excel workbook and enable macros
-
Head to the Home Sheet to start navigating
-
Enter actuals in the Input Sheet each month
-
Set monthly/yearly targets and compare with previous year data
-
Watch the dashboard update automatically—no coding needed!
You can also edit the KPI list and add team-level filters for a more granular view.
🎯 Who Can Benefit from This Dashboard?
👩💻 IT Managers & Team Leads
Quickly assess team satisfaction and spot issues early.
🧑🔧 HR Professionals in Tech Companies
Monitor engagement and optimize retention strategies.
🧠 Data-Driven Organizations
Use insights to drive action across departments.
🏢 Startups & Enterprises Alike
Whether scaling or stabilizing, this tool adapts to your needs.
🔗 Click here to read the Detailed blog post
📺 Visit our YouTube channel to learn step-by-step video tutorials


Reviews
There are no reviews yet.