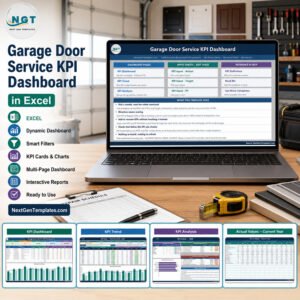
Heritage tourism is more than visitor footfall. It represents cultural preservation, community engagement, economic growth, and long-term sustainability. Historical monuments attract visitors year-round. Cultural festivals create seasonal spikes. Restoration budgets fluctuate. Therefore, performance tracking becomes critical.
Heritage Tourism KPI Dashboard in Excel However, many heritage tourism authorities still rely on scattered spreadsheets and manual reports. As a result, revenue trends remain unclear. Visitor engagement is difficult to measure. Budget planning becomes reactive instead of strategic.
Heritage Tourism KPI Dashboard in Excel That is exactly where the Heritage Tourism KPI Dashboard in Excel delivers powerful value.
This ready-to-use Excel dashboard is specifically designed for heritage site managers, tourism boards, museums, and cultural departments. It allows you to track visitor numbers, revenue performance, operational efficiency, restoration costs, and growth trends — all in one structured system.
Instead of reviewing raw numbers across multiple sheets, you get:
📊 MTD and YTD performance tracking
📈 Target vs Actual comparison
📅 Previous Year vs Current Year analysis
🎯 Visual performance indicators
📌 KPI trend analysis with dynamic charts
Because it runs entirely in Excel, implementation is simple and cost-effective. No complex software. No technical dependency. Just structured, intelligent reporting.
📦 What’s Inside the Heritage Tourism KPI Dashboard?
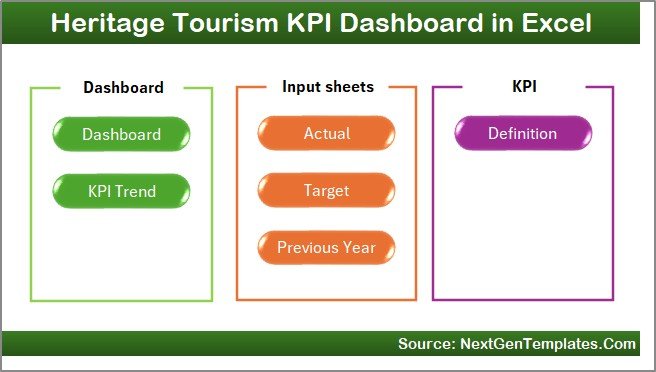
This template includes 7 professionally structured worksheets; each designed for clarity and performance control.
🏠 1️⃣ Home Sheet – Navigation Center
The Home sheet acts as your command panel.
It includes:
6 Navigation Buttons
Clean layout for easy access
One-click sheet switching
Therefore, even first-time users can navigate comfortably without searching through tabs.
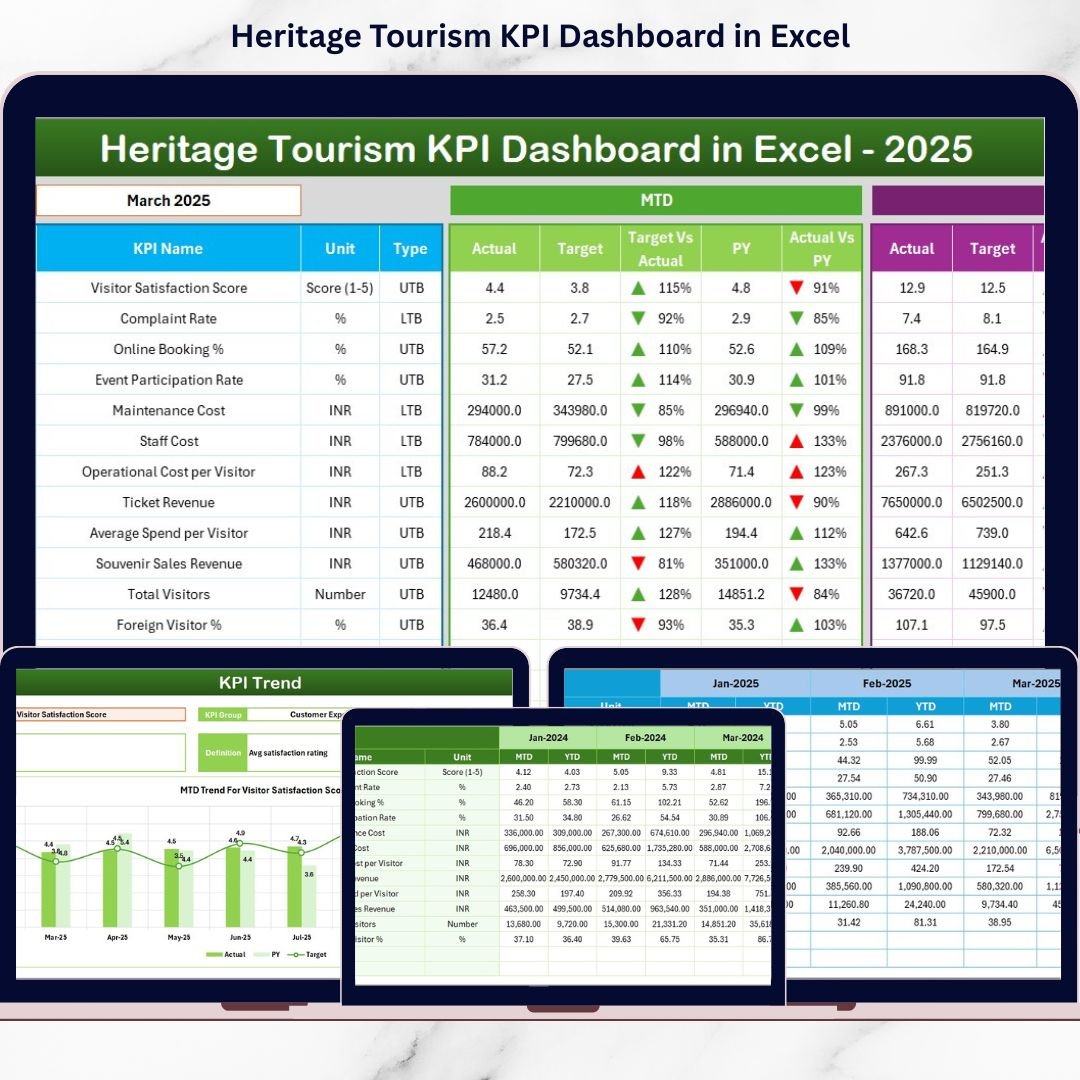
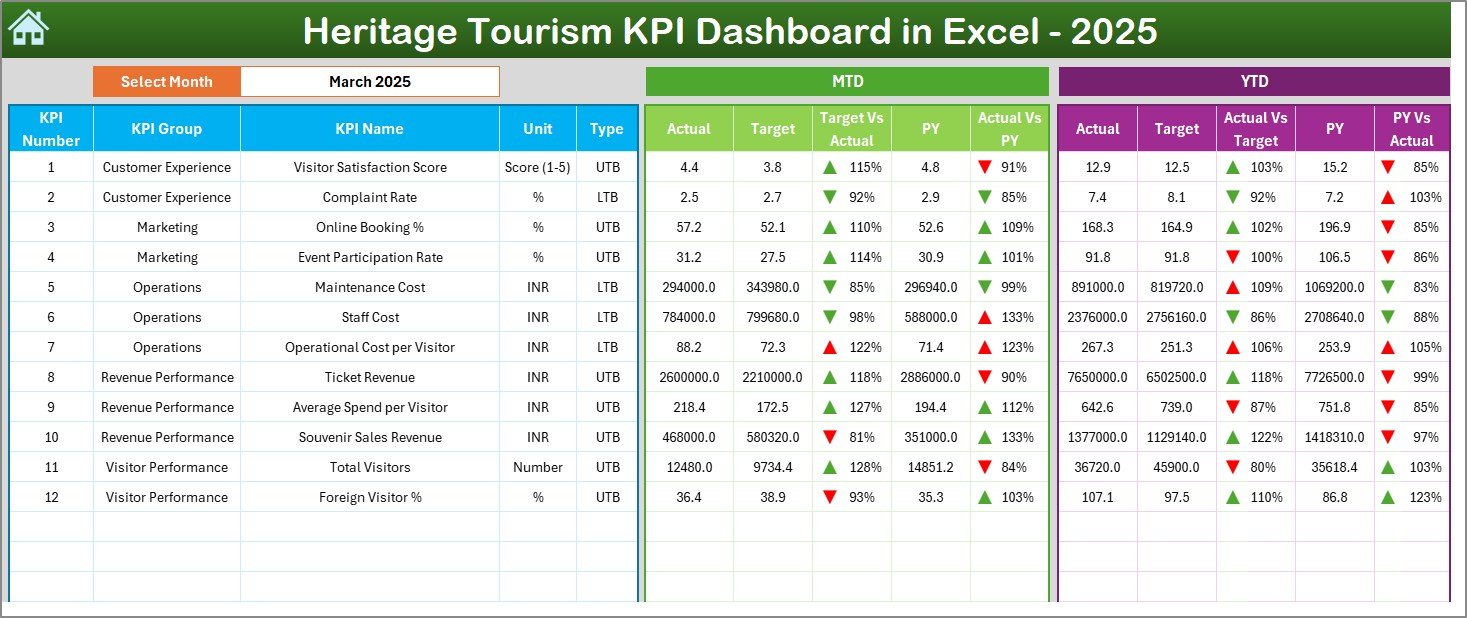
📊 2️⃣ Dashboard Sheet – Main Performance Overview
The Dashboard Sheet is the heart of the template.
📌 Month Selection (Cell D3)
Select any month and the entire dashboard updates automatically.
MTD Section Displays:
MTD Actual
MTD Target
MTD Previous Year
Target vs Actual Difference
PY vs Actual Difference
YTD Section Displays:
YTD Actual
YTD Target
YTD Previous Year
Target vs Actual Difference
PY vs Actual Difference
The dashboard uses conditional formatting with arrows and color indicators to highlight improvement or decline instantly.
As a result, leadership can evaluate performance at a glance.
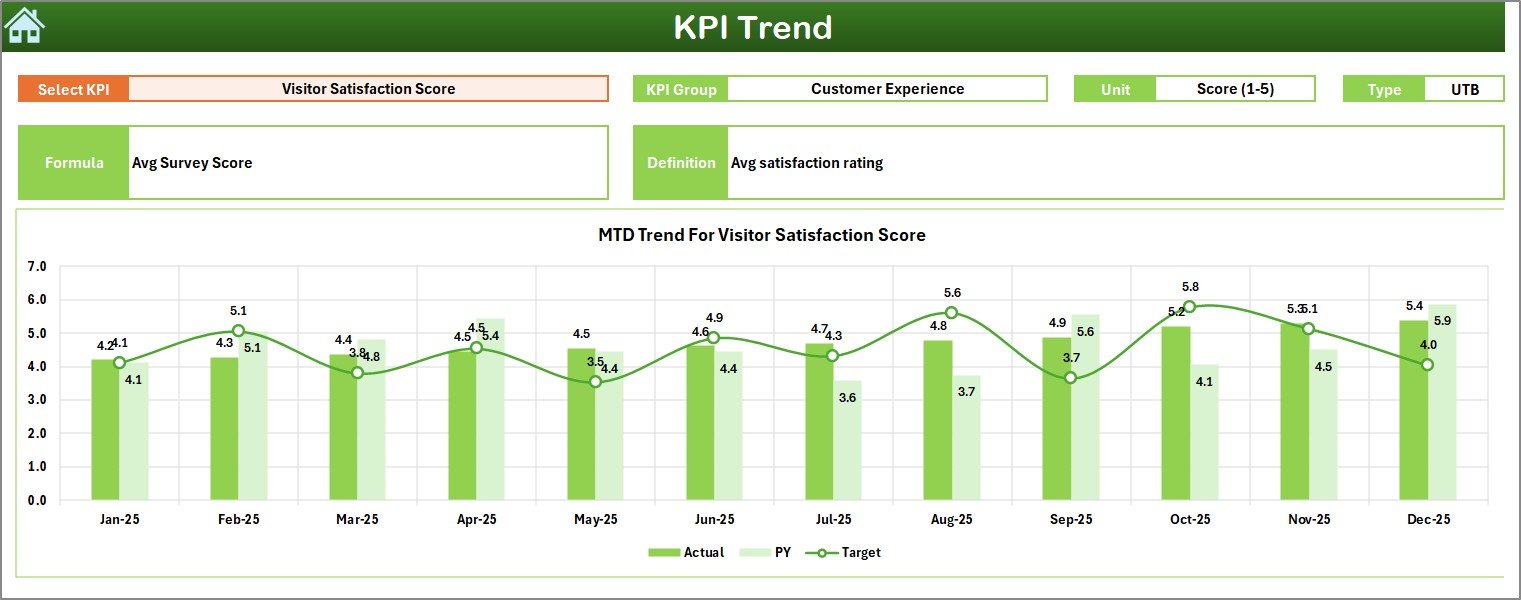
📈 3️⃣ KPI Trend Sheet – In-Depth KPI Analysis
The KPI Trend sheet helps you analyze one KPI at a time.
📌 KPI Selection (Cell C3)
Choose any KPI from the dropdown.
The sheet automatically displays:
KPI Group
Unit of Measurement
KPI Type (LTB / UTB)
KPI Formula
KPI Definition
Trend Charts Included:
MTD Trend (Actual vs Target vs PY)
YTD Trend (Actual vs Target vs PY)
This makes seasonal analysis and festival-driven spikes clearly visible.
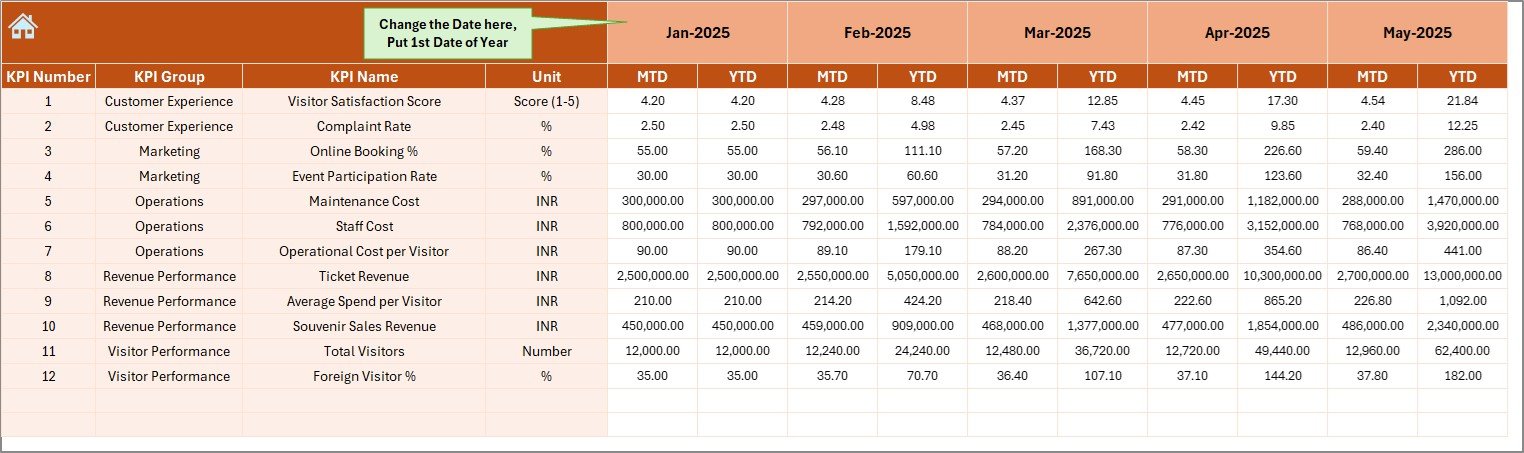
✍ 4️⃣ Actual Numbers Input Sheet
This sheet captures current year data.
You enter:
Monthly MTD values
Monthly YTD values
Set the starting month in Cell E1 and the system aligns the year automatically.
Because data connects directly to the dashboard, updates reflect instantly.
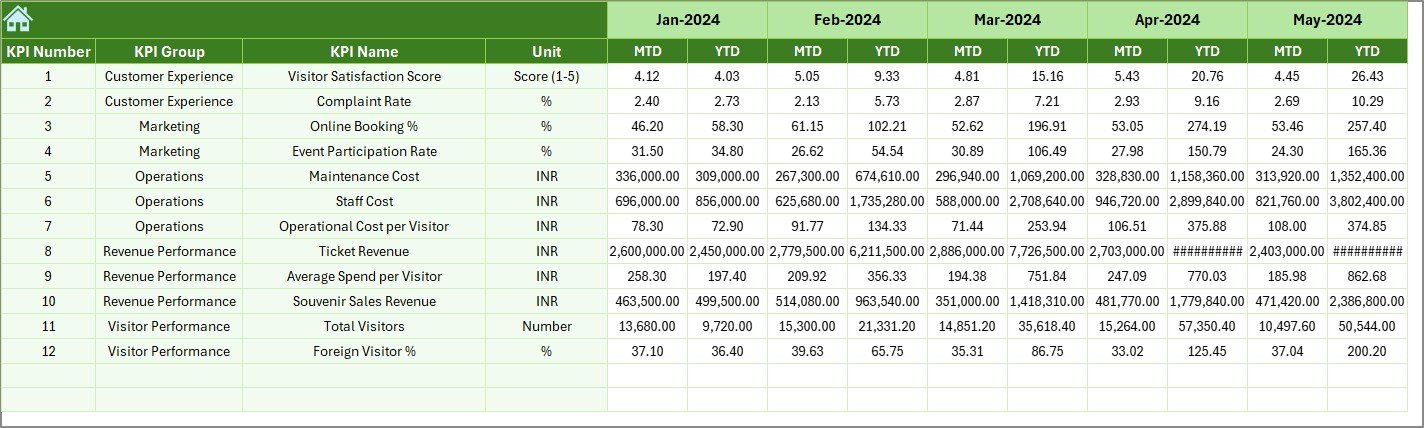
🎯 5️⃣ Target Sheet
Define performance goals here:
Monthly MTD Targets
Monthly YTD Targets
Without defined targets, KPI tracking loses meaning. This sheet ensures goal-driven performance.
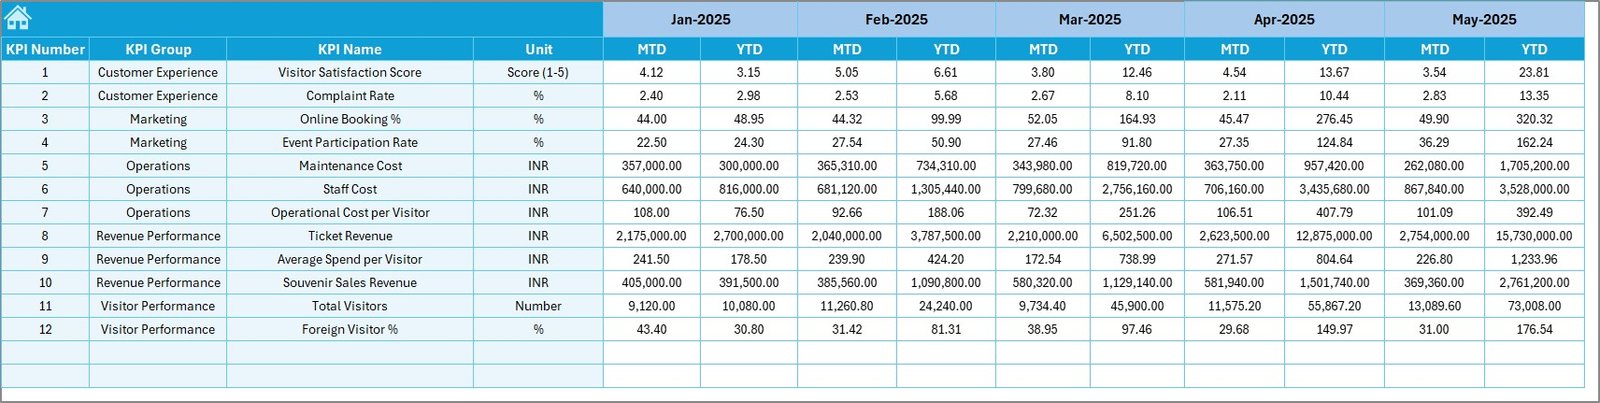
📅 6️⃣ Previous Year Numbers Sheet
Enter previous year data to enable:
Year-on-Year comparison
Growth analysis
Revenue trend measurement
Visitor growth evaluation
Long-term improvement becomes measurable and strategic.
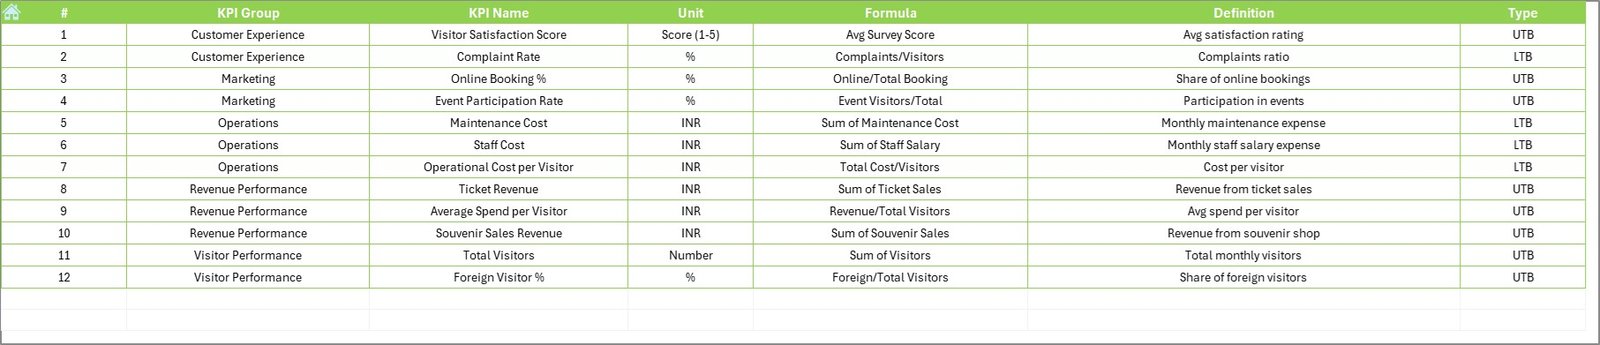
📘 7️⃣ KPI Definition Sheet
This sheet stores:
KPI Name
KPI Group
Unit
Formula
KPI Definition
This ensures transparency and standardized KPI interpretation across departments.
📊 Key KPIs You Can Track
The dashboard supports both operational and financial KPIs.
🎟 Visitor KPIs
Total Visitors
Domestic vs International Visitors
Repeat Visitor Rate
Event Participation Rate
💰 Financial KPIs
Ticket Revenue
Average Revenue per Visitor
Donation Revenue
Merchandise Sales
Restoration Budget Utilization
🏛 Operational KPIs
Maintenance Cost
Event Success Rate
Staff Efficiency
Visitor Satisfaction Score
Because heritage tourism involves preservation and revenue, this balanced KPI approach ensures sustainable growth.
🚀 How This Dashboard Improves Heritage Tourism Management
✔ Provides centralized performance visibility
✔ Supports strategic budget allocation
✔ Identifies seasonal demand patterns
✔ Enhances restoration planning
✔ Strengthens marketing decisions
✔ Improves accountability
When you measure clearly, you preserve successfully.
🎯 Advantages of Heritage Tourism KPI Dashboard in Excel
1️⃣ Easy to Use – No advanced technical skills required
2️⃣ Cost-Effective – No expensive BI tools needed
3️⃣ Real-Time Updates – Instant dashboard refresh
4️⃣ Clear Visual Indicators – Faster decisions
5️⃣ Structured KPI Framework – Standardized reporting
6️⃣ Fully Customizable – Add or modify KPIs
7️⃣ Scalable – Suitable for small sites and large tourism boards
👥 Who Should Use This Dashboard?
Heritage Site Managers
Tourism Boards
Museum Administrators
Cultural Event Organizers
Government Tourism Departments
Preservation Authorities
🔧 Best Practices for Maximum Results
✔ Update performance data monthly
✔ Set realistic targets based on historical trends
✔ Focus on critical KPIs (15–20 maximum)
✔ Conduct quarterly performance reviews
✔ Train team members on KPI definitions
✔ Use insights for strategic planning
Click here to read the Detailed blog post
Visit our YouTube channel to learn step-by-step video tutorials
👉 https://youtube.com/@PKAnExcelExpert