Sustainability and profitability should never compete — they should grow together 🌱📊. However, many eco resorts struggle to track performance while balancing environmental responsibility, guest satisfaction, and operational efficiency. That is exactly where the Eco Resorts KPI Dashboard in Excel becomes a powerful game-changer.
This professionally designed, ready-to-use Excel dashboard helps eco resort owners, managers, and sustainability teams monitor all critical KPIs in one centralized system. Instead of juggling multiple Excel files, manual logs, or disconnected reports, you get a clear, structured, and automated KPI view that supports smart, data-driven decisions.
Built completely in Microsoft Excel, this dashboard requires no advanced BI tools, no complex setup, and no steep learning curve. You simply input your data, select the month, and instantly visualize performance trends, variances, and sustainability metrics — all in one place.
🌟 Key Features of Eco Resorts KPI Dashboard in Excel
✅ Centralized KPI Monitoring – Track operational, financial, and sustainability KPIs from a single dashboard
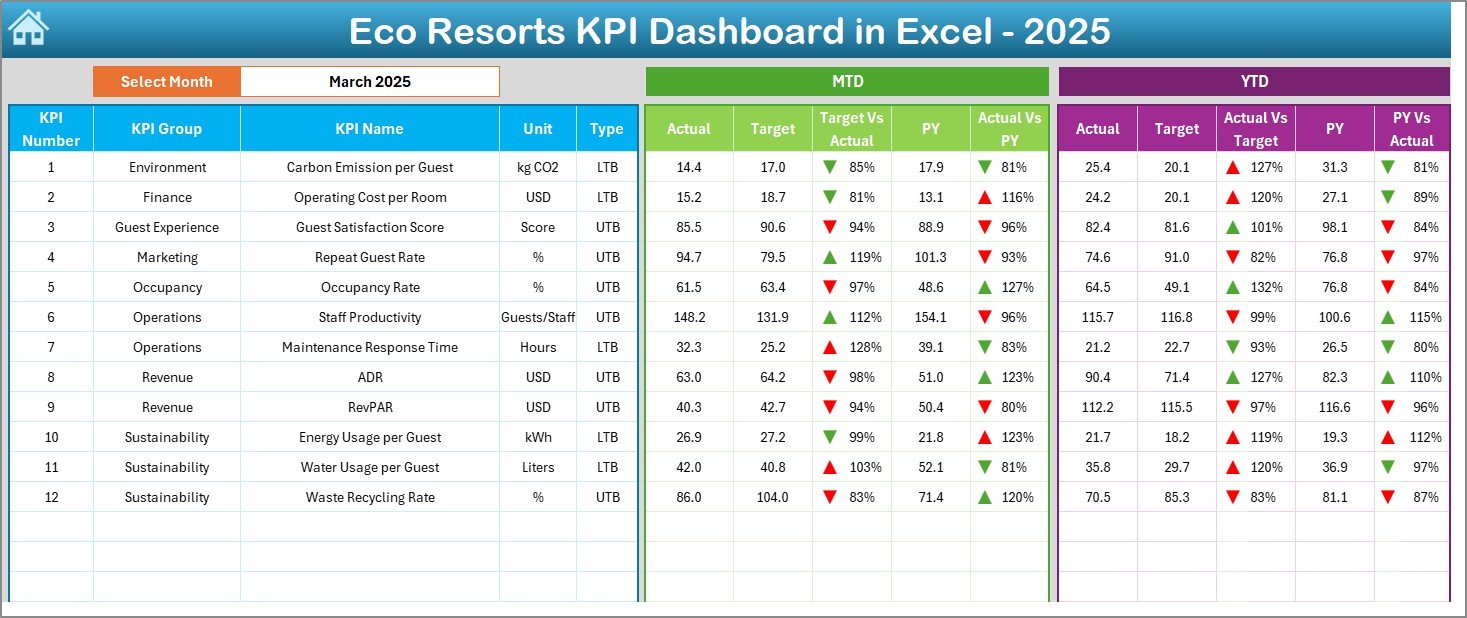
✅ MTD & YTD Analysis – View Month-to-Date and Year-to-Date performance together for better control
✅ Target vs Actual Comparison – Instantly identify gaps and performance shortfalls
✅ Previous Year Comparison – Measure year-on-year growth and sustainability improvements
✅ Dynamic Month & KPI Selection – Analyze different periods and KPIs with simple drop-downs
✅ Automated Calculations – Reduce manual work and eliminate calculation errors
✅ Conditional Formatting – Up/down arrows clearly highlight positive and negative trends
✅ User-Friendly Navigation – One-click buttons to move across worksheets effortlessly
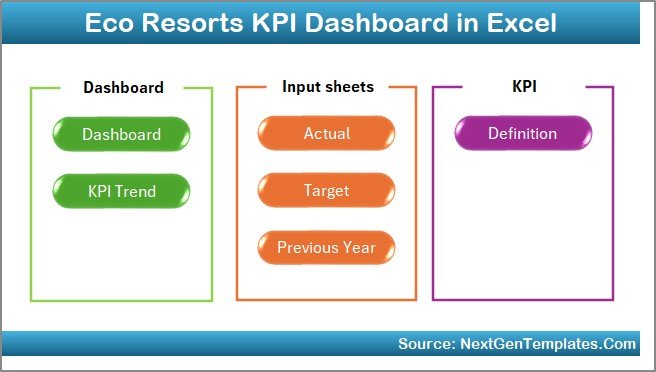
📦 What’s Inside the Eco Resorts KPI Dashboard in Excel
📌 Summary (Index) Sheet
Acts as a navigation hub with buttons linking to all dashboard sections.
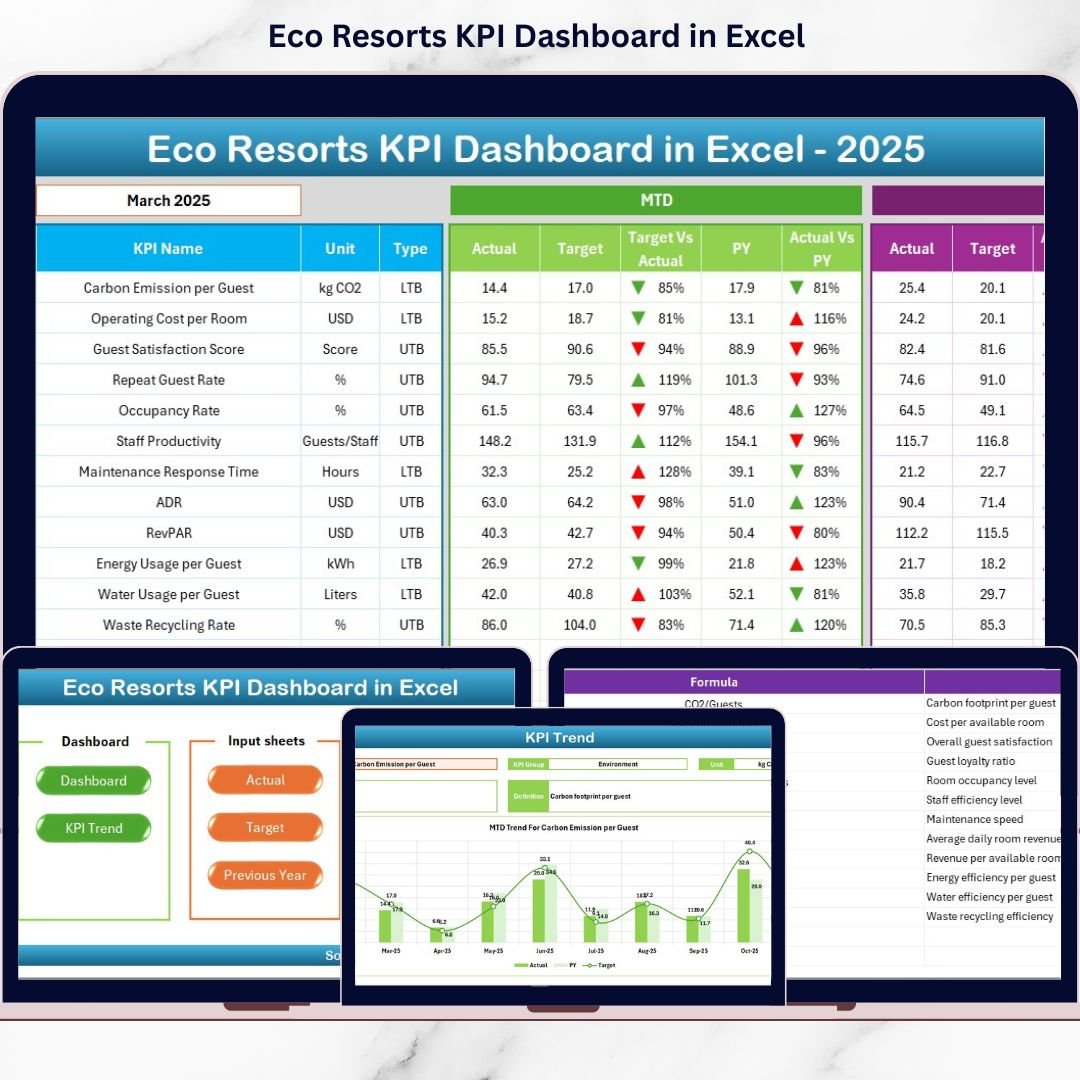
📌 Main KPI Dashboard Sheet
Displays MTD and YTD actuals, targets, previous year values, and variance indicators in a clean layout.
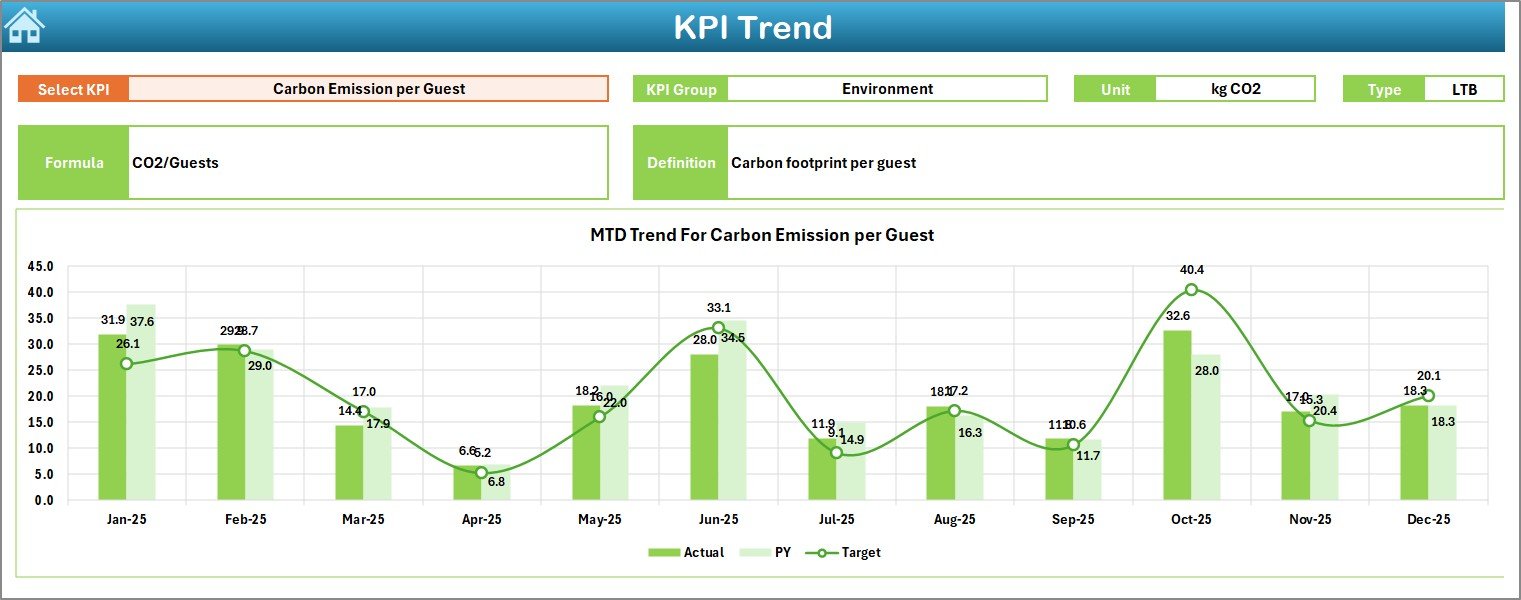
📌 Trend Analysis Sheet
Visualizes KPI trends over time with MTD and YTD charts for deeper insights.
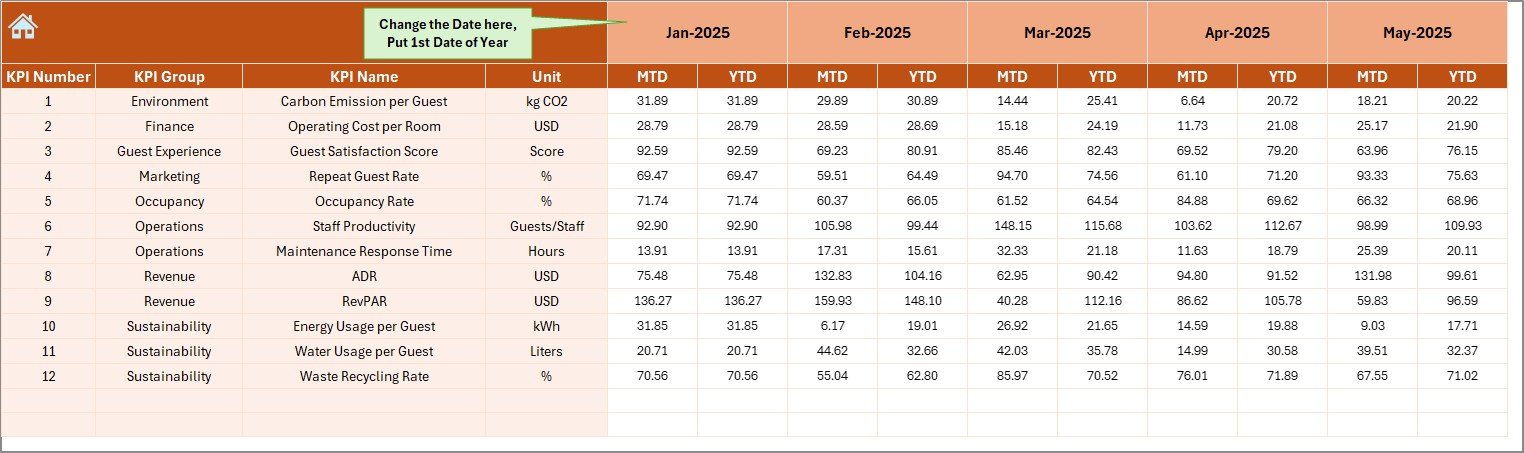
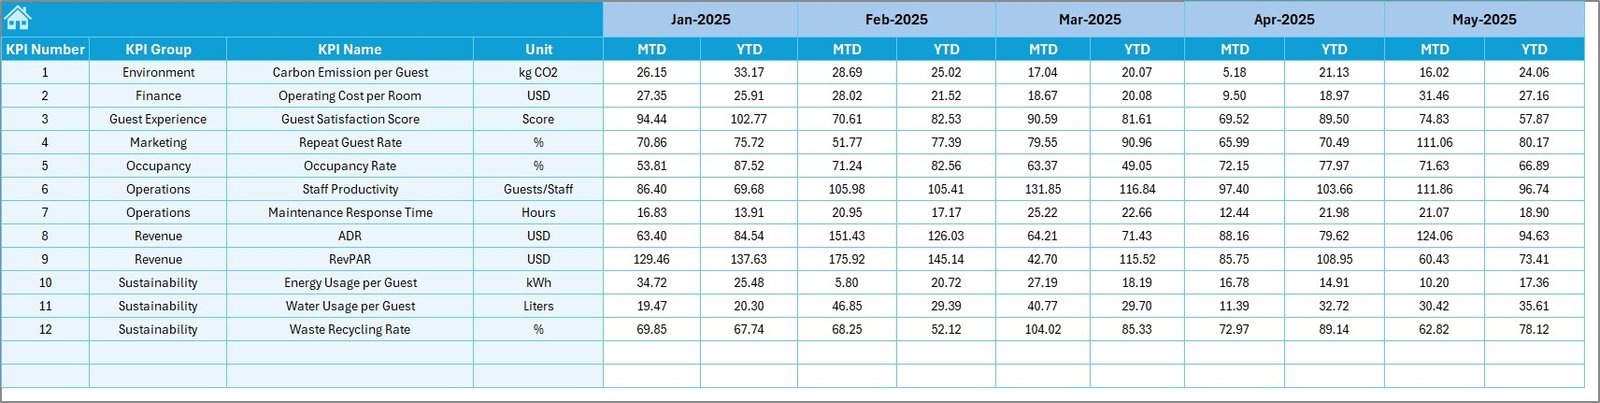
📌 Actual Numbers Input Sheet
Dedicated area to enter actual performance data without disturbing formulas.
📌 Target Sheet
Store planned MTD and YTD targets for accurate variance analysis.
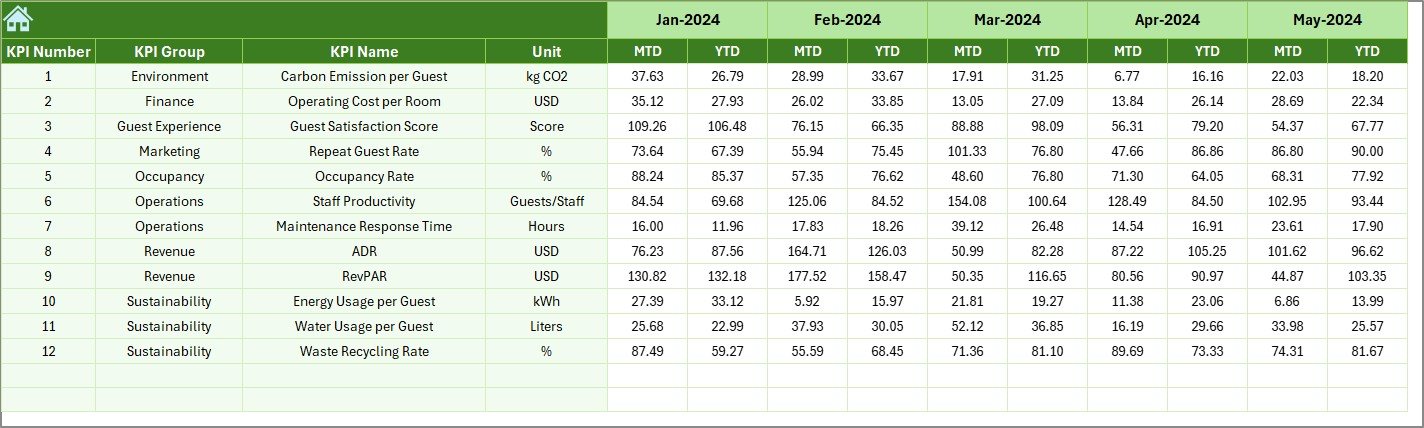
📌 Previous Year Numbers Sheet
Supports historical comparison and long-term performance tracking.
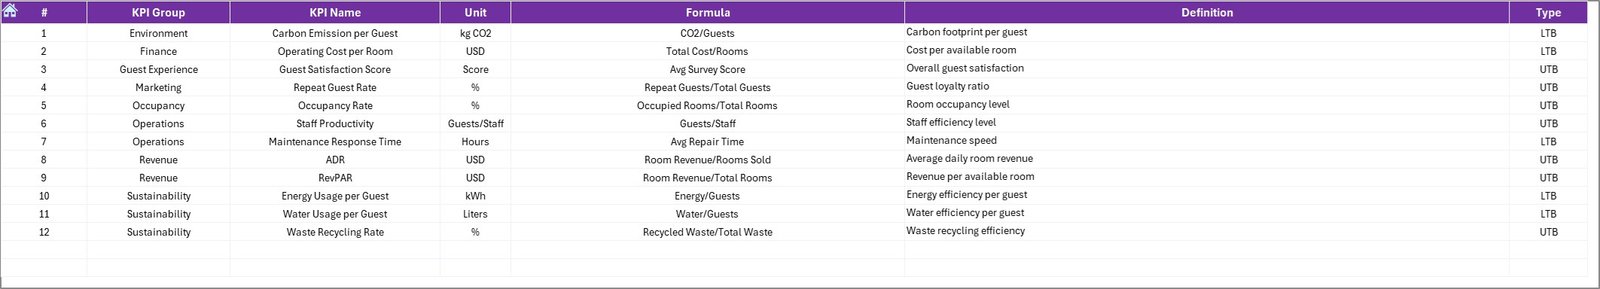
📌 KPI Definition Sheet
Maintains standardized KPI names, formulas, units, and definitions for clarity and consistency.
🛠️ How to Use the Eco Resorts KPI Dashboard in Excel
1️⃣ Enter actual performance data in the Actual Numbers sheet
2️⃣ Add targets in the Target sheet
3️⃣ Update previous year data once for comparison
4️⃣ Select the required month from the drop-down
5️⃣ Instantly review MTD, YTD, trends, and variances
6️⃣ Use insights to improve efficiency and sustainability initiatives
No technical expertise required — everything updates automatically ⚡.
🎯 Who Can Benefit from This Eco Resorts KPI Dashboard in Excel
🌿 Eco Resort Owners & Founders
📊 Resort Managers & Operations Teams
🌍 Sustainability & ESG Teams
🏨 Hospitality Consultants
📈 Finance & Strategy Teams
🧾 Excel-Based Reporting Users
If you want clear visibility, smarter decisions, and sustainable growth, this dashboard is built for you.
Click here to read the Detailed blog post
Watch the step-by-step video tutorial:


